Key Takeaways
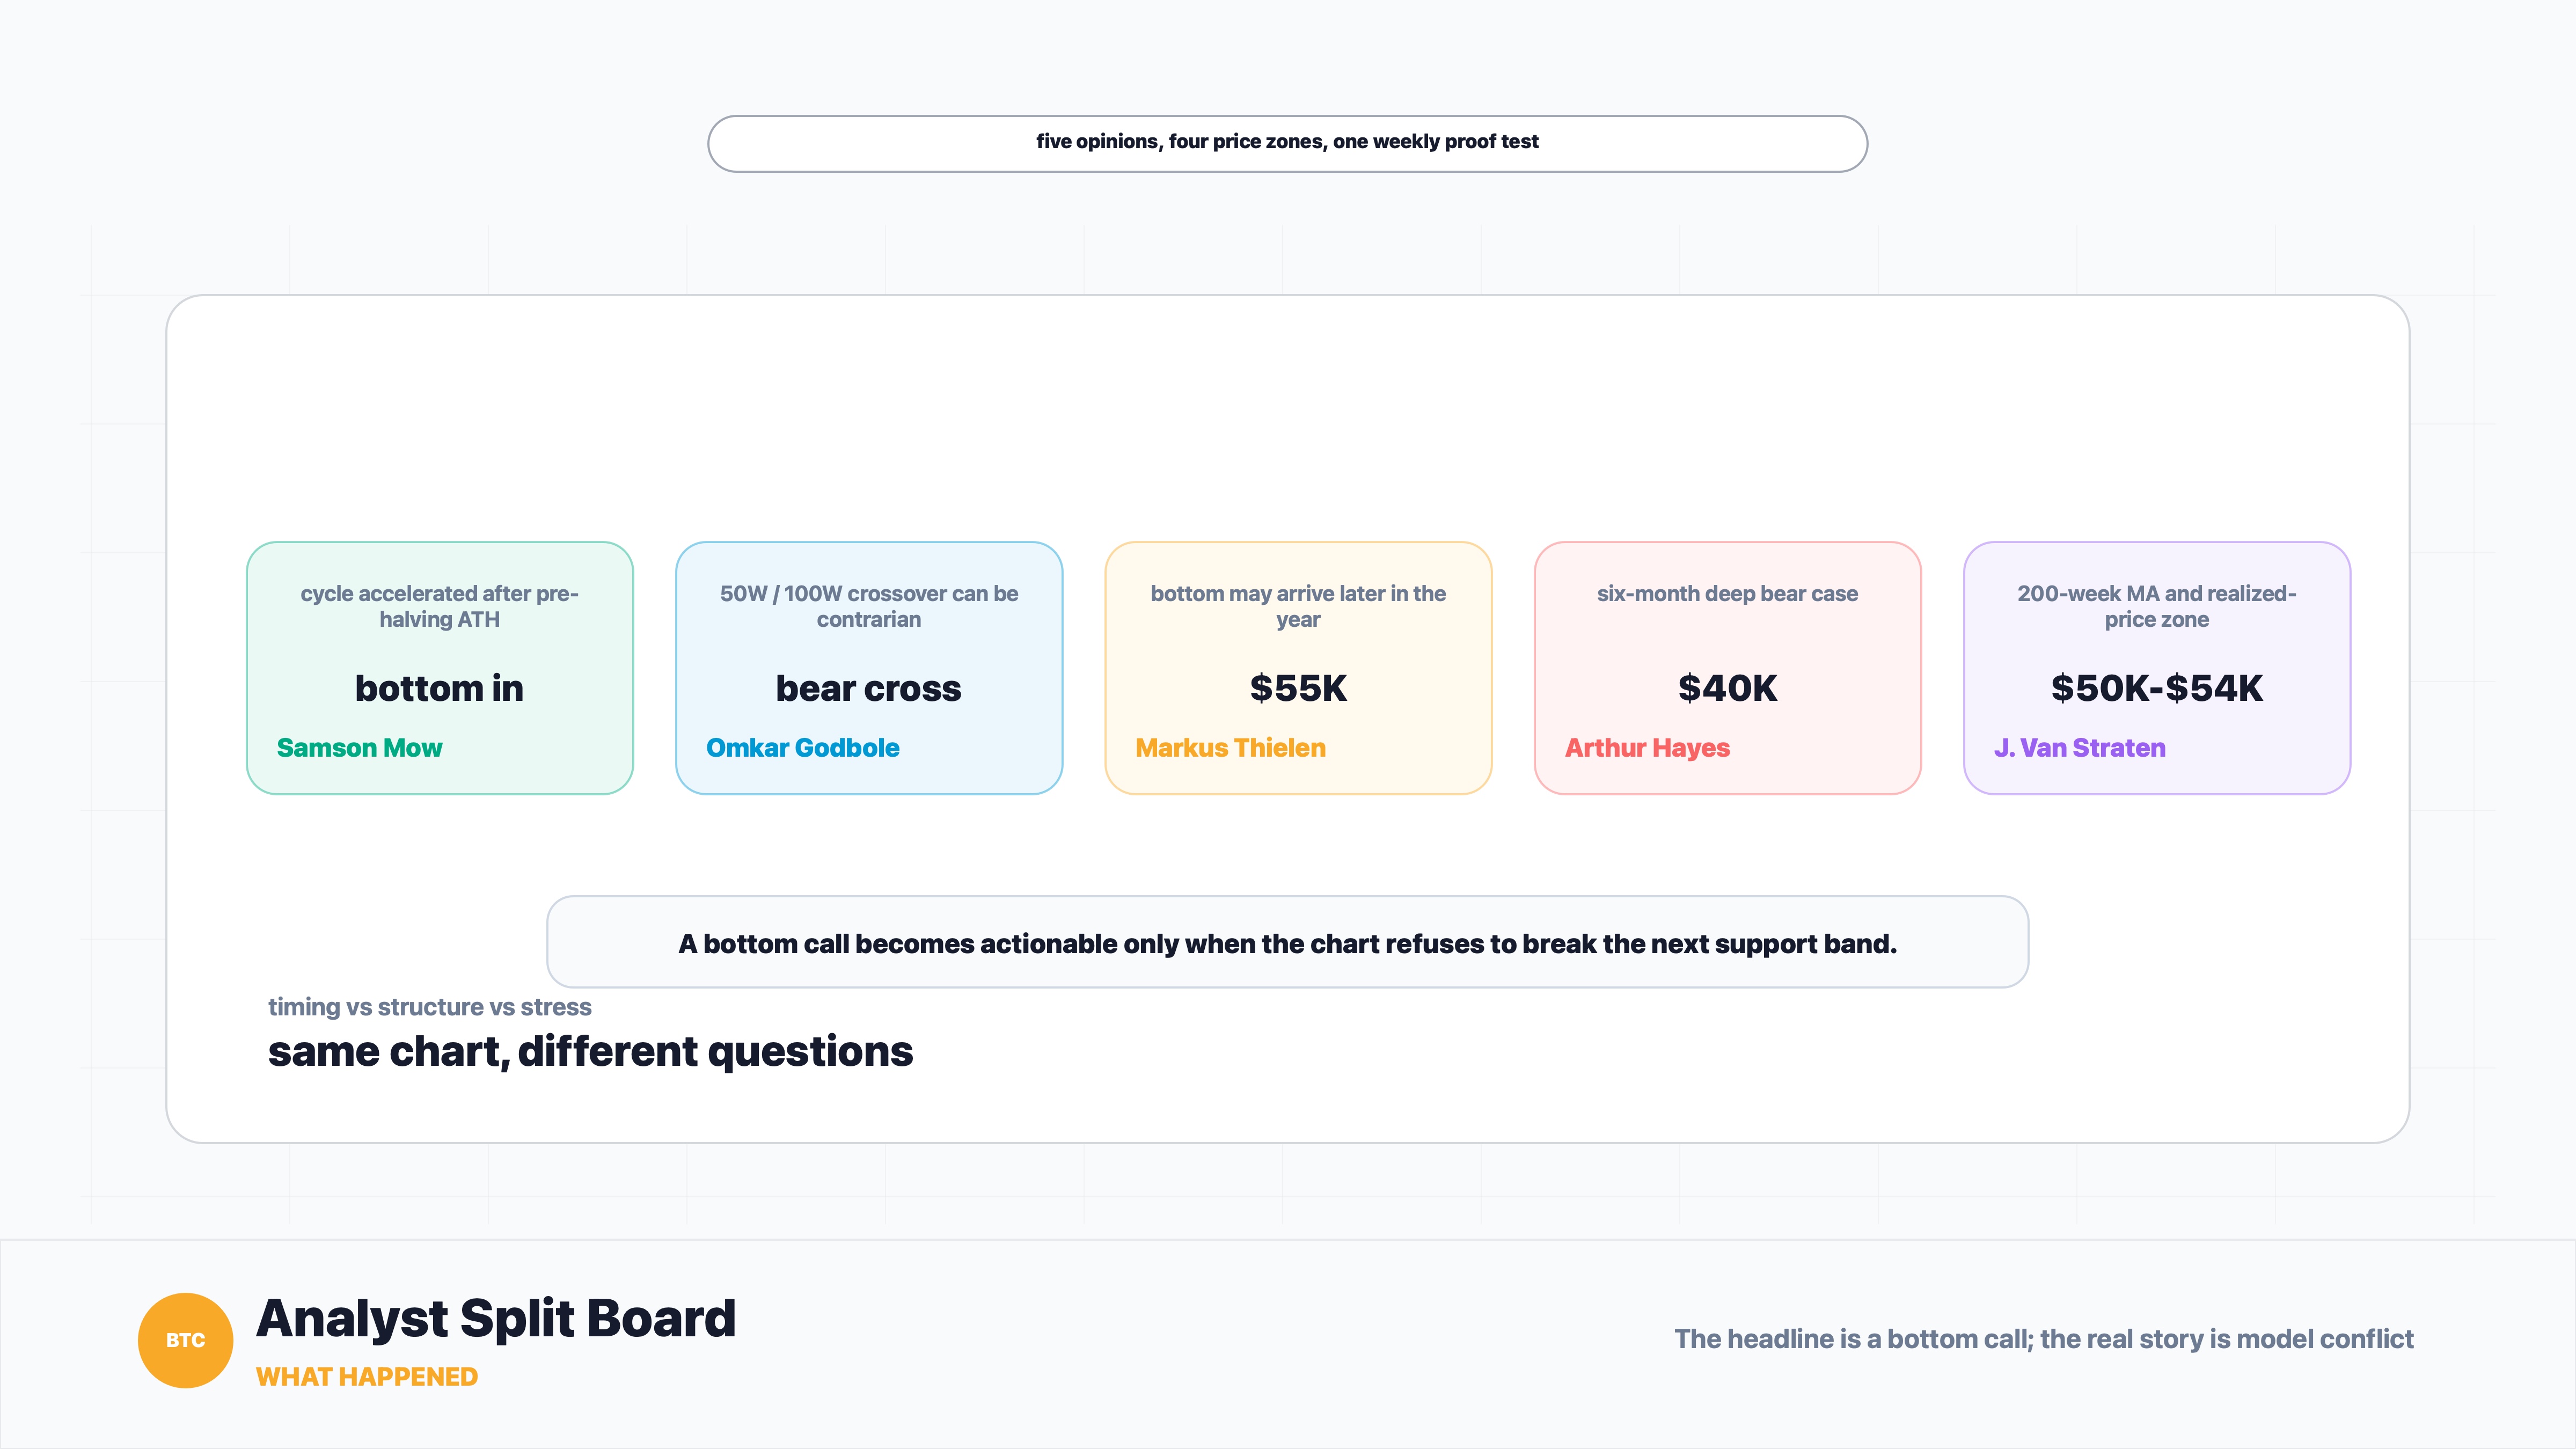
- Samson Mow says the Bitcoin bottom is already in, arguing that the old four-year halving cycle has accelerated.
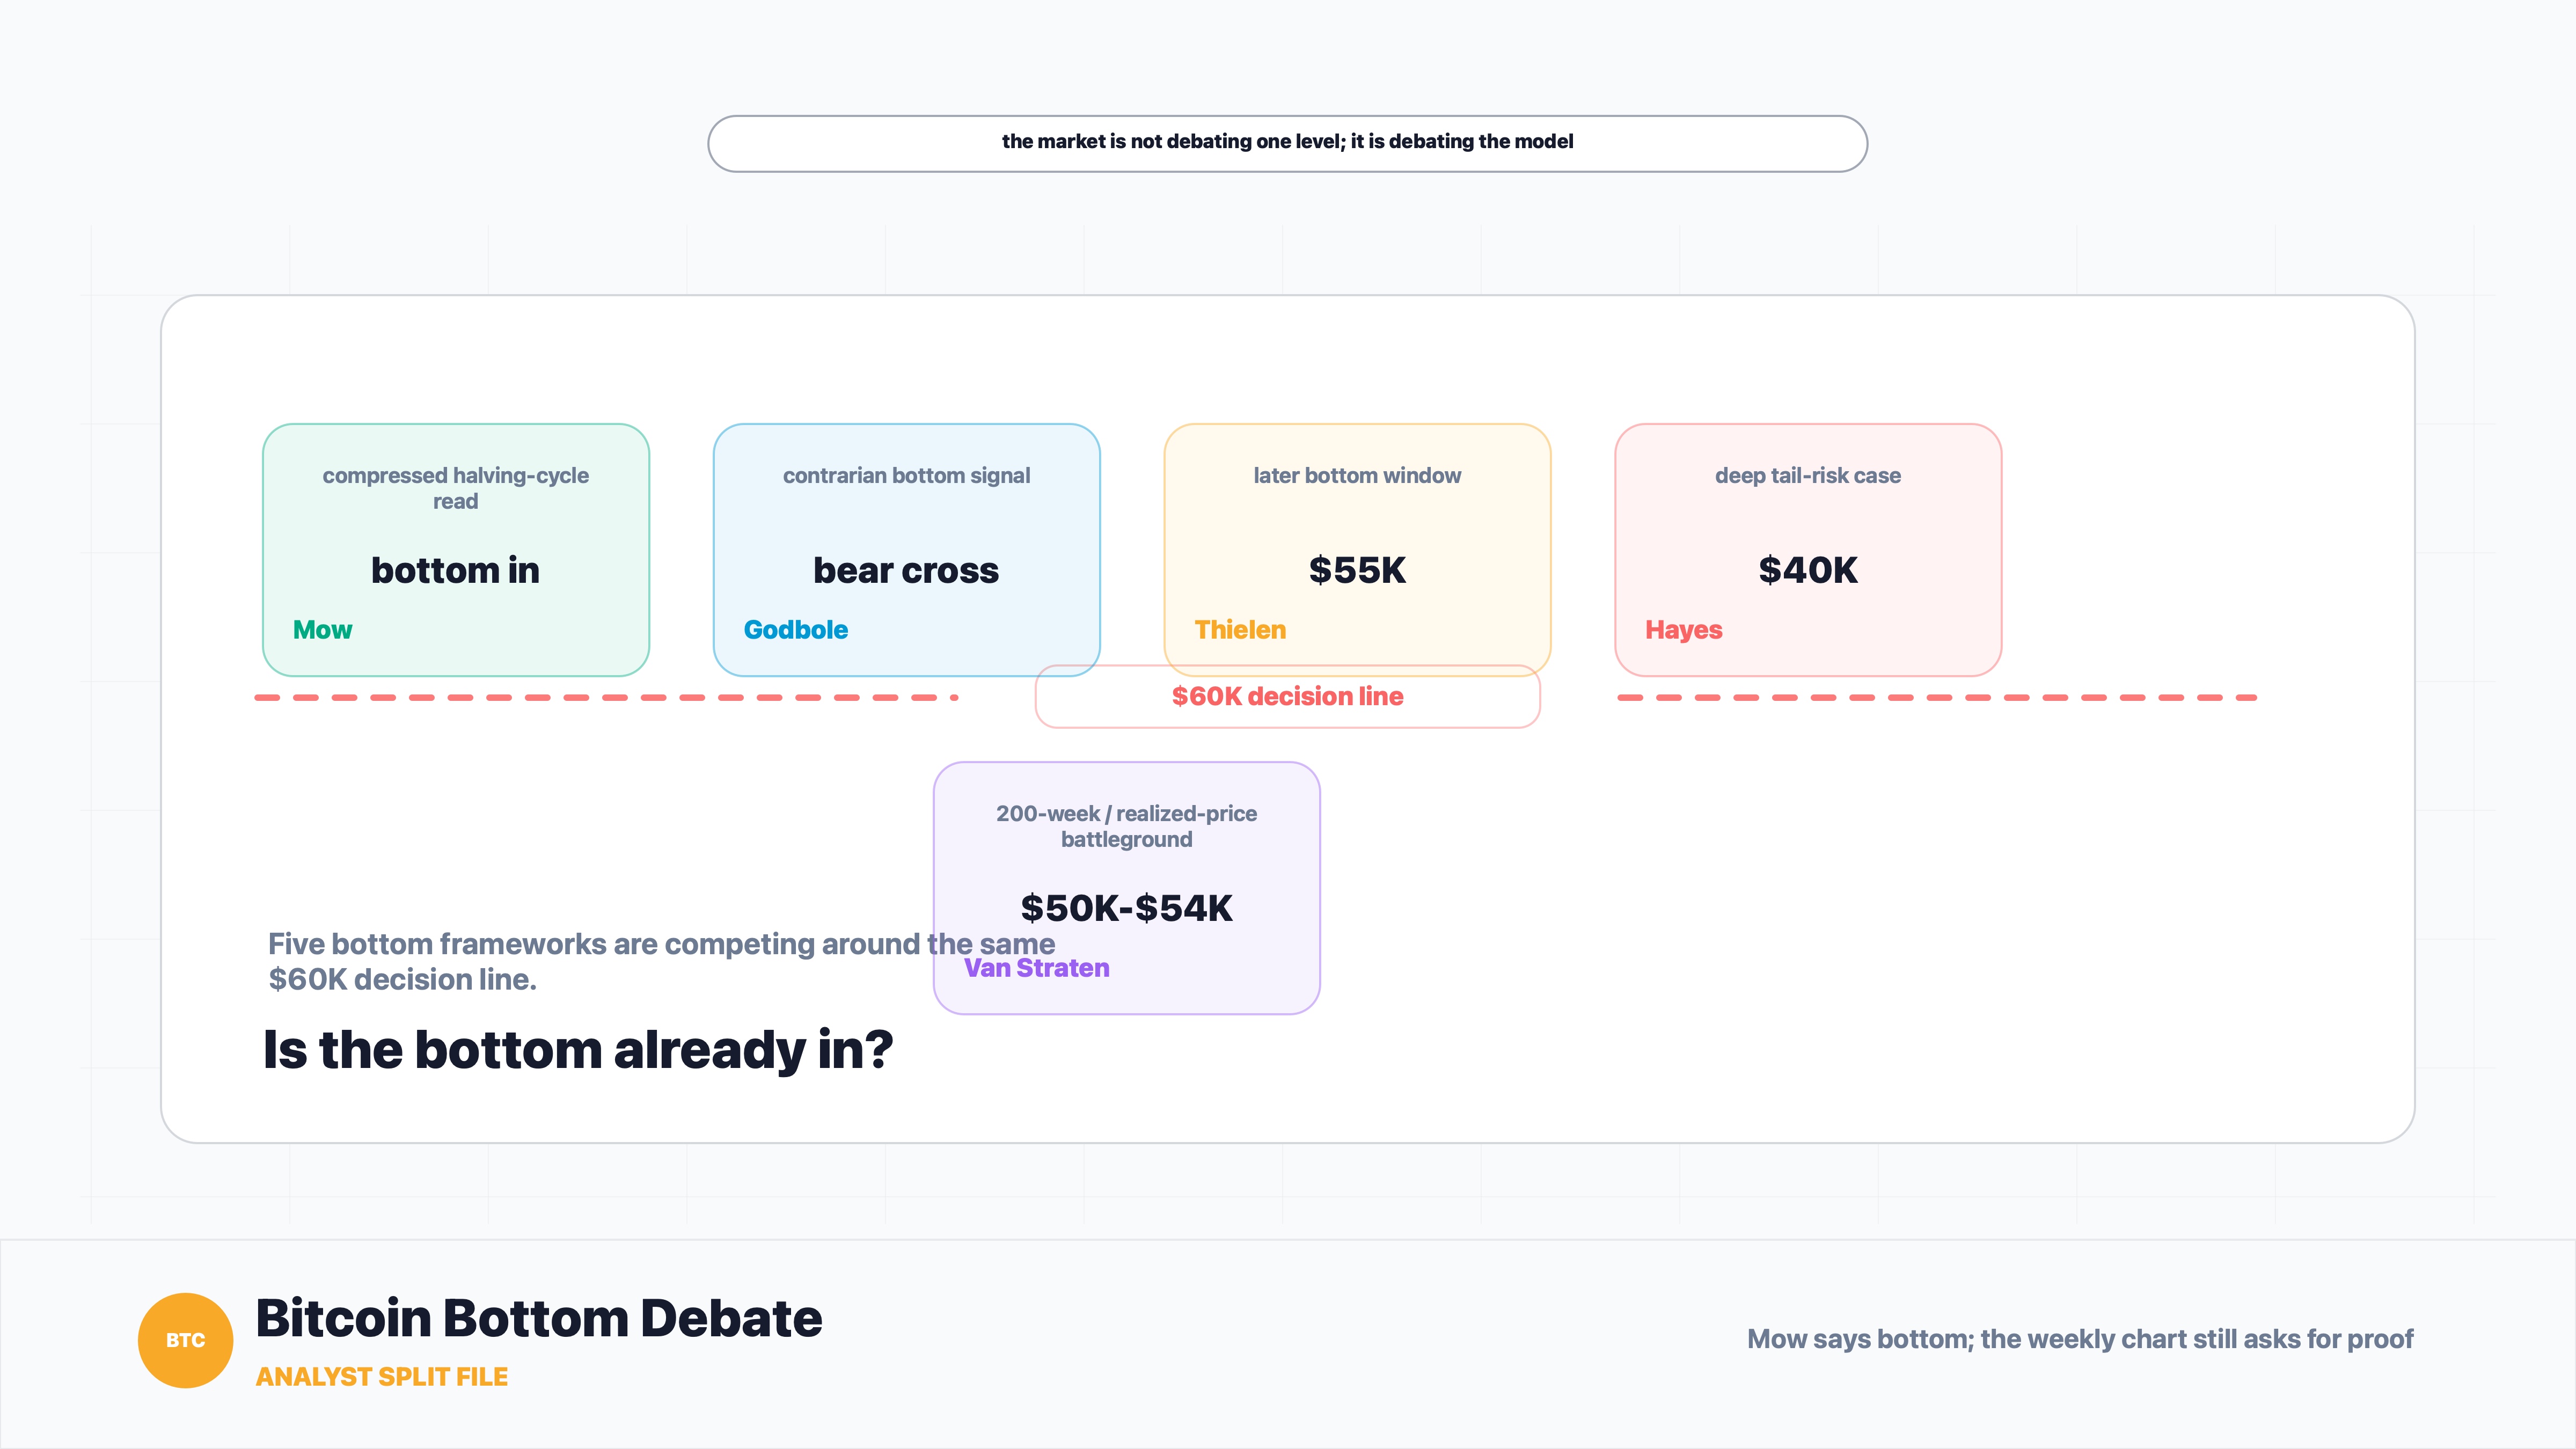
- Other analysts disagree on both price and timing, with downside scenarios centered around $55K, $50K-$54K, and even $40K.
- The real debate is not only bullish versus bearish. It is whether cycle timing or stress-based price indicators should carry more weight.
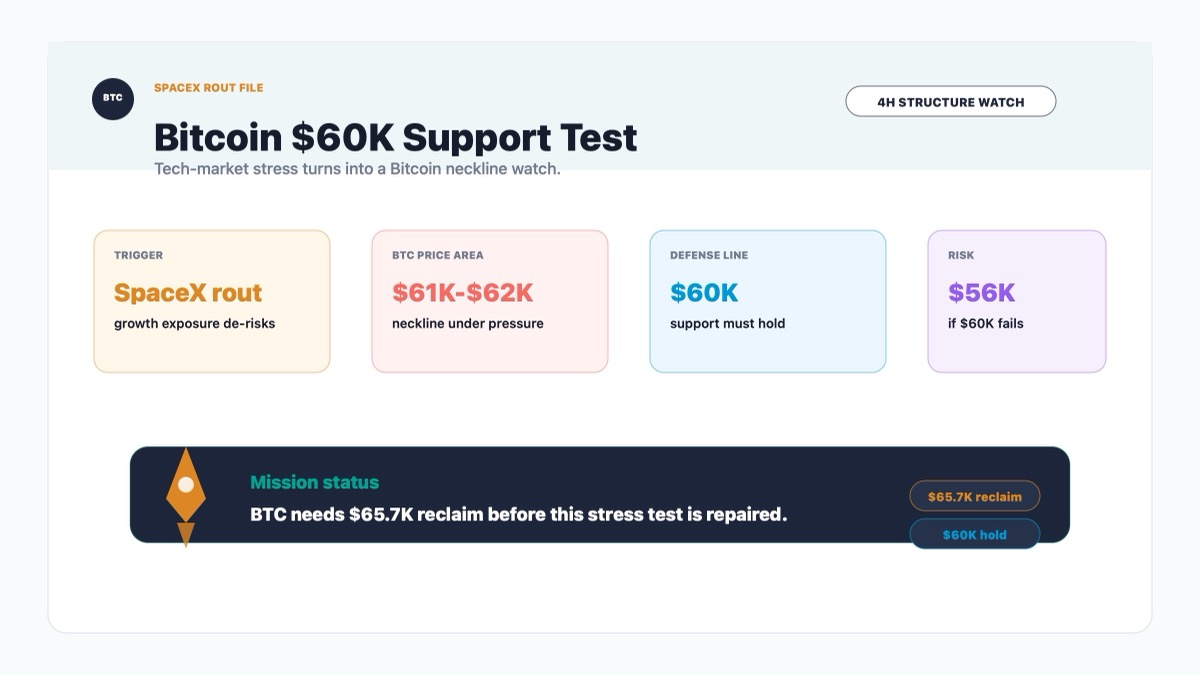
- BTC needs to hold the $60K area and reclaim $70K before Mow's bottom call looks technically persuasive.
What Happened
Samson Mow says the Bitcoin bottom is in.
That sounds like a simple sentence. It is not. In crypto, "the bottom is in" is less a sentence than a small civil war disguised as a price call. Everyone can agree that bitcoin has fallen. The fight is over what kind of fall it is.
Mow made the claim in an X post on Sunday, according to CoinDesk. His argument is built around the 2024 halving cycle. Bitcoin reached a then-all-time high 37 days before the April 2024 halving, which, in Mow's view, means the traditional four-year cycle has accelerated. If the cycle moved faster on the way up, he argues, traders should not assume the bottom still has to arrive on the old schedule.
That is the clean version: the clock changed, so the old calendar may be misleading.
But the article also makes clear that analysts are not all using the same clock. CoinDesk market analyst Omkar Godbole pointed to a contrarian signal based on bitcoin's 50-week and 100-week simple moving averages. The 50-week average is close to dropping below the 100-week average, forming what technicians call a bear cross. Weirdly, that can be constructive: historically, similar signals have appeared around market bottoms.
Then the bearish camp enters the room with a clipboard and ruins the simplicity.
Markus Thielen of 10x Research sees a bottom closer to $55,000 and possibly not until August to October. Arthur Hayes has floated a much deeper $40,000 bottom within six months. CoinDesk senior analyst James Van Straten has argued that bitcoin may still need to drop 15% or more, with $50,000-$54,000 becoming the next key battleground as BTC tests the 200-week moving average and remains above realized price.
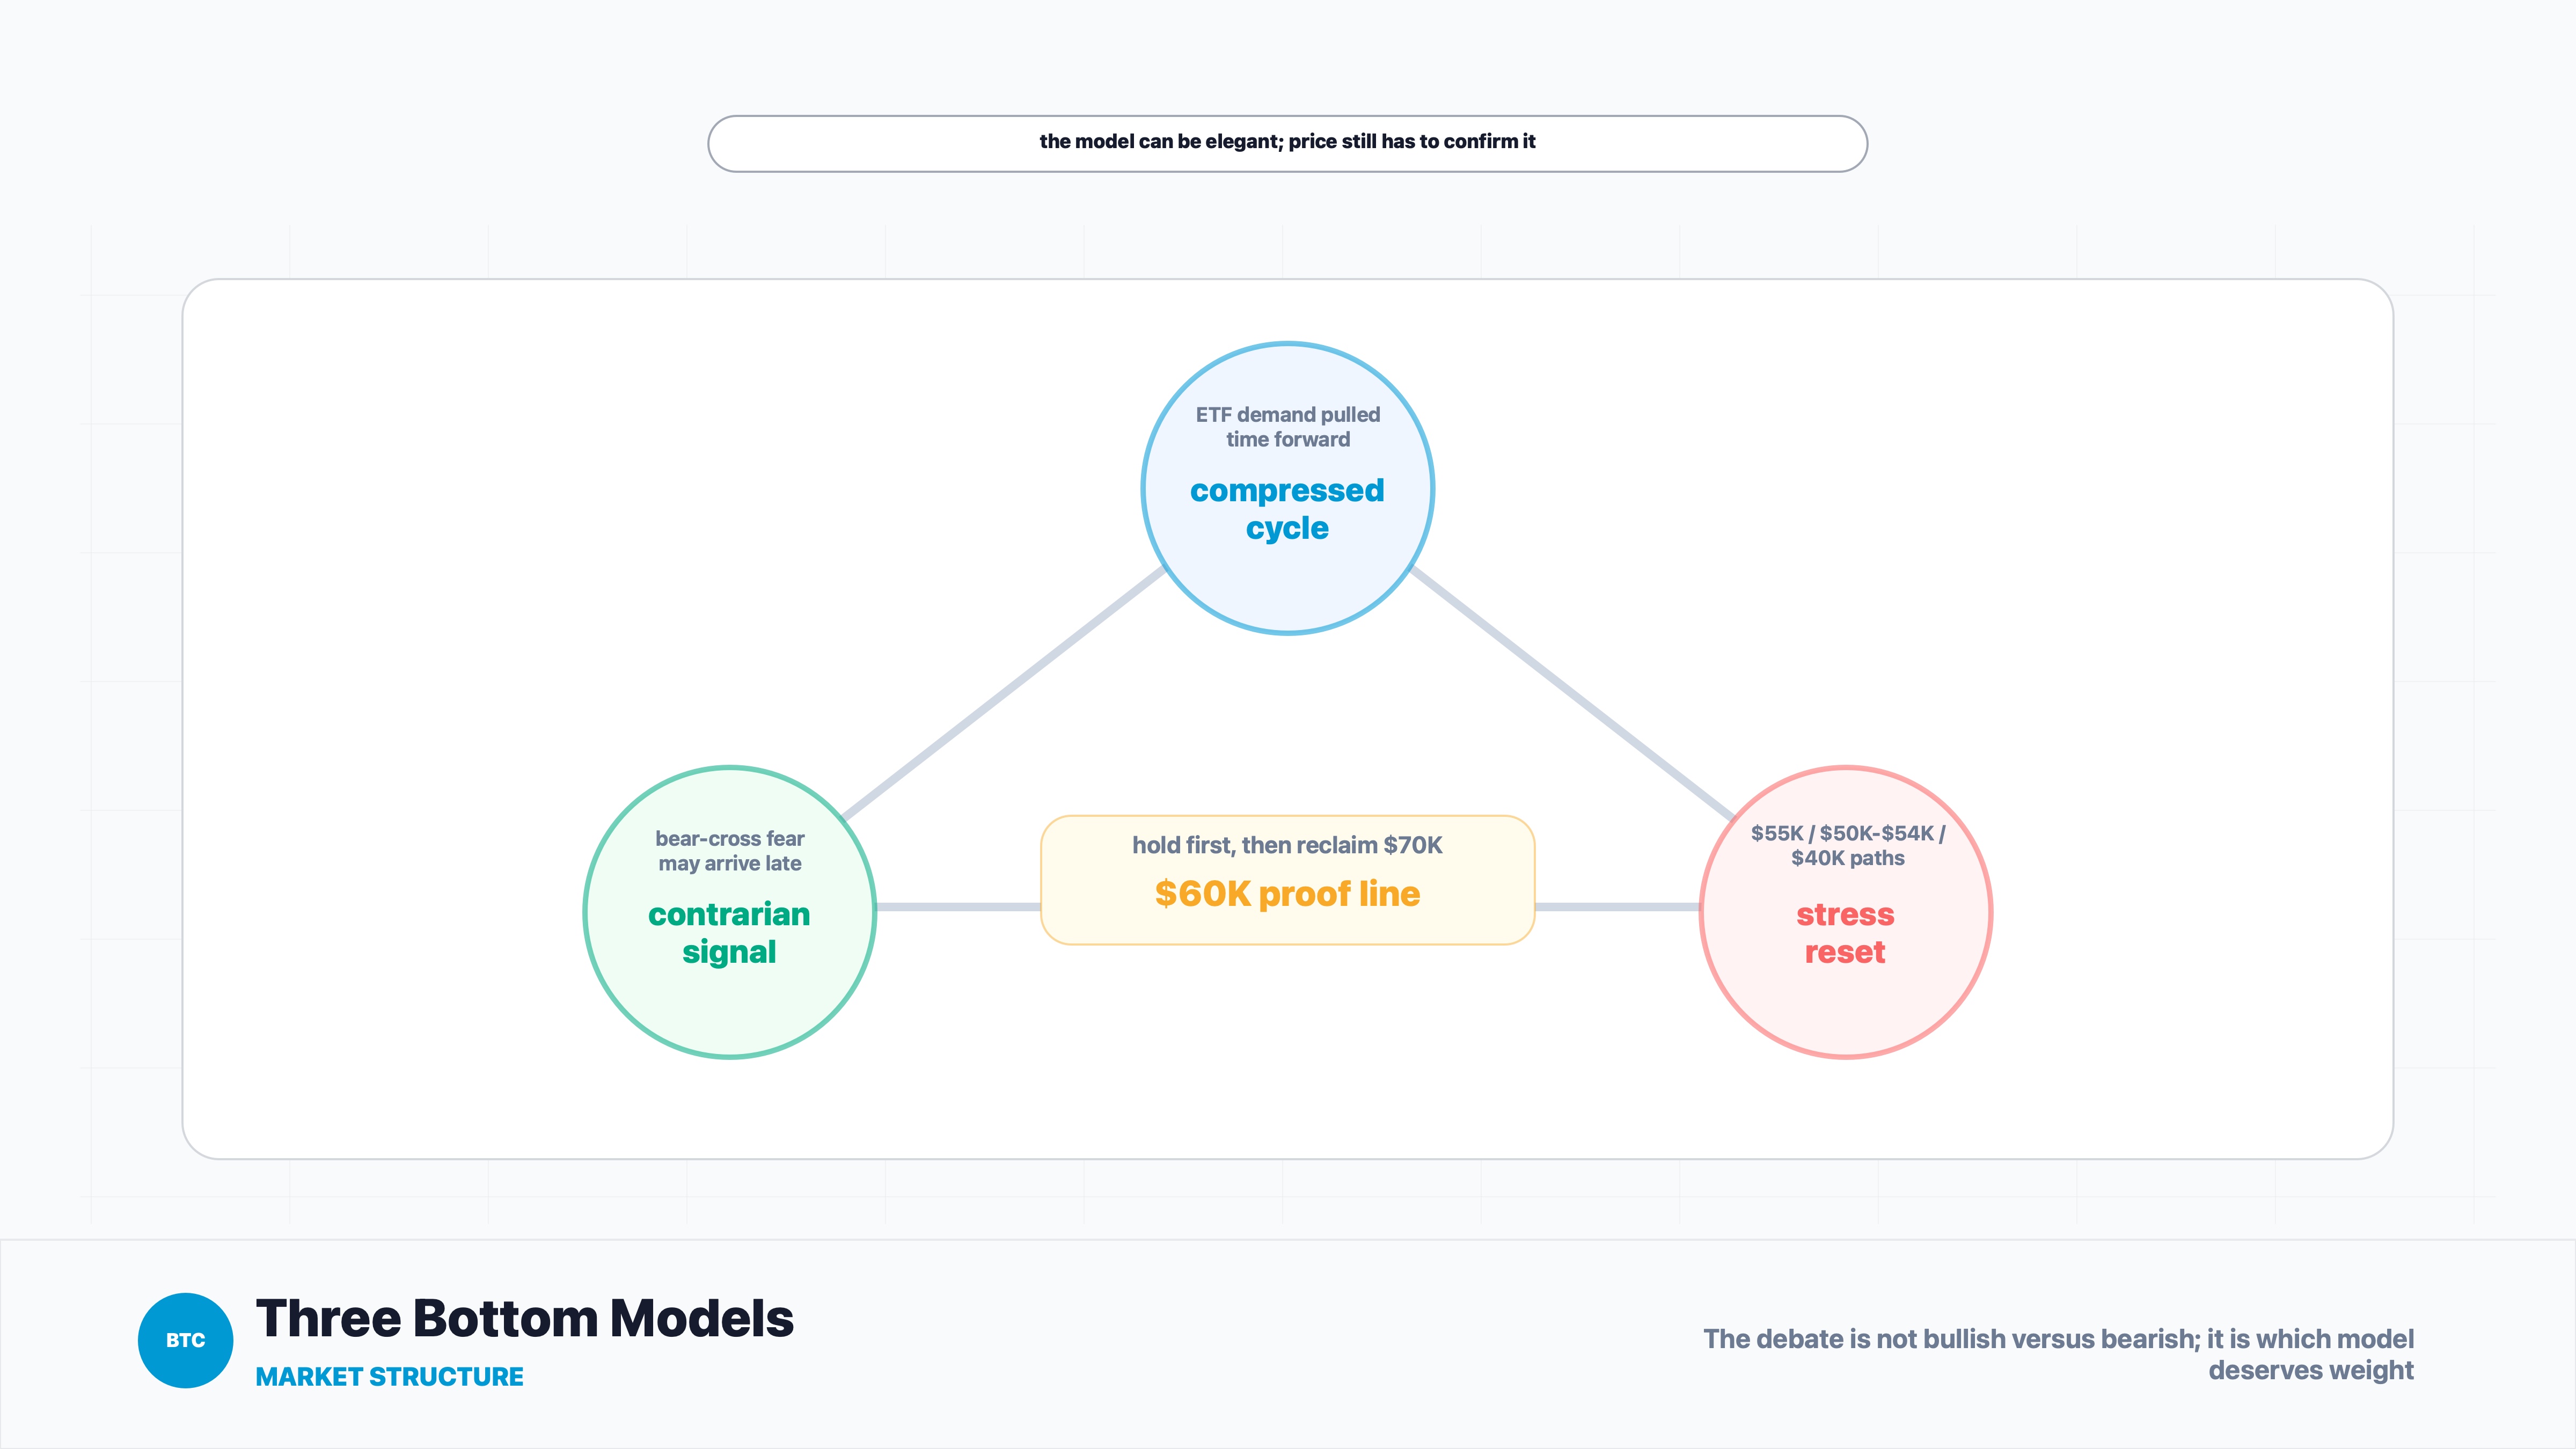
So the news is not "Mow is bullish." The news is that the market has three bottom models competing at the same time: a compressed-cycle model, a moving-average contrarian model, and a deeper-stress model.
Why This Matters for Bitcoin and Crypto Markets
The first mistake is to treat this as a personality contest.
Mow says bottom. Hayes says lower. Thielen says maybe later. Van Straten says watch the 200-week average and realized price. You can turn that into a scoreboard if you want, but it is not the useful version of the story. The useful version is that each analyst is asking bitcoin a different question.
Mow is asking a timing question: if the ETF era pulled demand forward and made bitcoin hit a new high before the halving, did the whole cycle compress?
The moving-average argument asks a market-structure question: if long-term averages are about to flash the same kind of bearish crossover that appeared near prior bottoms, is the obvious bearish signal actually late?
The deeper downside argument asks a stress question: has bitcoin really gone through enough pain to reset positioning, valuation and holder behavior?
Those are not the same question. Mixing them together is how a market debate turns into fog.
This matters because bitcoin is no longer trading in the clean old textbook version of a halving cycle. In the old model, the halving reduces new supply, the market spends time absorbing it, and the cycle slowly moves through accumulation, expansion, distribution and drawdown. Nice. Neat. Almost suspiciously neat.
The ETF era complicated that model. Spot bitcoin ETFs gave institutions a regulated wrapper, pulled demand forward, and helped create a pre-halving all-time high. If you are Mow, that is evidence that the cycle has accelerated. If you are more skeptical, it is also evidence that some future demand may have already arrived early, done its buying, and left the market with less fresh fuel when sentiment turned.
That is the uncomfortable part. A faster cycle can mean a faster recovery. It can also mean a faster exhaustion.
For crypto markets, the answer matters beyond BTC. If bitcoin is forming a durable bottom near $60K, altcoins may get breathing room and risk appetite can slowly return. If BTC still needs to test $55K, $50K-$54K or lower, then the rest of crypto is probably not in a healthy new expansion phase. It is just waiting to see where the floor is.
Historical Parallel
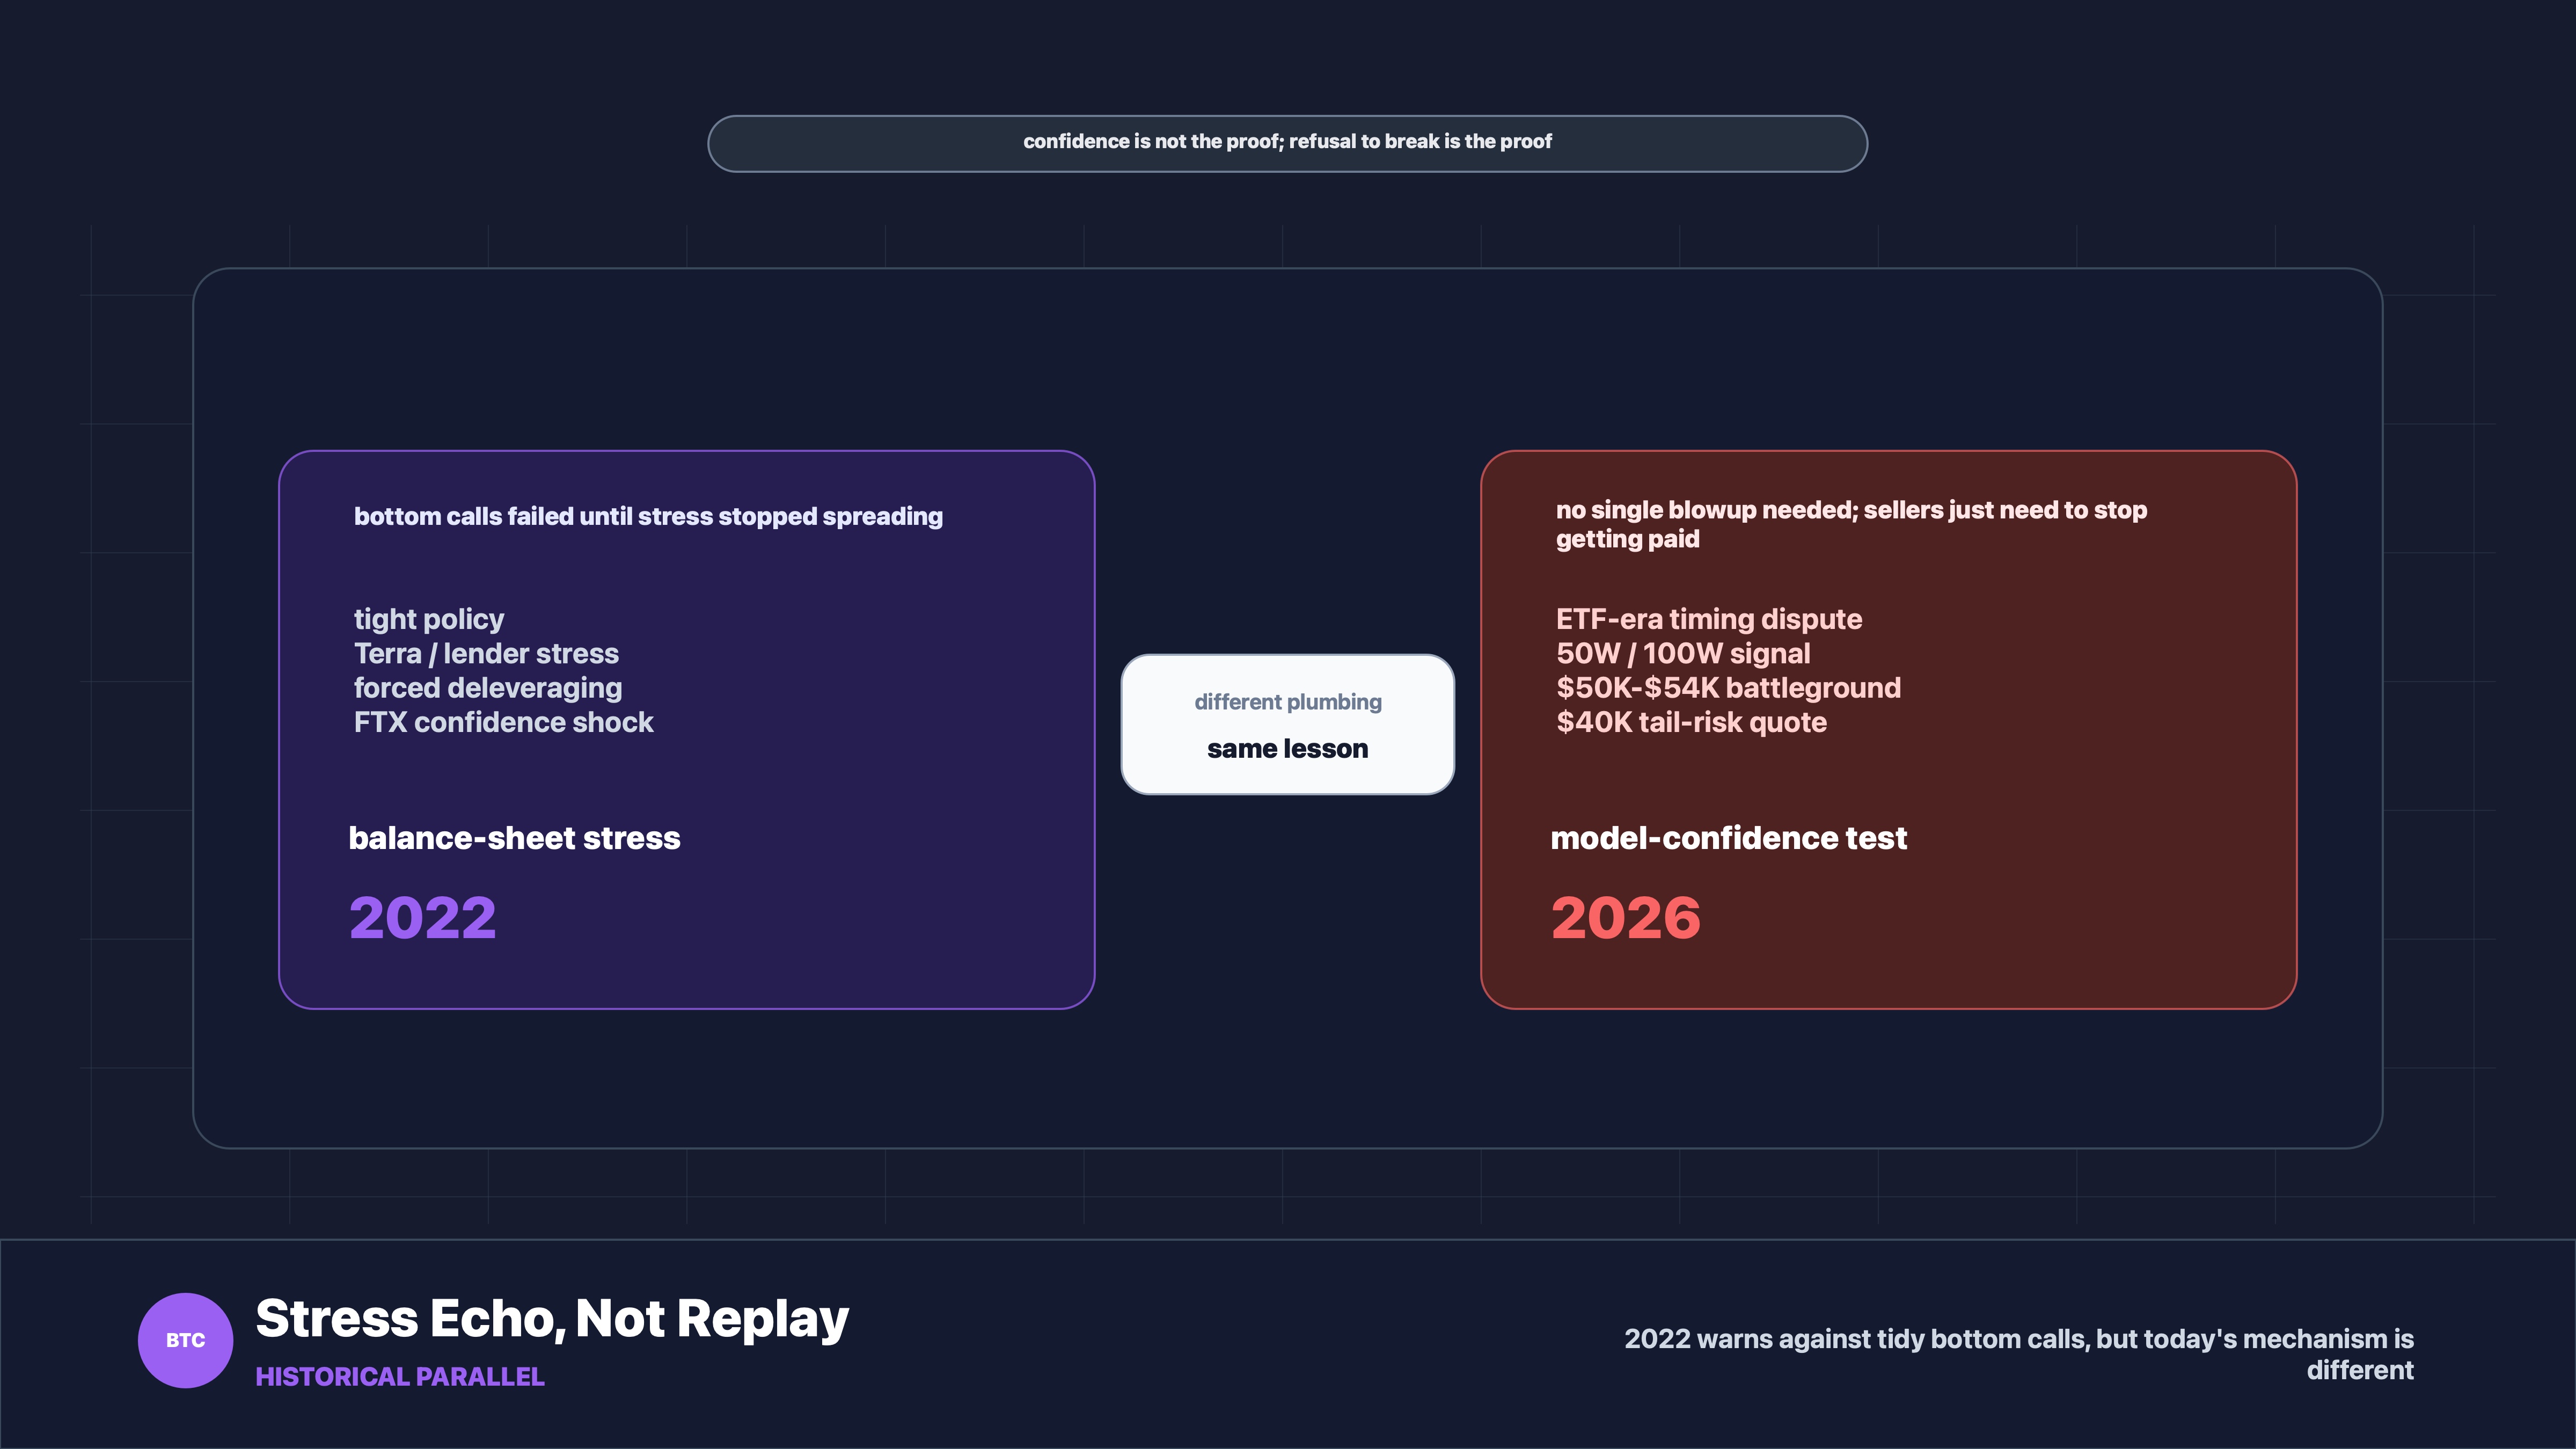
The most useful historical parallel is 2022, because that was also a year when "bottom" arguments kept arriving before the market had finished stress-testing itself. Early in that bear market, traders could make reasonable bullish arguments: bitcoin had already fallen a lot, sentiment was ugly, and long-term holders were being tested. Then the market discovered that "a lot" is not a technical term.
In 2022, the problem was not only price. It was a stack of mechanisms working together: tighter monetary policy, weaker liquidity, Terra/Luna, forced deleveraging, lender stress and eventually FTX. Each event made the previous bottom call look a little too tidy. The market did not need one more bad chart pattern. It needed to find out which balance sheets, lenders and narratives could survive when leverage stopped being friendly.
The similarity to the current debate is the role of stress indicators. Van Straten's focus on the 200-week moving average, the $50K-$54K range and realized price is basically an attempt to ask whether bitcoin has gone through enough structural pain. Mow's point is different: maybe the cycle changed, so waiting for the old pain sequence could be a mistake. Both arguments can be intelligent. They just live in different rooms.
The difference is also important. The current setup, based on the CoinDesk report, is not a 2022-style credit collapse. It is a dispute about cycle timing, ETF-era demand, weekly moving averages and whether bitcoin has already absorbed enough selling. That is less dramatic, but less clean. There may be no single blowup that marks the bottom. There may only be a price zone where sellers stop getting paid for pressing.
The lesson is simple: a bottom is not proven by how confident the speaker sounds. It is proven by what price refuses to do next.
Bitcoin Price Reaction and K-Line Analysis
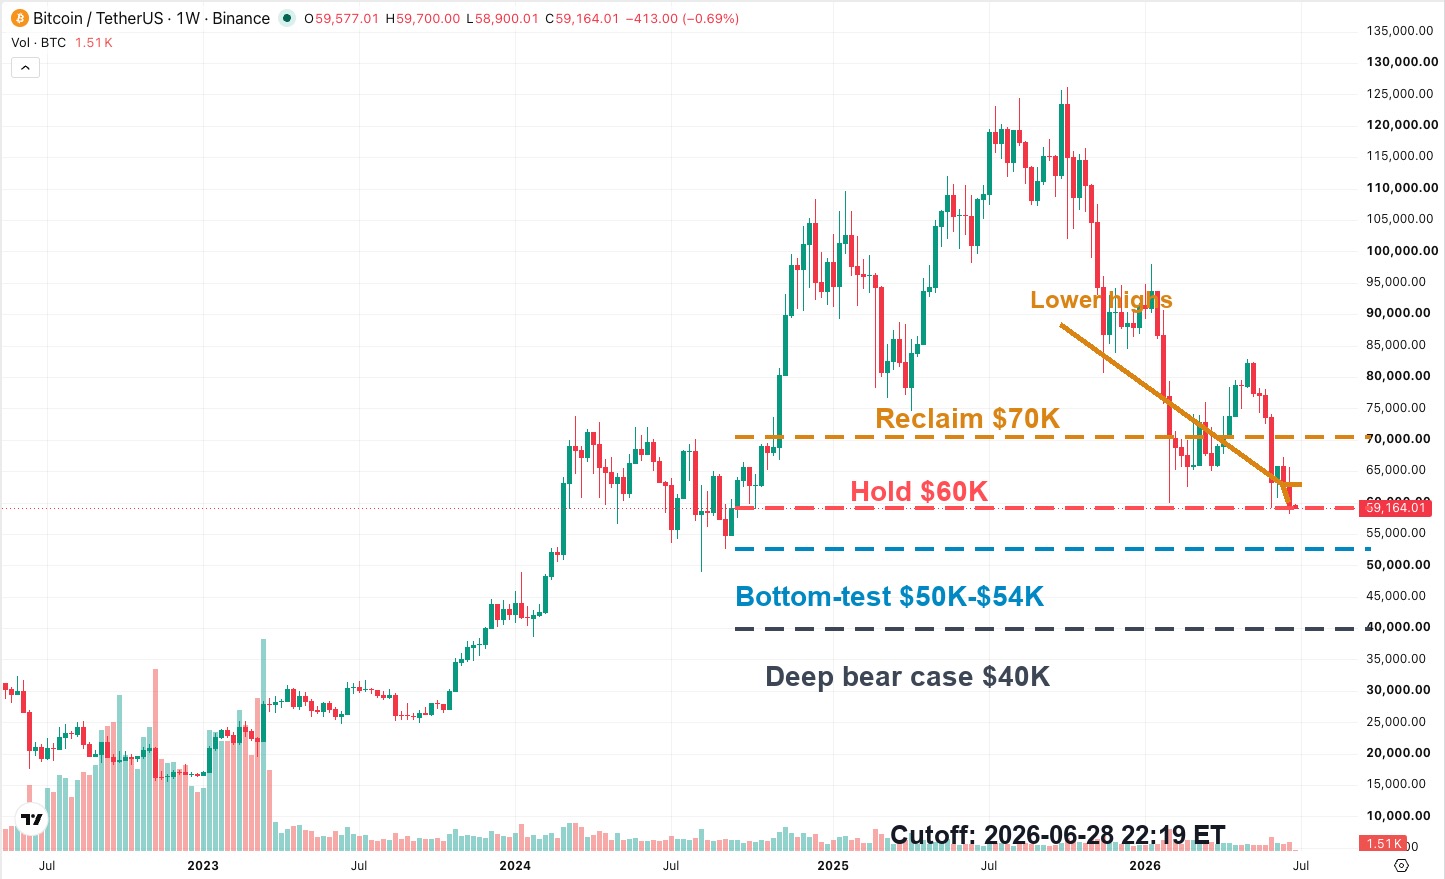
The weekly BTCUSDT chart is the right chart for this story because the article is built around weekly indicators and cycle structure. A four-hour chart would answer a different question. It would show noise wearing a smaller hat.
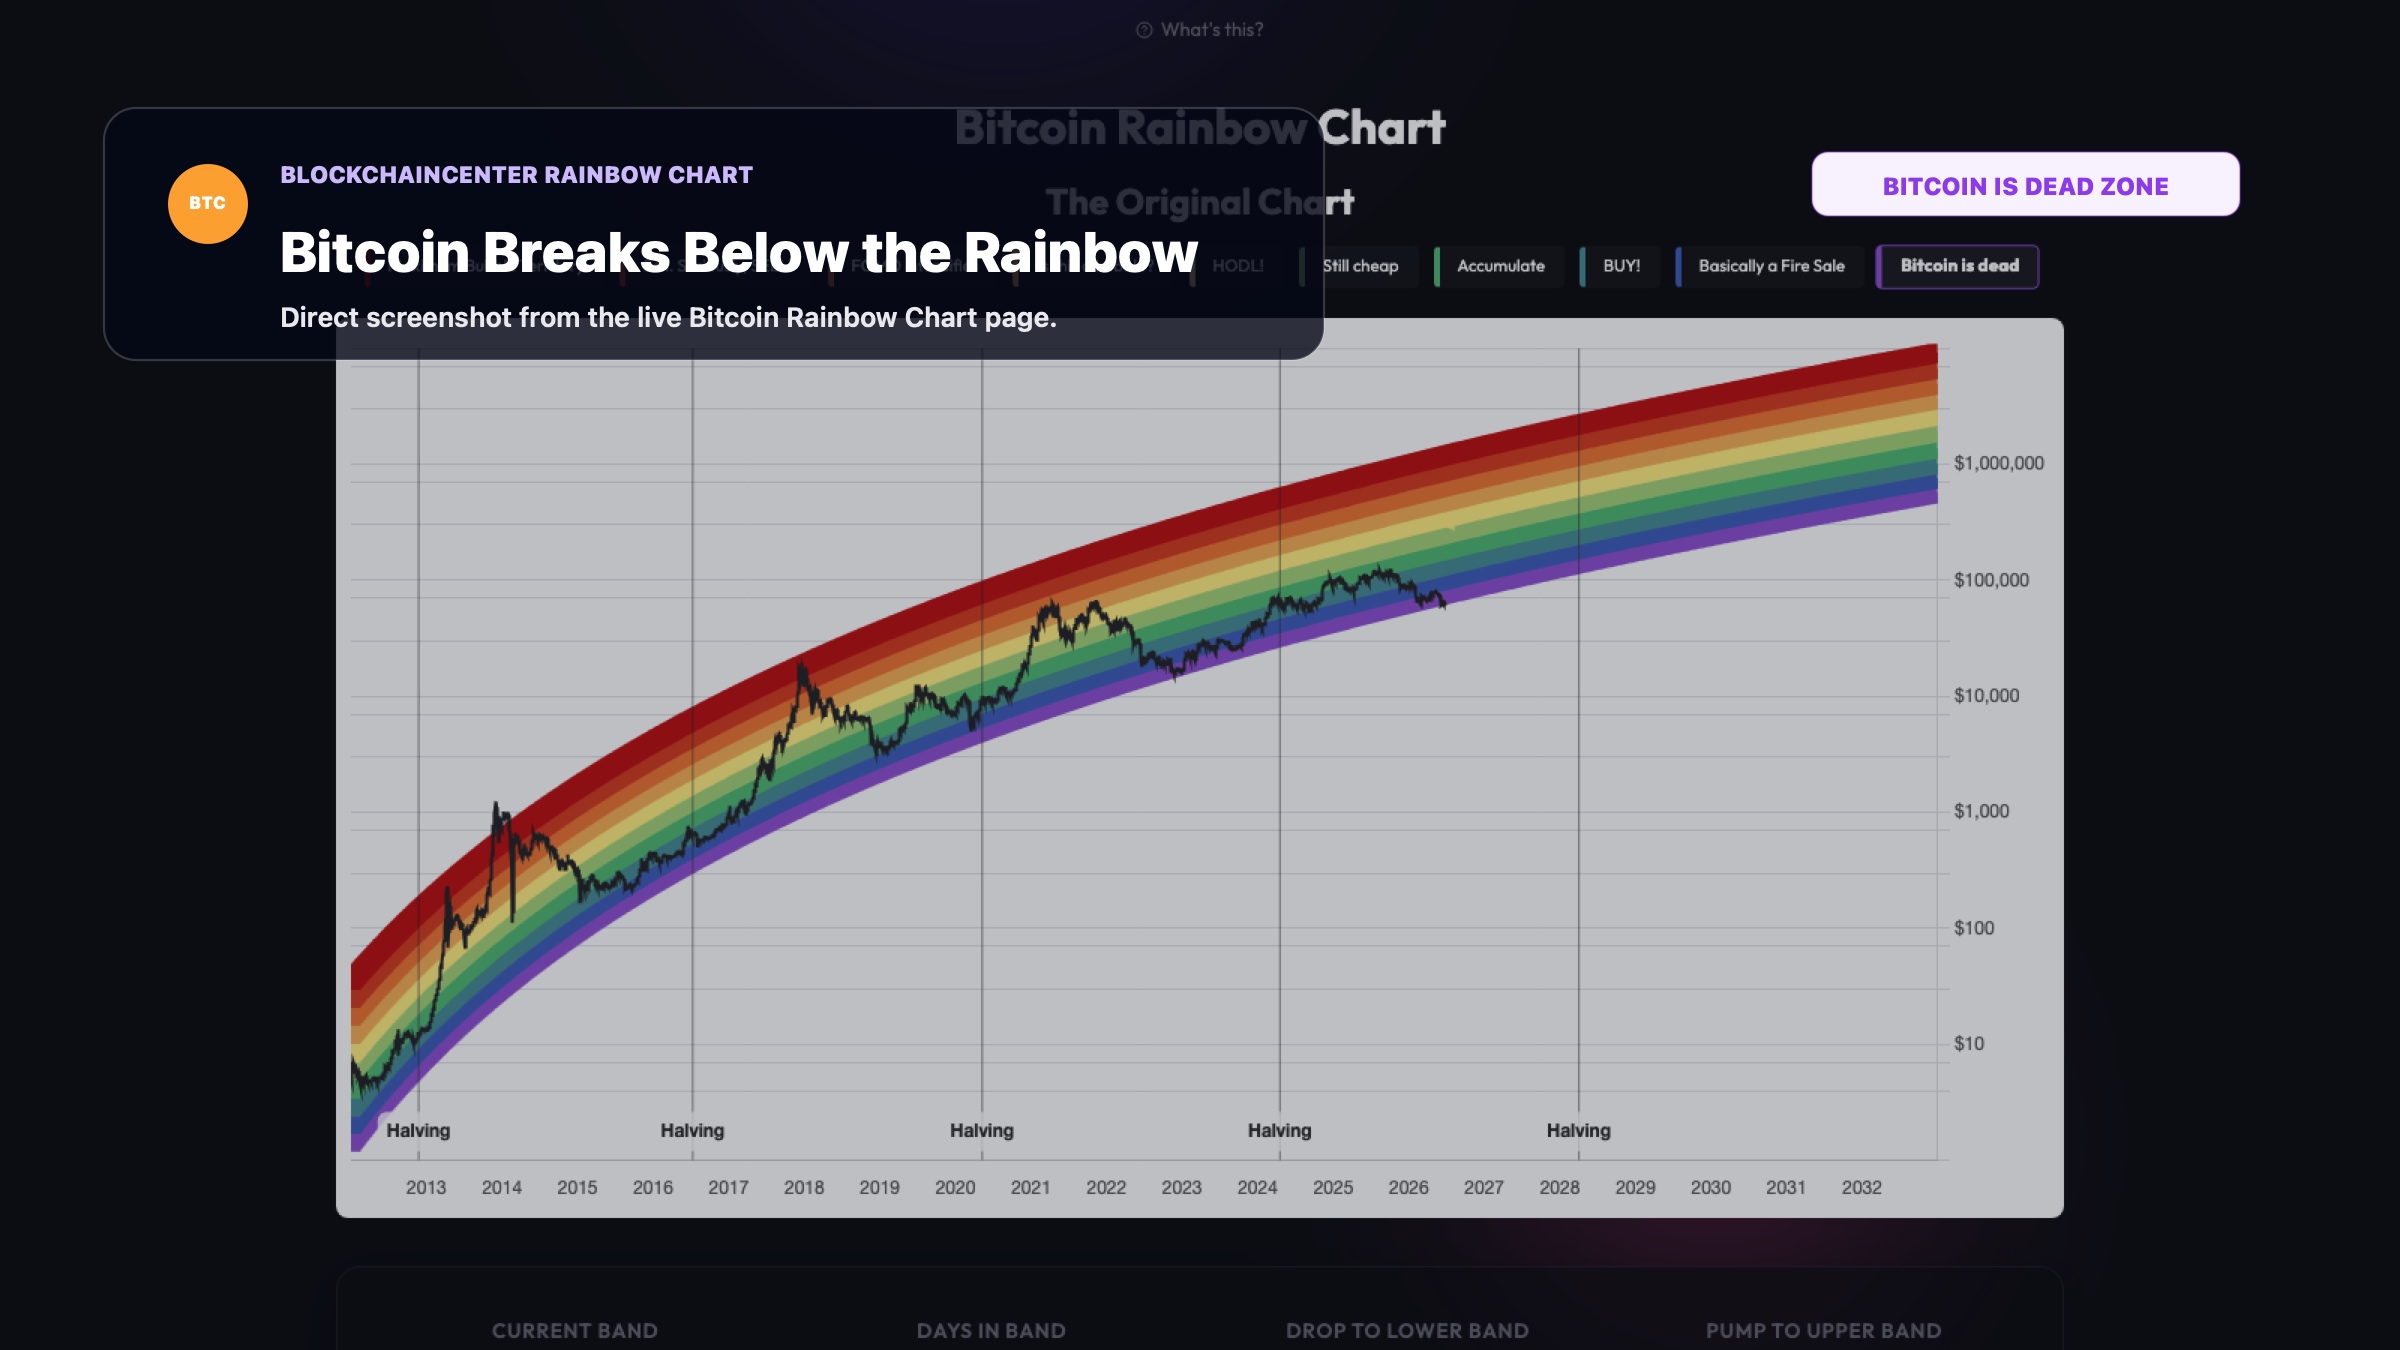
The weekly chart shows why the debate is still alive. BTC has fallen back toward the $60K area after a sequence of lower highs. That is not a clean confirmation of Mow's bottom call yet. It is a test.
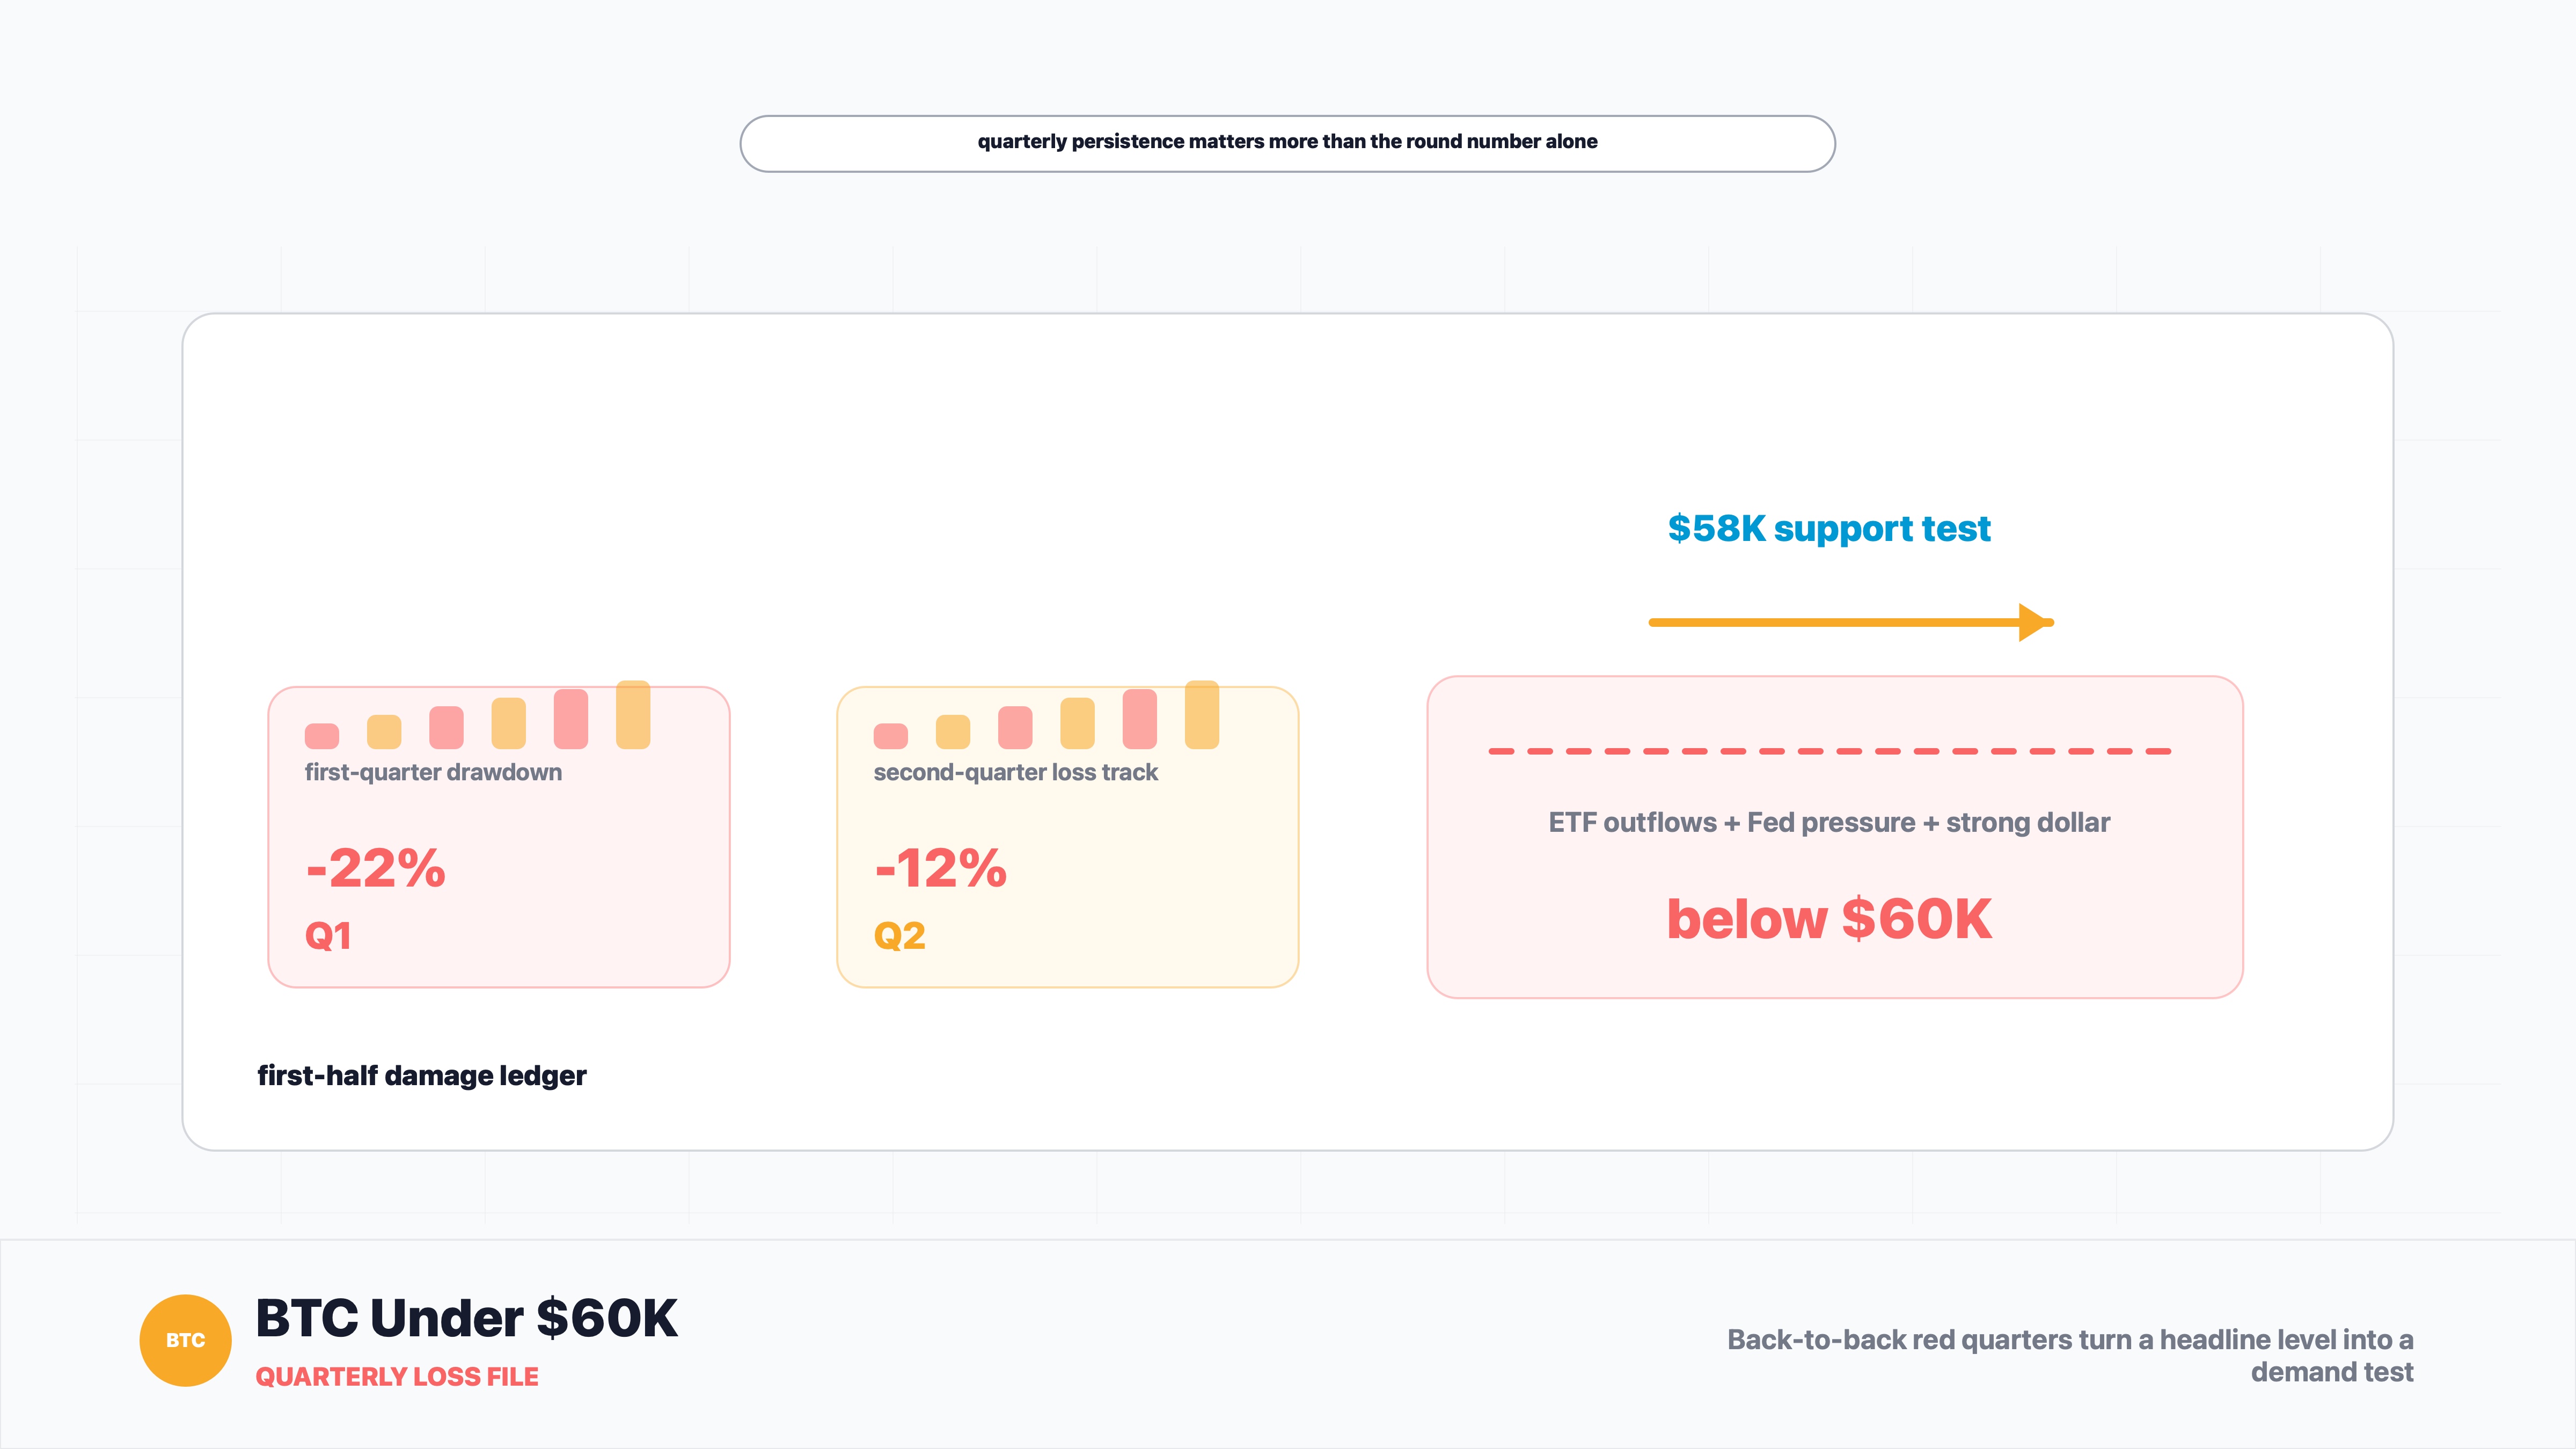
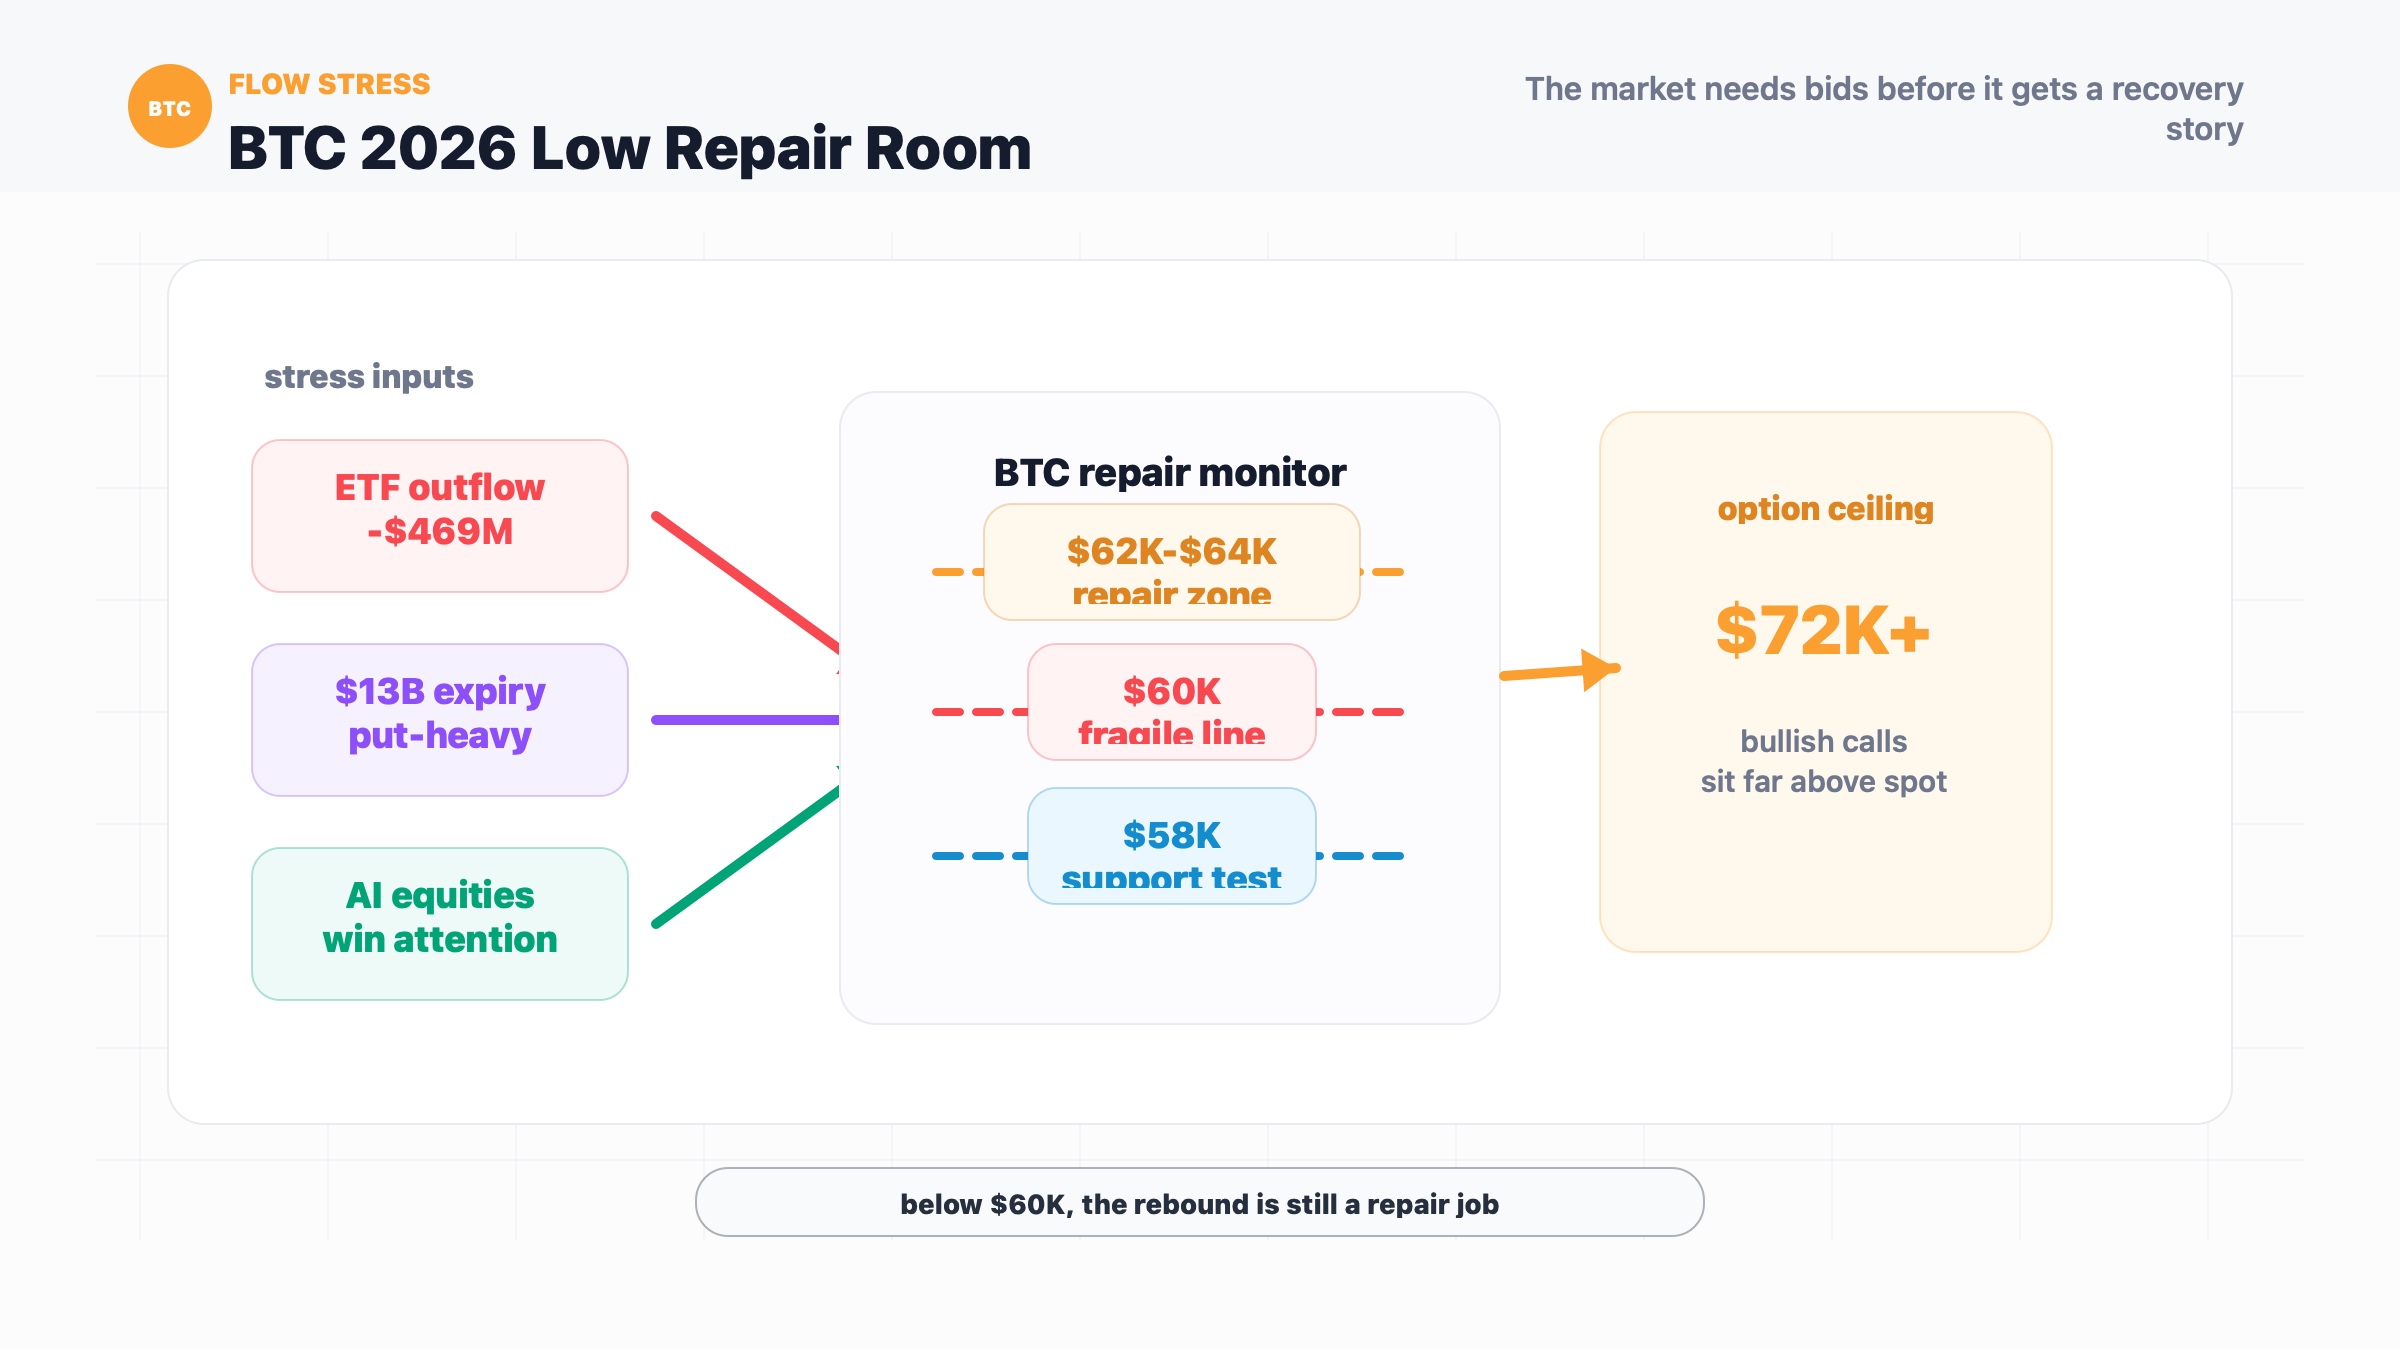
The first line is $60K. If bitcoin holds that area, the market can argue that the recent weakness is a retest rather than a breakdown. If it loses that area decisively, the bearish analyst camp gets a better argument: the market has not finished discovering where real demand sits.
The next repair level is $70K. That does not make bitcoin fully healthy by itself, but it would change the tone. A reclaim of $70K would show that buyers can do more than defend a round number. They can actually push price back into the broken range.
Below the market, $50K-$54K is the important bottom-test zone because it lines up with the article's discussion of the 200-week moving average and Van Straten's battleground range. A move into that area would not automatically prove the bearish case. It would, however, force the market to answer the question Mow's argument tries to skip: has BTC really completed the stress phase?
The $40K level is the deep bear case. It is not the base case in this article, but it matters because Hayes' forecast puts a tail-risk number on the board. Markets do not need to believe a level is likely for that level to shape hedging, fear and positioning.
Key Levels to Watch
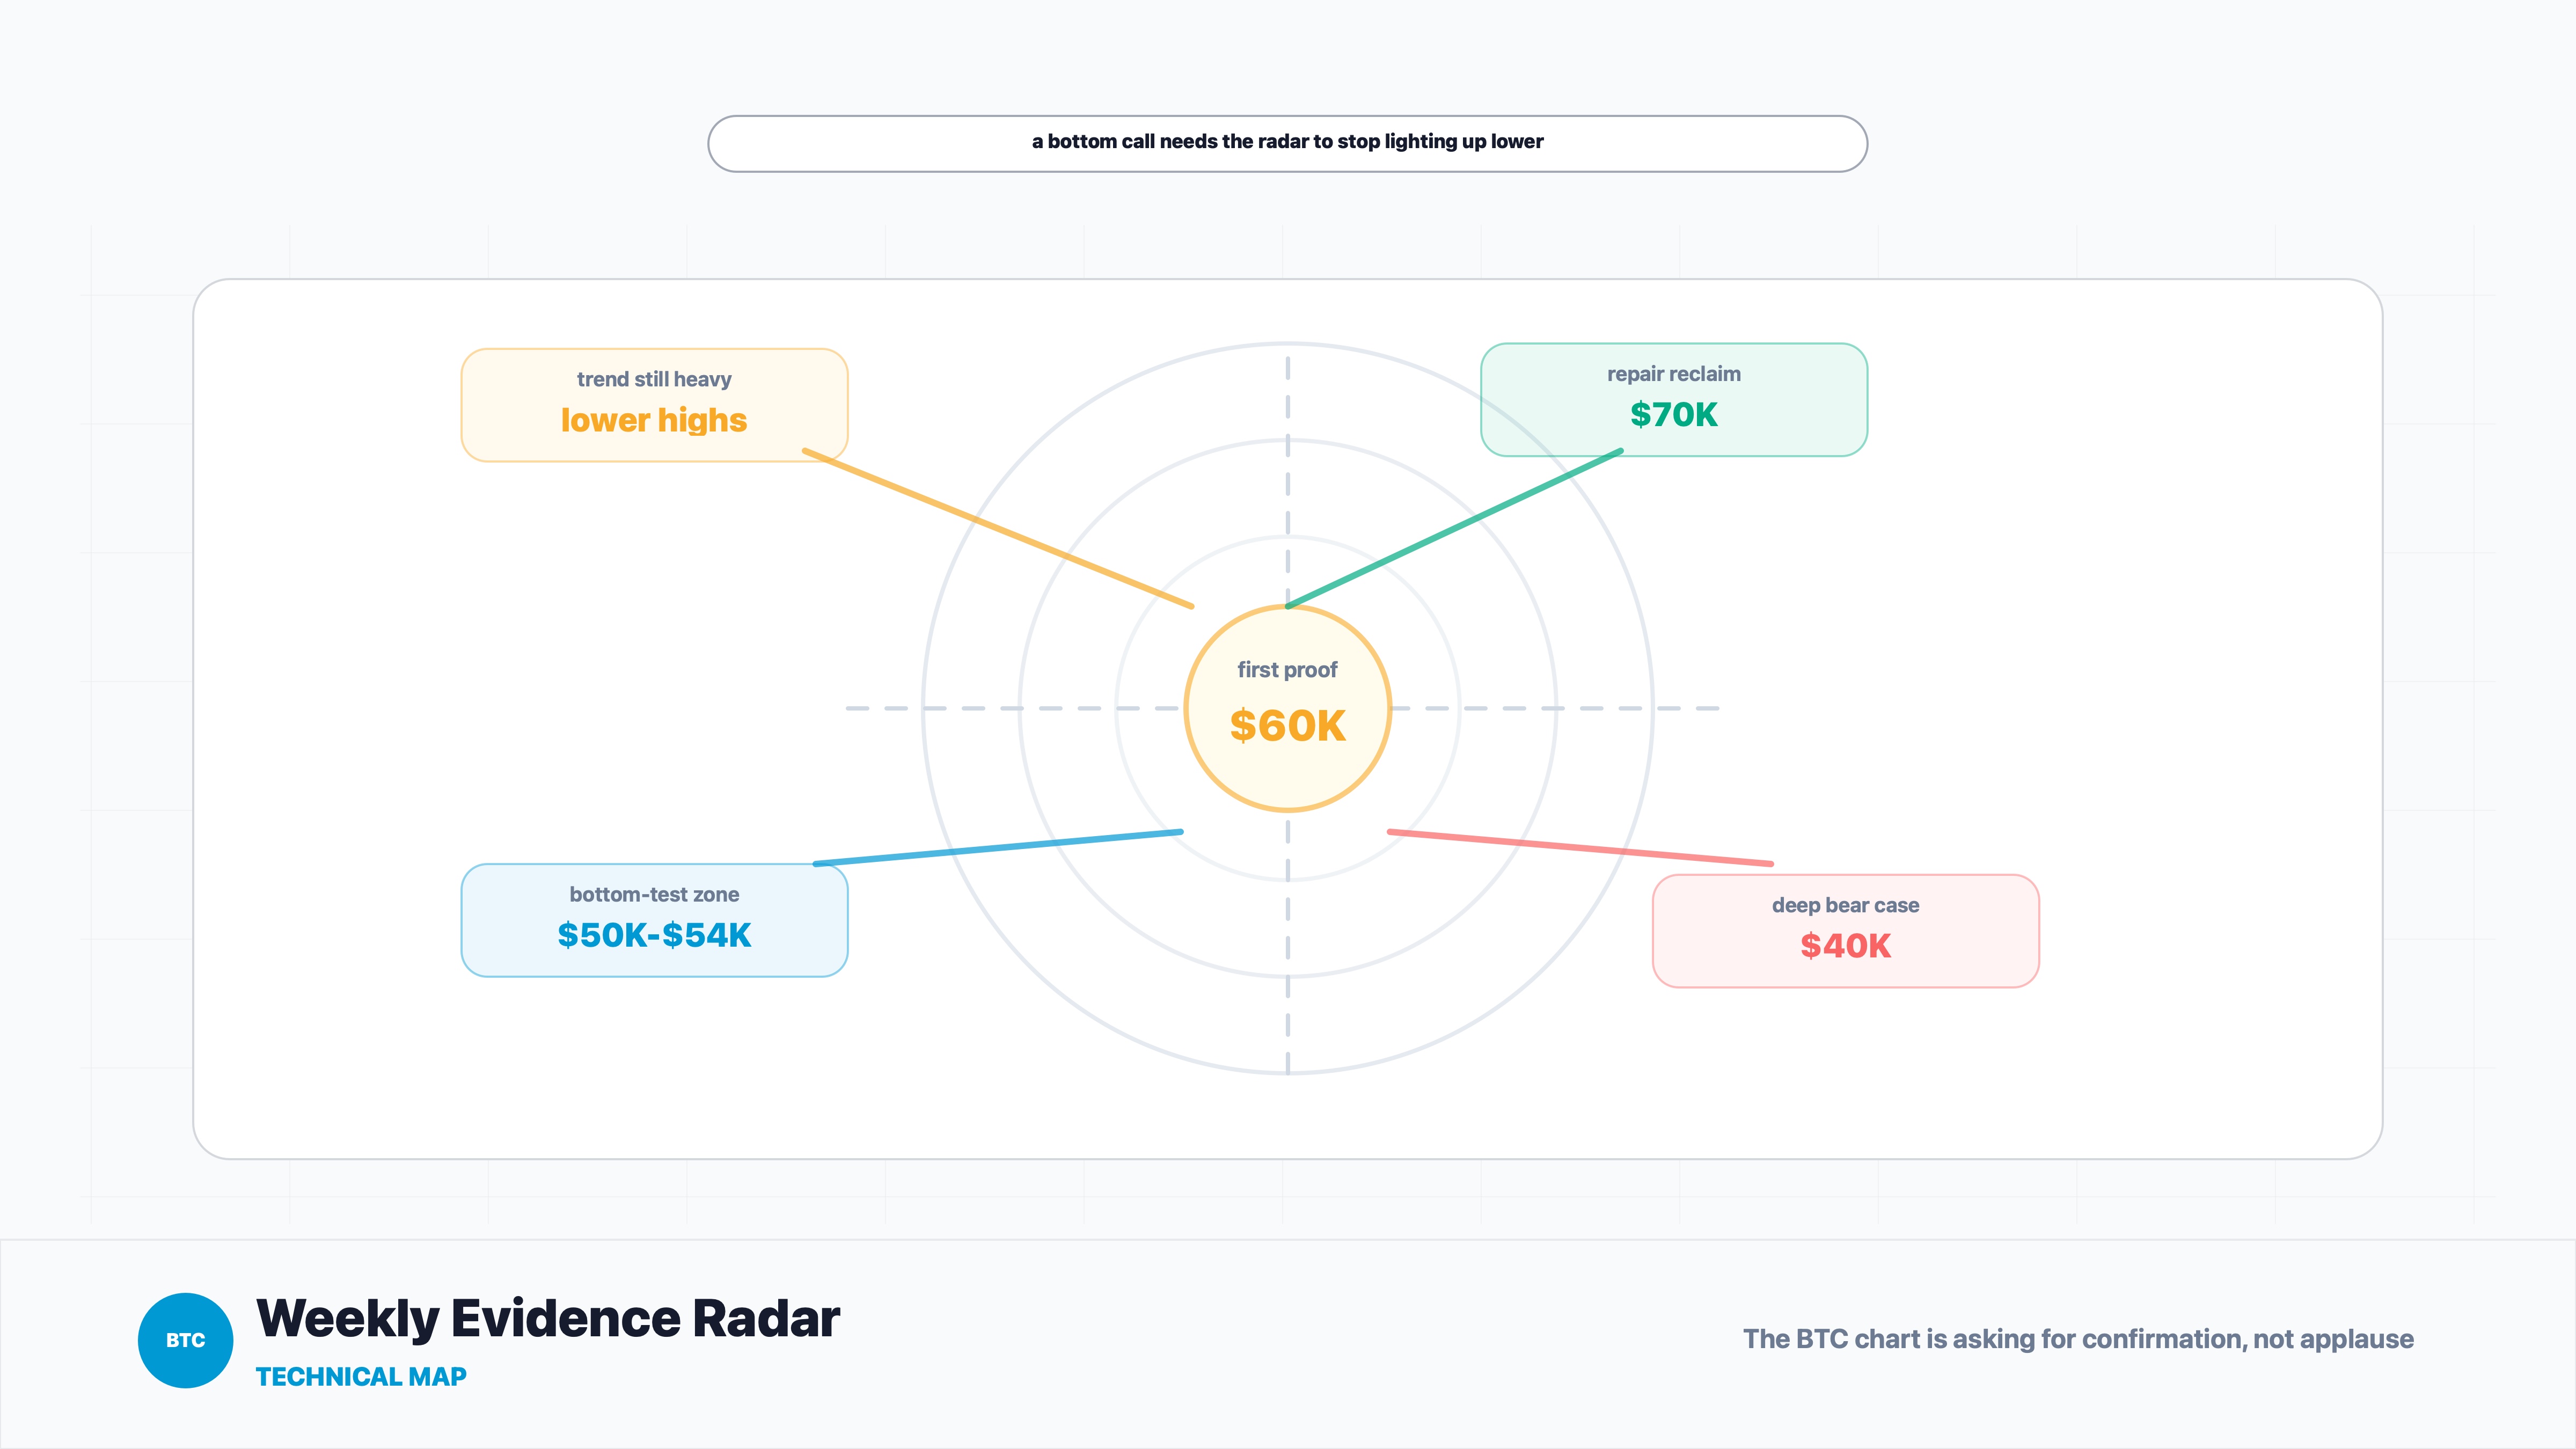
- $70K: The first repair level. A weekly reclaim would make the bottom argument more credible.
- $60K: The immediate decision line. Holding it keeps Mow's call alive; losing it shifts attention lower.
- $50K-$54K: The bottom-test zone tied to the 200-week moving-average discussion and realized-price concerns.
- $40K: The deep bear-case level. It becomes relevant only if $50K-$54K fails and macro/liquidity pressure expands.
Conditional Forecast
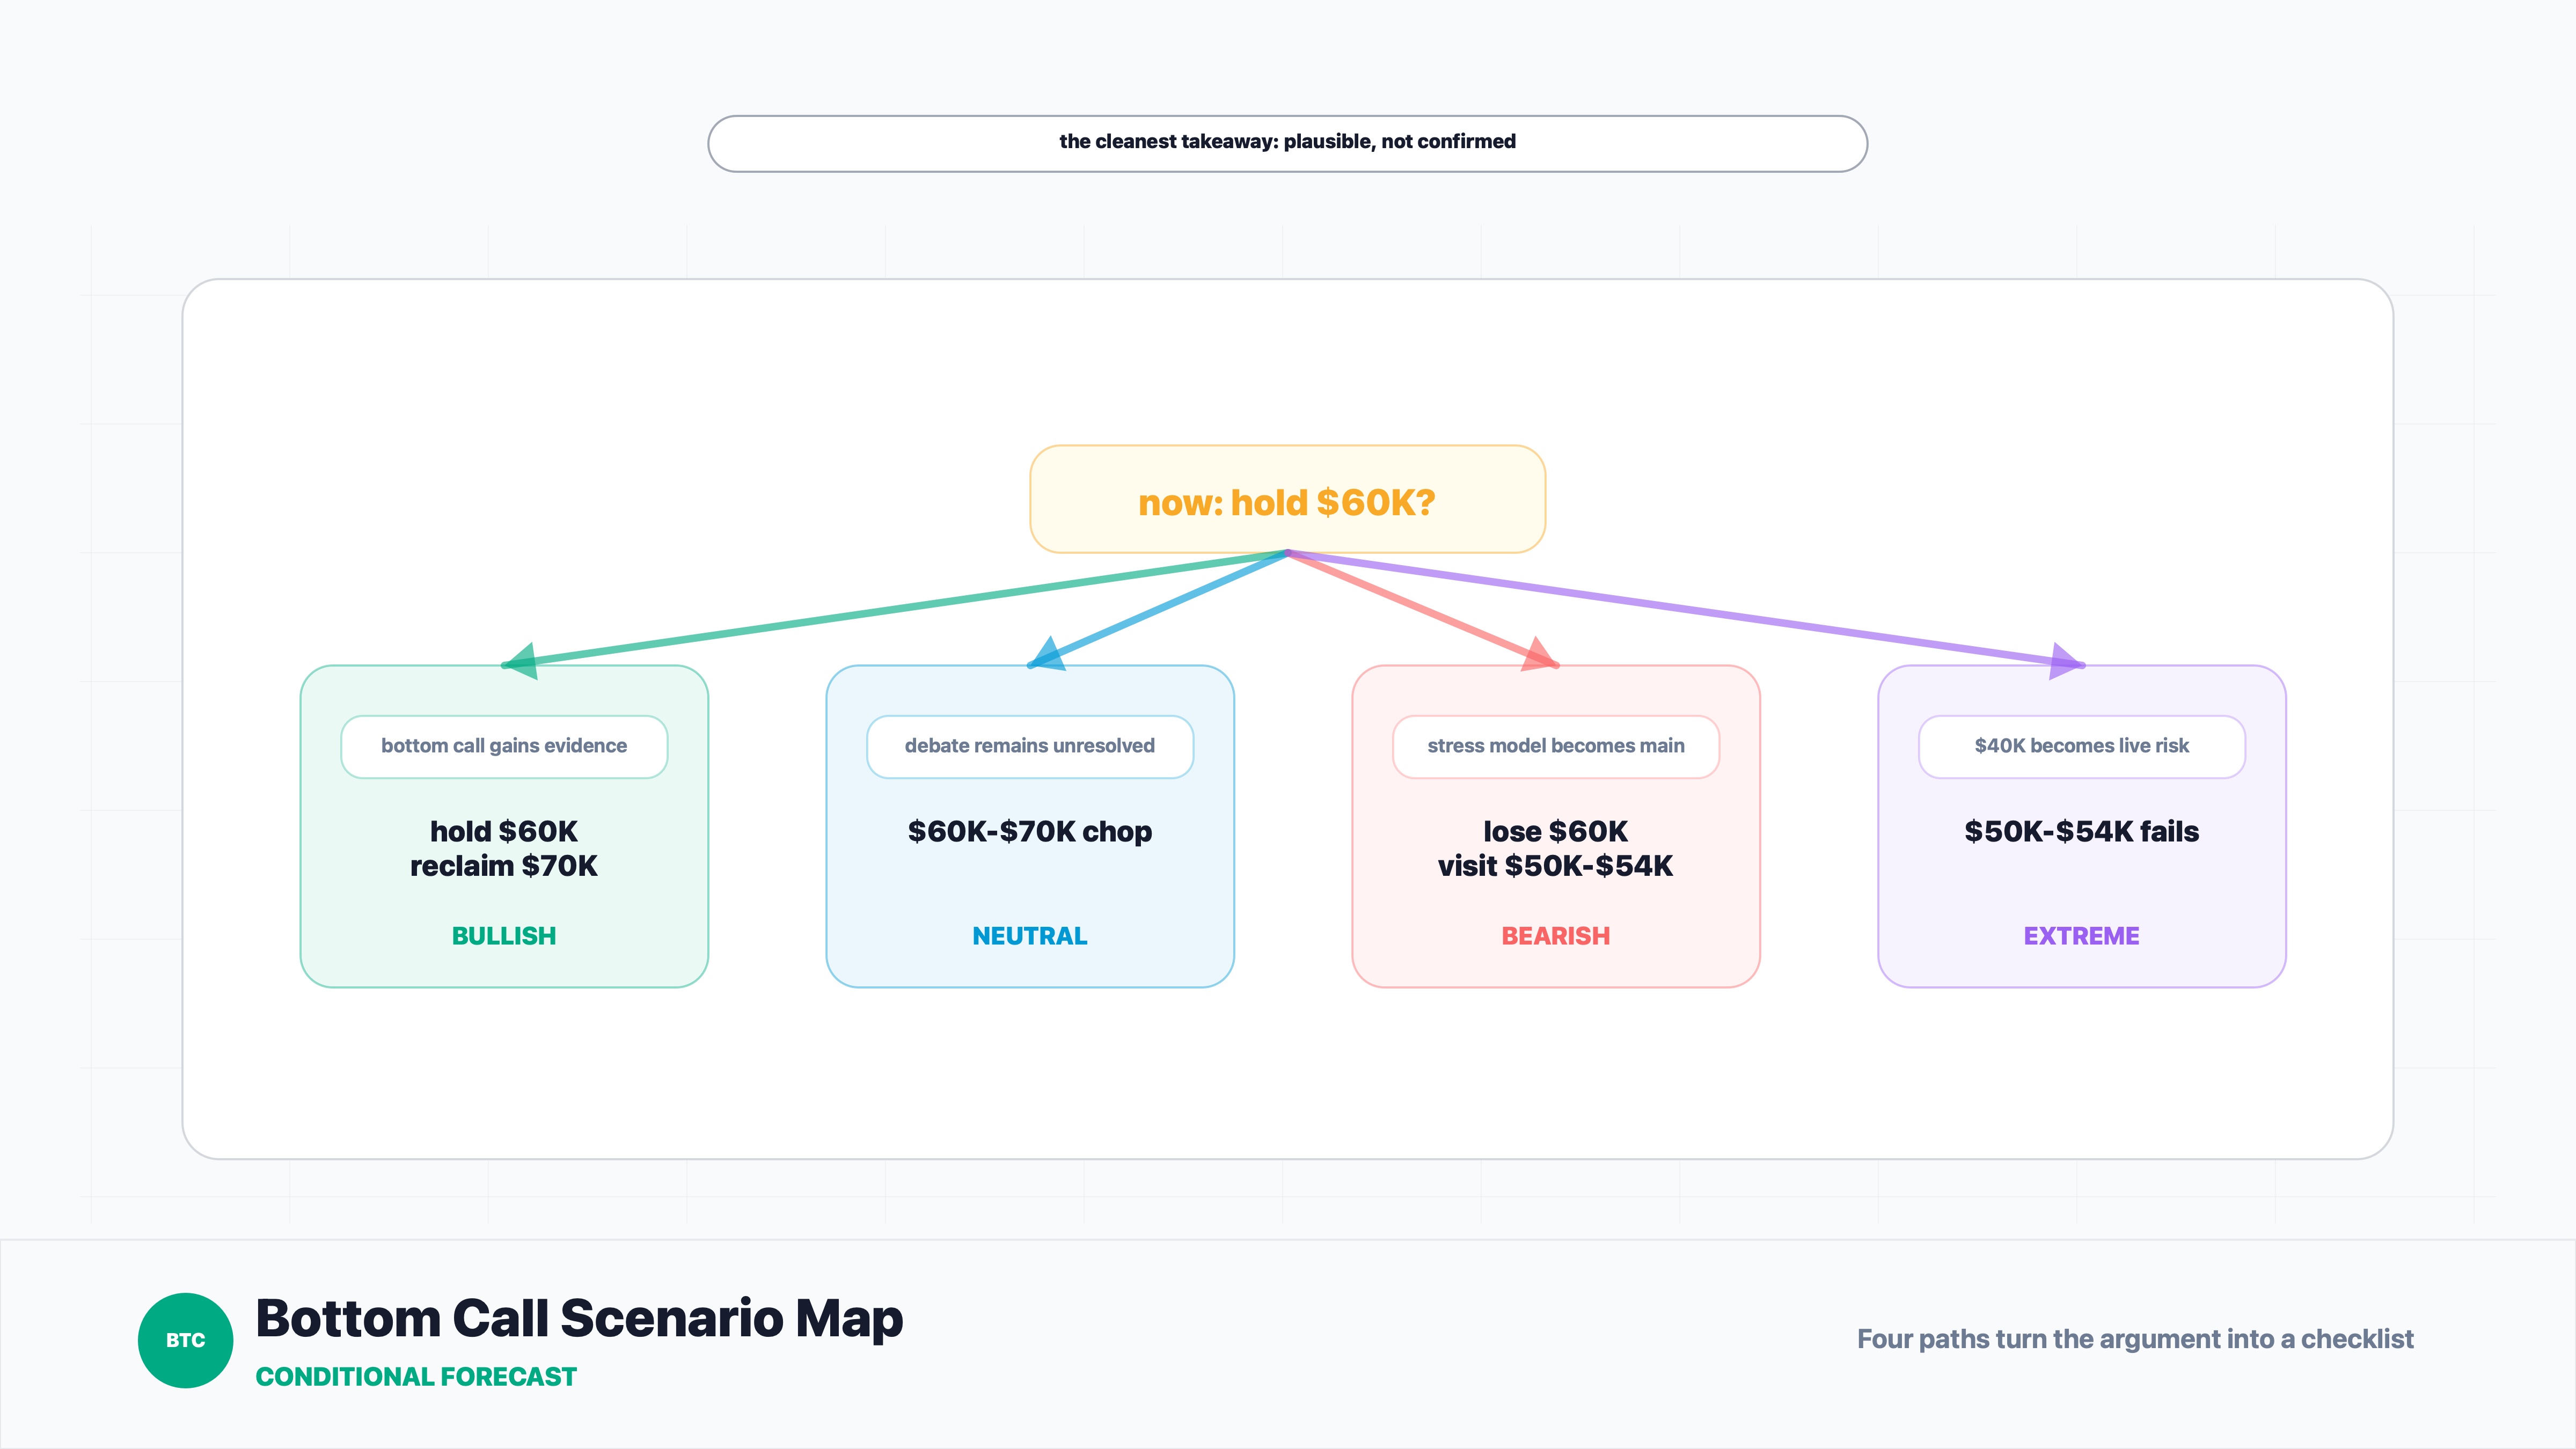
Bullish scenario: If BTC holds $60K and reclaims $70K on the weekly chart, the market can start treating Mow's argument as more than a confident cycle call. The interpretation would be that ETF-era demand pulled the cycle forward, but did not destroy the longer-term bid.
Neutral scenario: If BTC chops between $60K and $70K, the bottom debate stays unresolved. That would be the least satisfying outcome and therefore a very market-like one. It would mean bulls can defend the area, but not yet prove that a new expansion phase has begun.
Bearish scenario: If BTC loses $60K and slides into $50K-$54K, the deeper-stress model becomes the dominant frame. At that point, the question is not whether Mow is "wrong" in some social-media sense. The question is whether bitcoin has to touch the kind of long-term valuation zone that has historically mattered in major bear markets.
Extreme bearish scenario: If $50K-$54K fails, the $40K forecast stops looking like a dramatic quote and starts looking like a live risk parameter. That does not make it guaranteed. It just means the market has moved from arguing about cycles to testing solvency of conviction.
Investment Takeaway
The practical takeaway is not to pick the loudest bottom call. It is to pick the evidence that would make a bottom call reviewable.
Mow may be right that the cycle has accelerated. The pre-halving all-time high was unusual, and ETF-era demand has changed the old rhythm. But acceleration is not the same as immunity. A faster cycle can bring the top forward, the bottom forward, or both. That is why the chart matters.
For investors, $60K is the first filter. Above it, bitcoin can argue that sellers are running out of room. Above $70K, the argument improves because price begins repairing structure. Below $60K, the market will probably care less about cycle theory and more about whether the $50K-$54K zone attracts real demand.
So the cleaner view is this: Mow's bottom call is plausible, but not confirmed. The chart is not rejecting it yet. It is asking for proof.
Sources
- CoinDesk: Samson Mow says bitcoin bottom is in, but analysts remain divided (https://www.coindesk.com/markets/2026/06/28/samson-mow-says-bitcoin-bottom-is-in-but-analysts-remain-divided)
- CoinDesk: Bitcoin may need to plunge 15% or more to mark bottom, according to this long-time indicator (https://www.coindesk.com/markets/2026/06/23/bitcoin-may-need-to-plunge-15-or-more-to-mark-bottom-according-to-this-long-time-indicator)
- TradingView: BTCUSDT weekly chart (https://www.tradingview.com/chart/?symbol=BINANCE%3ABTCUSDT&interval=W)
- CoinMarketCap Academy: Bitcoin in 2022, a year to forget (https://coinmarketcap.com/academy/article/bitcoin-in-2022-a-year-to-forget)
|
DISCLAIMER:
1. All content on this website (including but not limited to articles, data, charts, and analyses) is for general informational purposes only and does not constitute any form of investment advice, trading recommendation, or financial guidance. 2. Cryptocurrencies and digital assets are subject to extreme price volatility and high investment risk; you may lose part or all of your principal. Past performance does not predict future results. 3. The information on this website is based on sources we believe to be reliable, but we do not guarantee its accuracy, completeness, or timeliness. Any investment decisions made based on this website’s information are at your own risk. 4. We strongly recommend that you conduct your own thorough research and consult an independent, licensed financial advisor before making any investment decisions. |
Recommended reading
Latest News