Key Takeaways
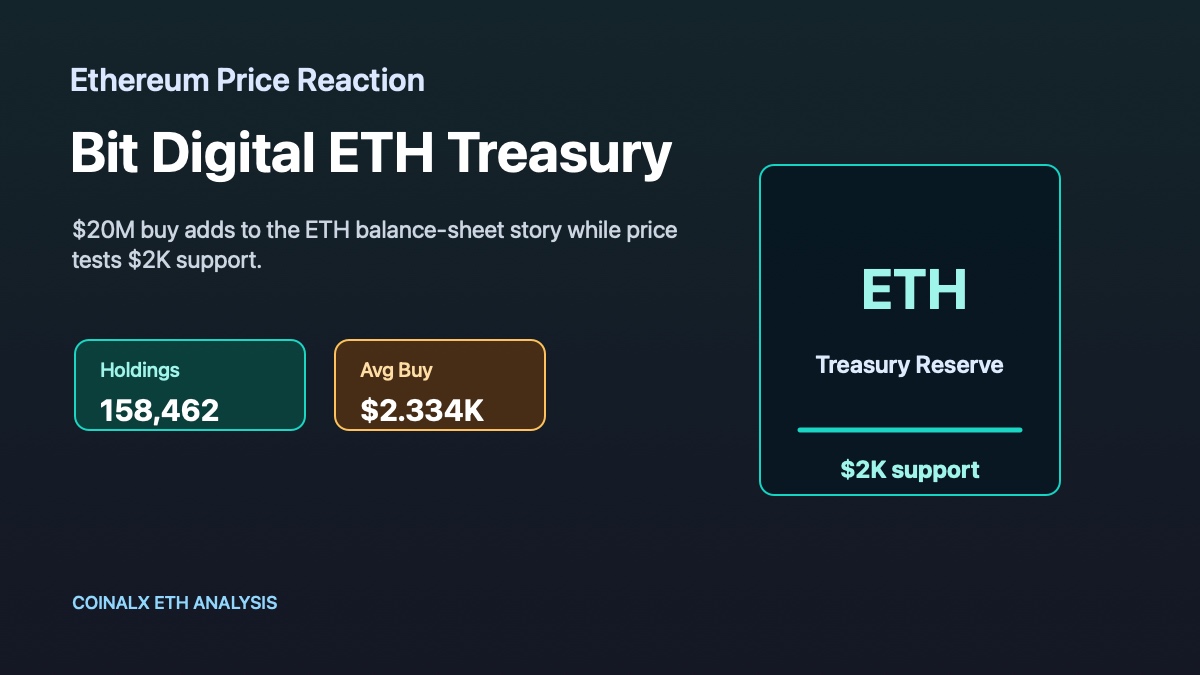
Ethereum fell to $1,814, its lowest level in more than 14 weeks, putting the $1,800 support zone under direct pressure.
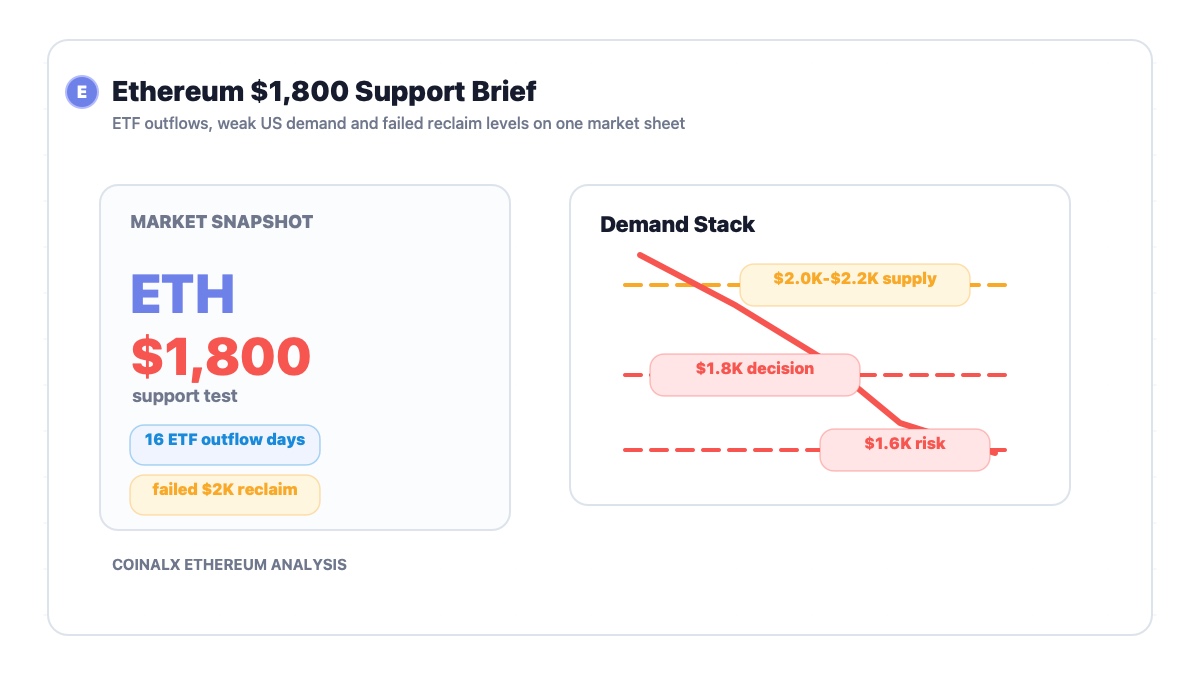
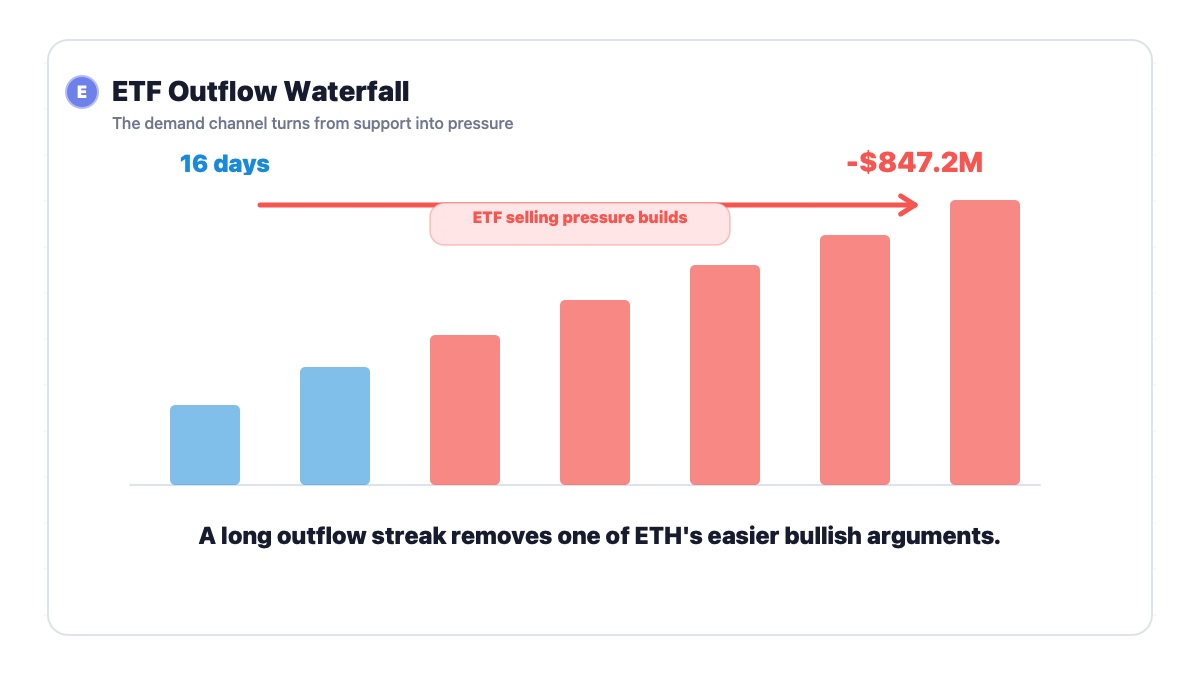
Cointelegraph reported that spot Ethereum ETFs saw 16 straight days of outflows, with investors withdrawing about $847.2 million over that period.
ETH has lost the $2,000 and $2,200 areas, turning the chart from "messy consolidation" into a cleaner bearish structure.
A quick reclaim of $2,000 would reduce downside pressure; a clean break below $1,800 keeps $1,600 and possibly $1,200-$1,250 in view.
What Happened
Ethereum has reached the kind of price level where the market stops having a casual opinion and starts checking the floorboards.
According to Cointelegraph, Ether fell as low as $1,814 on Wednesday, its lowest level in more than 14 weeks. The move brought ETH directly into the $1,800 area, a support zone traders are watching because losing it could open the way toward deeper downside targets.
The technical picture is not subtle. ETH has already lost the $2,200 and $2,000 areas, and Cointelegraph noted that major daily moving averages sit inside that former support zone. Once a market drops below an area like that, the zone stops acting like a floor and starts acting like an overhead shelf full of heavy objects. Every bounce has to prove it can climb back through that mess.
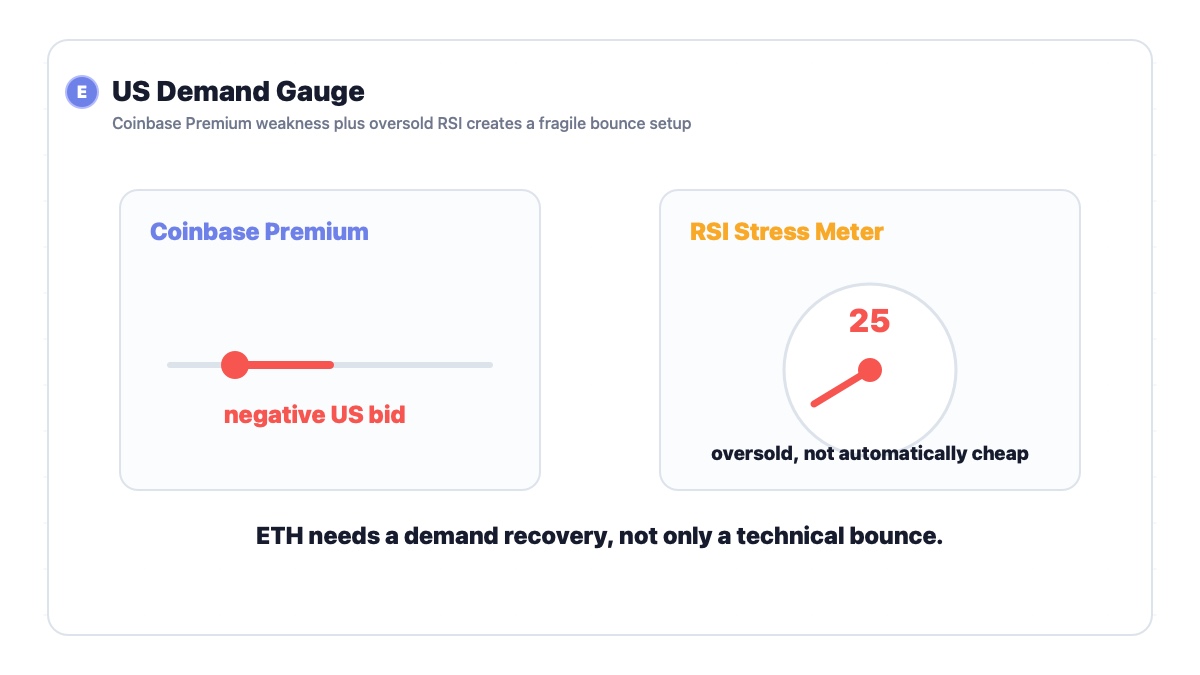
The daily RSI also fell to 25, its weakest reading since Feb. 6. That matters in two directions at once. It confirms strong downside pressure, but it also says ETH is becoming oversold. Oversold does not mean cheap. It means the market has been hit hard enough that a bounce becomes possible. Those are not the same sentence, even though traders often try to make them wear the same jacket.
The deeper concern is demand. Cointelegraph reported that the Ethereum Coinbase Premium Index dropped to -0.16 on May 28 before recovering to -0.13, its weakest level since February. A negative Coinbase premium means ETH is trading cheaper on Coinbase than on Binance, which points to weaker US spot demand.
That weakness is also showing up in ETF flows. Spot Ethereum ETFs have posted 16 consecutive days of outflows, the longest losing streak since March 2025, with about $847.2 million withdrawn over the period, according to SoSoValue data cited by Cointelegraph.
Why This Matters for Ethereum and Crypto Markets
This matters because Ethereum is not only fighting a chart level. It is fighting a demand problem.
The $1,800 area is important because it is both technical and psychological. Technically, it is a visible support level after a multi-week slide. Psychologically, it is the place where the market decides whether ETH is still forming a stressed but tradable base, or whether sellers have enough control to drag price into a thinner demand zone.
The Coinbase Premium is the quiet but important part of the story. A weak premium tells us that US buyers are not eagerly stepping in at current prices. That does not mean every US investor is selling ETH. Markets are not that neat. But it does mean the marginal buyer is not acting like a heroic protagonist right now. More like someone standing near the exit, pretending to read the menu.
ETF outflows make that worse. Ethereum ETFs were supposed to create a steadier institutional demand channel. When that channel posts 16 straight days of withdrawals, the market loses one of its easier bullish arguments. ETH can still rebound, but it has to do it without leaning on the comforting story that passive institutional demand is automatically absorbing every dip.
For broader crypto markets, ETH weakness matters because Ethereum is still the center of a large part of the risk curve. DeFi, layer-2 tokens, staking narratives and many altcoin beta trades still take emotional cues from ETH. If ETH holds $1,800 and begins reclaiming lost levels, the rest of the market can stabilize. If ETH breaks lower, the message spreads fast: investors are not just rotating within crypto; they are reducing exposure to crypto's second-largest asset.
That is a different kind of warning.
Historical Parallel: February 2026's ETH Capitulation Zone
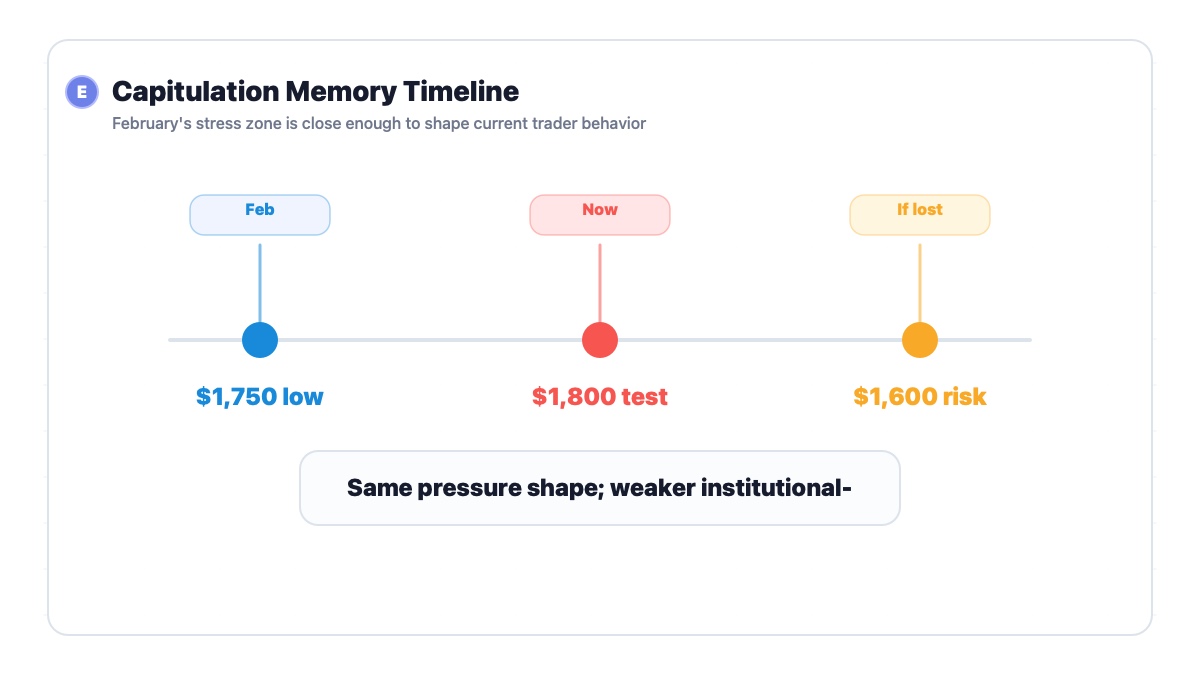
The closest historical parallel is Ethereum's February 2026 selloff, which Cointelegraph referenced several times in the current report. During that earlier move, ETH dropped to multi-year lows around $1,750, the Coinbase Premium also reached deeply negative levels, and the daily RSI became similarly depressed. Cointelegraph noted that ETH later rebounded about 39% from that February stress point.
The similarity is the shape of pressure. In both cases, ETH was not merely drifting lower because traders were bored. Spot demand looked weak, US demand was discounted through Coinbase, and technical momentum had become aggressively negative. When those three things line up, the market starts behaving less like a clean auction and more like a stress test. Buyers do not need to disappear entirely; they only need to hesitate long enough for sellers to set the price.
The $1,800 area also makes the comparison unusually direct. February's low near $1,750 sits close enough to the current zone that traders naturally treat it as a memory test: did that area become a durable bottom, or was it only the first warning shot?
The difference is that the current setup has ETF outflows sitting directly in the foreground. February looked more like a broad capitulation episode. This time, the market also has to process a persistent institutional withdrawal channel. Sixteen straight days of ETF outflows changes the bounce math, because it means ETH needs more than oversold conditions. It needs demand to actually return.
The lesson is conditional. If ETH defends $1,800 and quickly reclaims $2,000, February's pattern becomes relevant as a potential capitulation echo. If ETH loses $1,800 while ETF outflows continue, the better lesson from history is not "a rebound is guaranteed." It is "capitulation can go further than people emotionally budgeted for."
Ethereum Price Reaction and K-Line Analysis
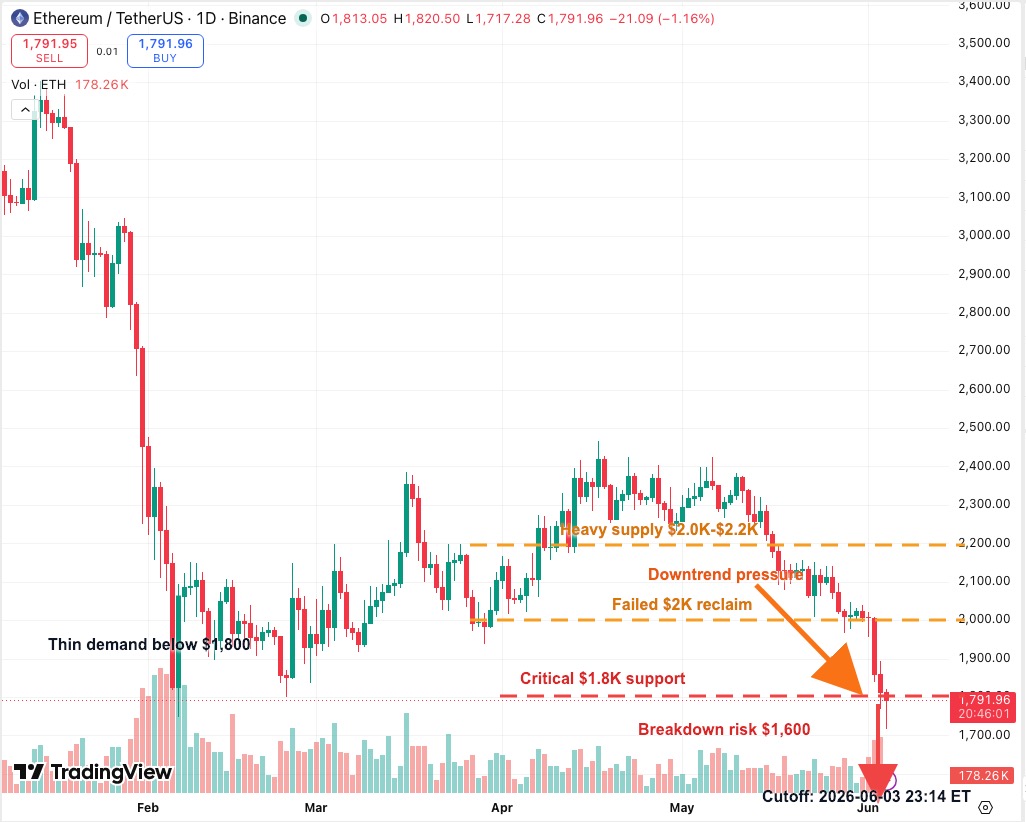
The ETHUSDT daily chart shows the problem clearly.
Ethereum has been sliding from the $2,300-$2,400 area since May, then lost the $2,200 area, then failed to hold $2,000, and finally pushed into the $1,800 support zone. That sequence matters. A market that loses one level can recover quickly. A market that loses level after level starts training traders to sell every bounce until proven otherwise.
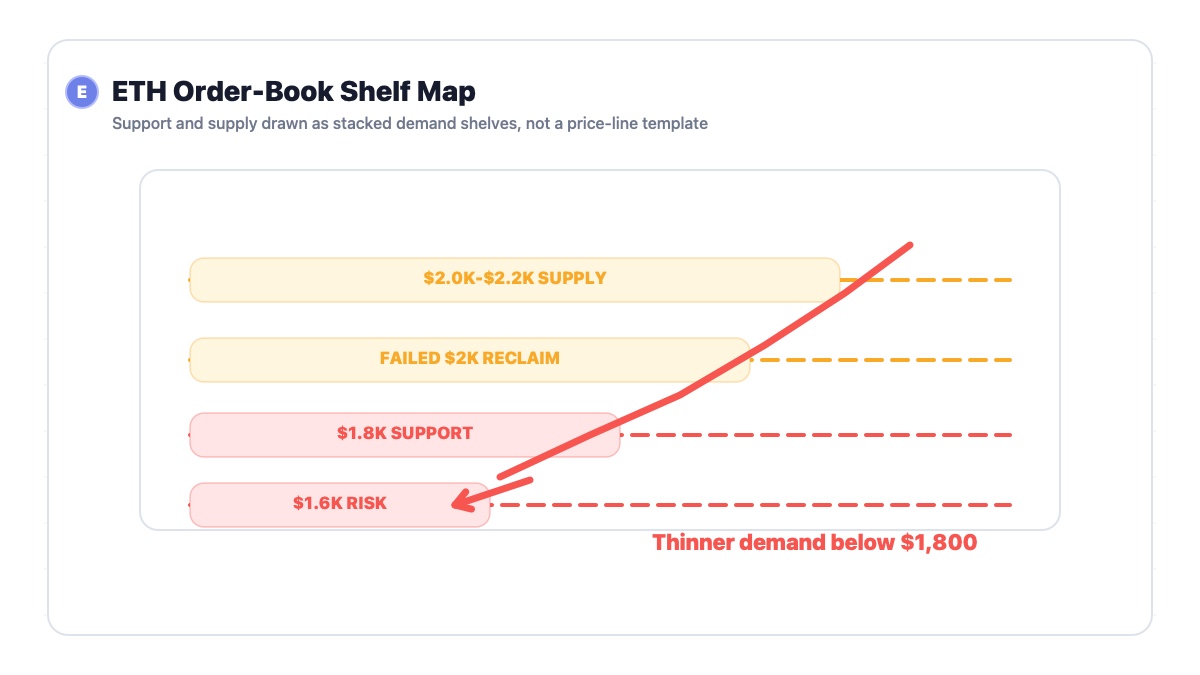
The first key area is $2,000-$2,200. Cointelegraph noted that major daily moving averages sit in this zone, and the chart now treats it as supply. ETH needs to reclaim at least $2,000 before the market can seriously argue that sellers are losing control. A bounce that stalls below $2,000 would look less like a reversal and more like a tired market sitting down on the stairs.
The second area is $1,800. This is the immediate decision zone. ETH traded below it on the chart cutoff, which means traders should not treat the level as magically intact just because the number is famous. The real test is whether ETH can close back above $1,800 and hold there for more than a reflex bounce.
Below $1,800, the chart gets thinner. Cointelegraph cited trader targets around $1,700 and $1,600, while Glassnode cost-basis data in the report pointed to a weaker accumulation zone between $1,800 and $1,250, with more meaningful acquisition around $1,200. That does not mean ETH must go there. It means the market has fewer obvious demand shelves if $1,800 fails cleanly.
Key Levels to Watch
The immediate support is $1,800. ETH needs to reclaim and hold this zone to avoid turning the breakdown into a broader trend move.
The first downside level is $1,700. This is the area traders may watch if ETH keeps closing below $1,800.
The next major downside target is $1,600. A move there would confirm that the market is no longer just testing support; it is repricing ETH into a lower range.
The first reclaim level is $2,000. ETH needs to recover this area before the chart deserves a less defensive interpretation.
The larger resistance band is $2,000-$2,200. That zone now carries the weight of broken support, moving averages and trapped buyers.
Conditional Forecast
If ETH reclaims $1,800 quickly and pushes back toward $2,000, the current move can still become an oversold capitulation-style low. In that scenario, the February parallel matters because deeply negative Coinbase Premium readings and oversold RSI conditions have previously appeared near exhaustion points.
If ETH fails below $1,800 and ETF outflows continue, the downside path opens toward $1,700 and $1,600. That would keep sellers in control and make every bounce below $2,000 suspect.
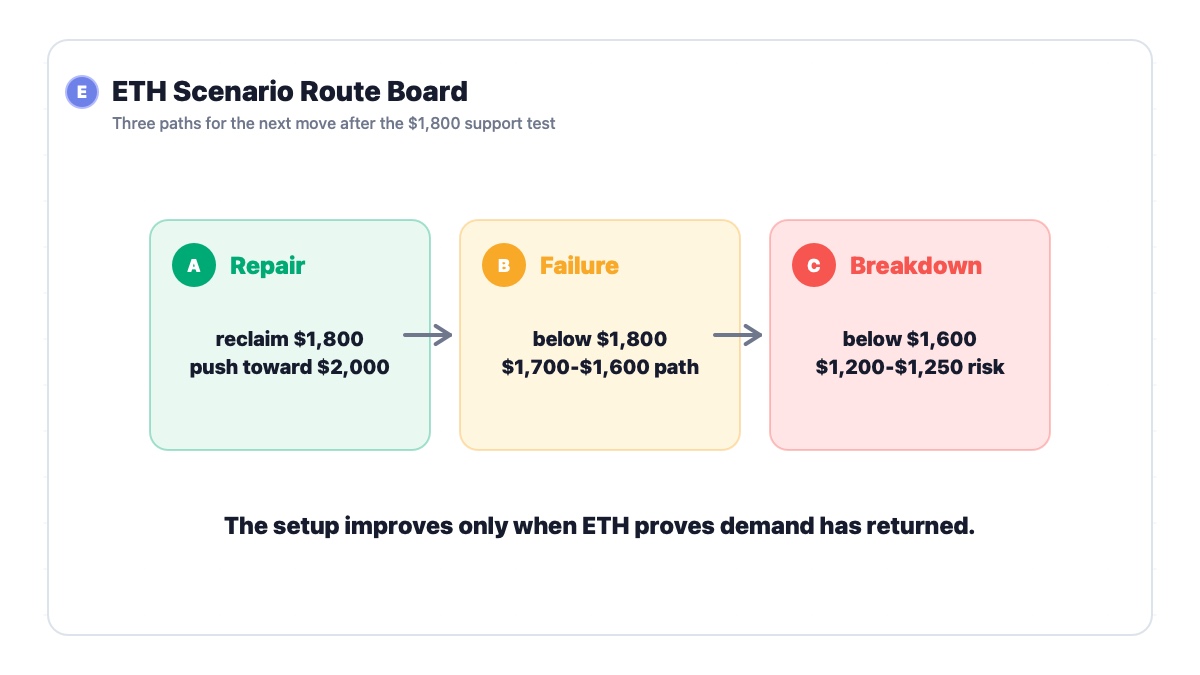
If ETH breaks below $1,600 with strong volume, the market may start pricing the deeper $1,200-$1,250 cost-basis zone. That would be a more serious risk-off signal for Ethereum, not just a rough day on the chart.
Investment Takeaway
Ethereum is not in a hopeless setup. It is in a prove-it setup.
The bullish case needs evidence: a reclaim of $1,800, a push back toward $2,000, improving Coinbase Premium, and some sign that ETF outflows are slowing. Without those, bullish arguments become mostly vibes wearing a chart costume.
For traders, the cleanest framework is simple. Above $1,800, ETH can attempt a repair bounce. Below $1,800, the market is vulnerable to $1,700-$1,600. Above $2,000, the conversation improves. Below $1,600, the conversation gets colder.
For longer-term investors, the current zone is important but not automatically safe. Weak institutional flow and thin demand below $1,800 mean patience matters. Catching falling knives is hard enough; doing it while ETF flows are leaving the building is a special hobby.
Sources
Cointelegraph: Ethereum drops to 14-week lows: Can ETH price hold $1.8K support?
TradingView: ETHUSDT chart, Binance
SoSoValue: Ethereum ETF flow data
CryptoQuant: Ethereum Coinbase Premium Index
|
DISCLAIMER:
1. All content on this website (including but not limited to articles, data, charts, and analyses) is for general informational purposes only and does not constitute any form of investment advice, trading recommendation, or financial guidance. 2. Cryptocurrencies and digital assets are subject to extreme price volatility and high investment risk; you may lose part or all of your principal. Past performance does not predict future results. 3. The information on this website is based on sources we believe to be reliable, but we do not guarantee its accuracy, completeness, or timeliness. Any investment decisions made based on this website’s information are at your own risk. 4. We strongly recommend that you conduct your own thorough research and consult an independent, licensed financial advisor before making any investment decisions. |