Bitcoin Price Prediction: BTC Rebounds on Trump Post but May Losses Loom
Key Takeaways
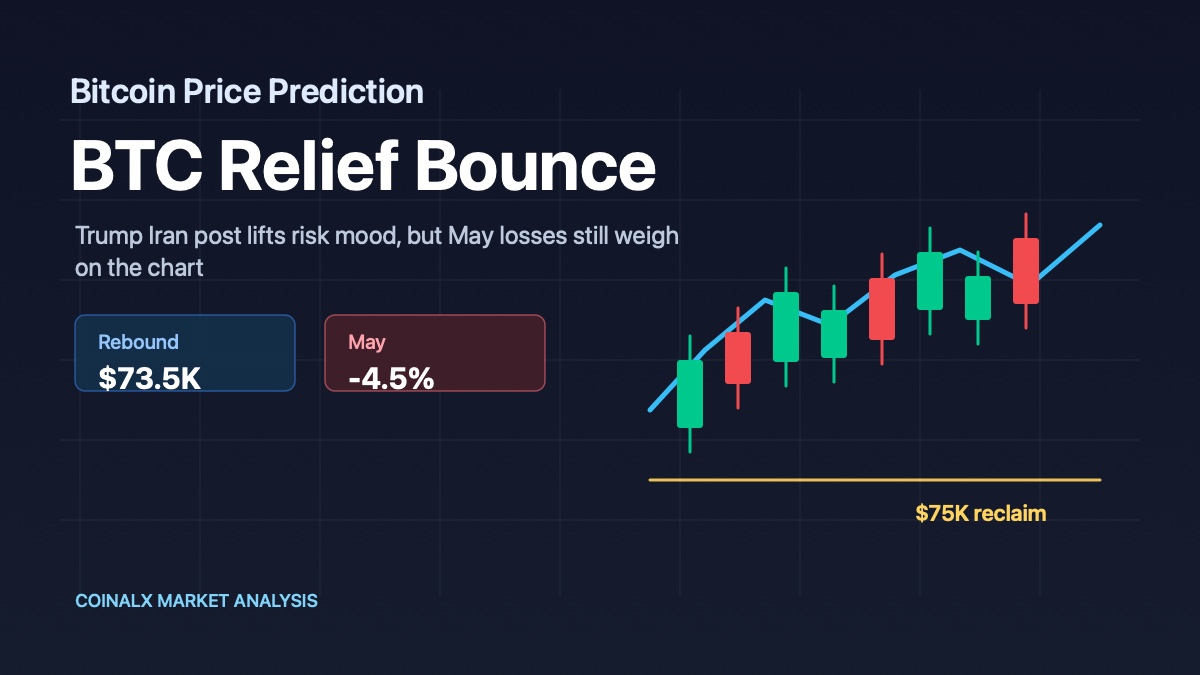
BTC bounced about $1,000 from its May 29 morning low after President Trump posted about a possible Iran peace deal, but Bitcoin still remained on track for a losing month.
CoinDesk reported BTC near $73,500, down about 4.5% in May, while U.S. stocks closed the month with strong gains and record highs.
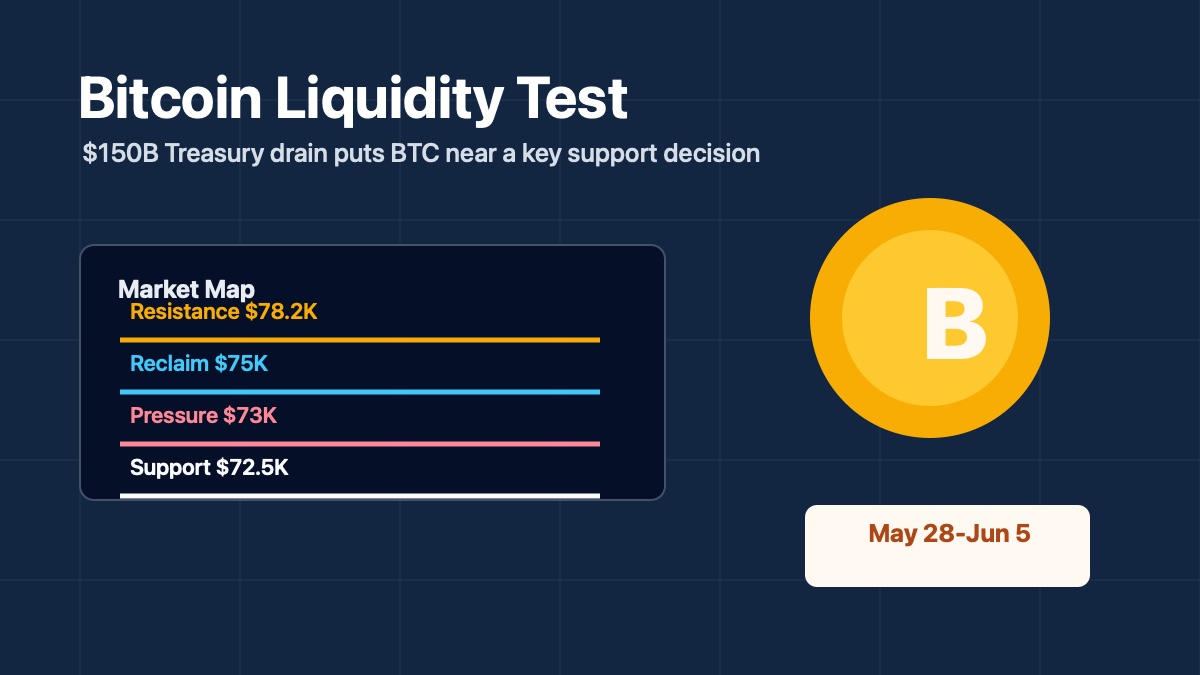
The key downside zone is $72,500 to $73,000; losing it would turn the failed May rebound into a more serious breakdown risk.
A reclaim of $75,000 would ease short-term pressure, while $78,200 remains the stronger resistance level needed to change the bearish structure.
What Happened
CoinDesk reported that Bitcoin recovered from its morning lows on May 29 after President Trump posted on Truth Social that he was meeting in the "Situation Room" to make "a final determination" on an Iran peace deal.
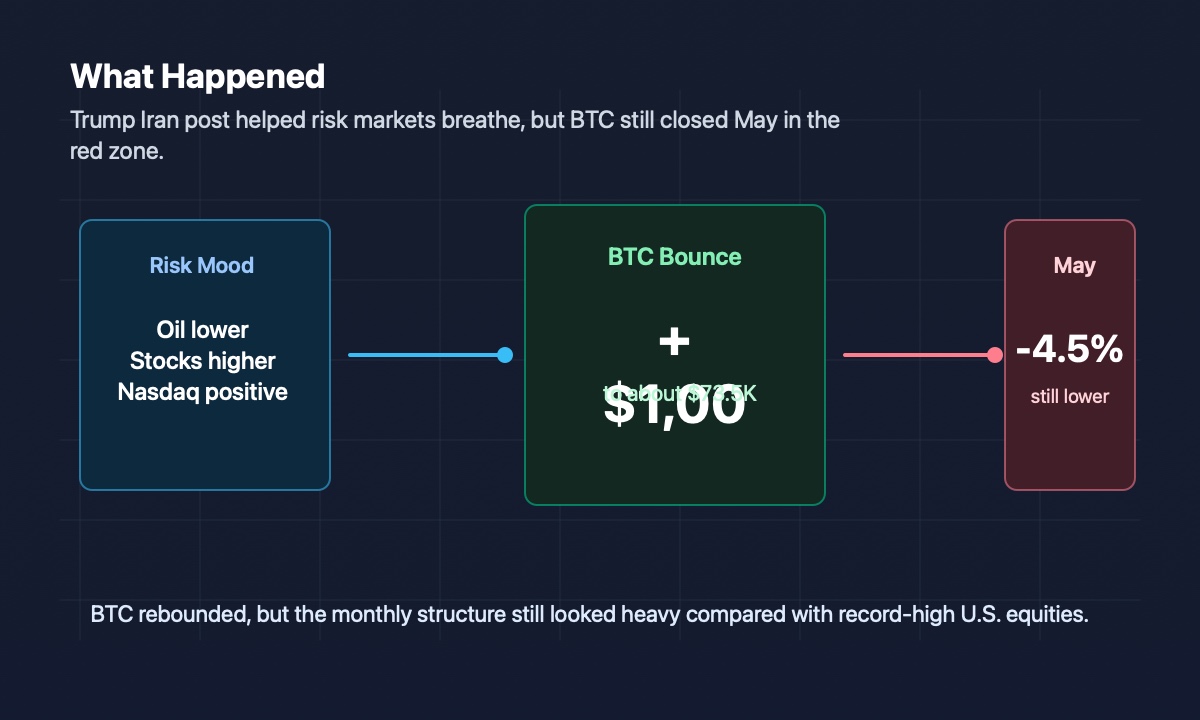
The post helped risk markets breathe a little. Oil fell back to a one-month low, U.S. stocks moved higher, and the Nasdaq turned modestly positive on the day. Bitcoin joined the move, rising roughly $1,000 from the morning low to about $73,500.
That sounds constructive.
But it was not enough to fix the larger crypto picture.
BTC had fallen back to $72,500 earlier in U.S. morning trade, down about 0.5% over 24 hours and 5.5% over the previous week. CoinDesk also noted that Bitcoin began May near $77,000, meaning BTC was still on track to end the month lower unless it staged a large rally into month-end.
The broader comparison was awkward. U.S. stocks had a strong May: the Nasdaq rose more than 8%, the S&P 500 gained 5%, and the Dow added nearly 3%, with all three major indexes closing the month at record highs. Crypto, meanwhile, was heading toward its first monthly loss in three months. Bitcoin was down about 4.5% for May, ether had fallen more than 11%, and solana was down about 2.1%.
So the headline is not simply "Bitcoin bounced."
The headline is: Bitcoin bounced on good macro news and still looked tired.
Why This Matters for Bitcoin and Crypto Markets
The obvious version of this story is that Trump posted something hopeful, risk assets went up, and Bitcoin recovered.
That version is true in the same way a weather report saying "it rained" is true. It gives you the event. It does not tell you why your basement is full of water.
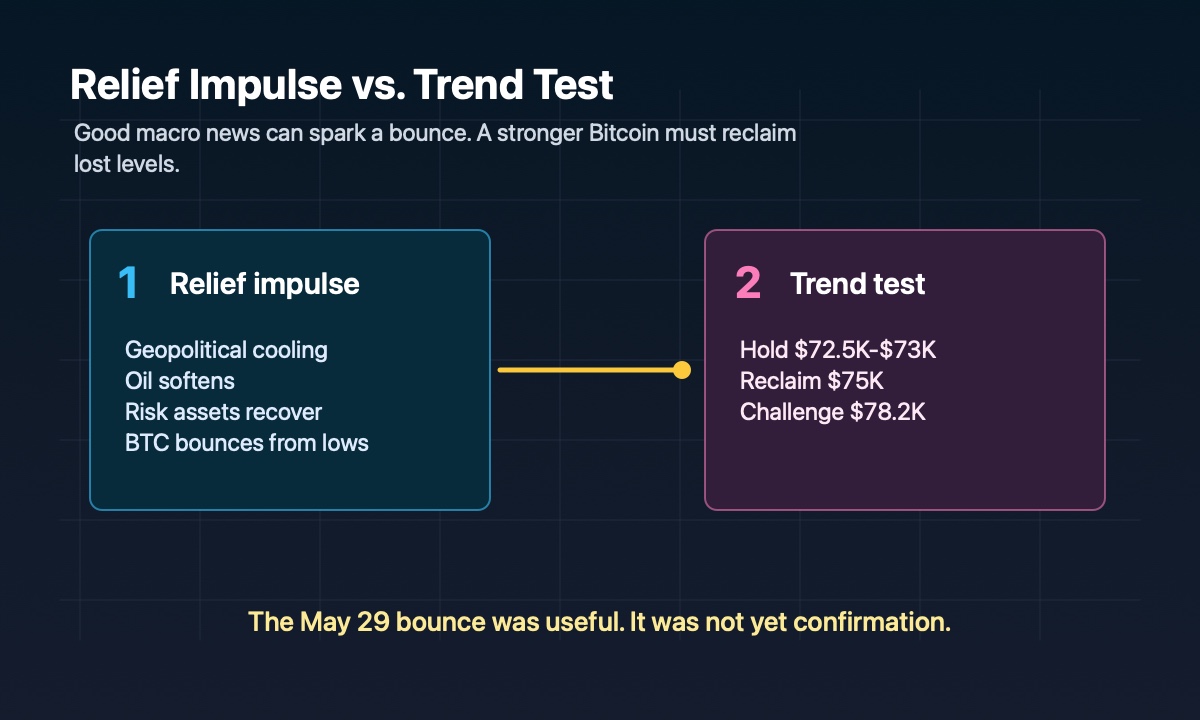
The useful model has two parts: the relief impulse and the trend test.
The relief impulse is easy to understand. When markets get a hint that geopolitical tension might cool, oil can soften, stocks can rally, bond yields can ease, and traders can add risk back. Bitcoin often participates in that kind of move because it is liquid, global, and emotionally caffeinated.
The trend test is the harder part. A strong asset does not just bounce on good news. It uses good news to reclaim lost levels. That is where Bitcoin looked less impressive. The Trump post helped BTC move off the low, but the move still left price below the $75,000 area and far below the stronger $78,200 resistance zone.
That creates the central tension in this article.
If Bitcoin were simply waiting for a risk-on headline, this should have been a cleaner rescue. Instead, the market produced something smaller: a rebound inside a weakening structure. Useful, yes. Convincing, not yet.
This matters because crypto was diverging from traditional risk assets. Stocks were closing May with major gains and record highs, while Bitcoin was trying not to end a two-month winning streak. When the supposedly high-beta asset cannot keep up with the party, the question becomes uncomfortable: is BTC lagging temporarily, or is crypto-specific demand weaker than the macro backdrop suggests?
The chart is where that question stops being philosophical and starts becoming a set of price levels.
Historical Parallel: The Previous Iran Shock Was Louder Than This Bounce
A useful historical parallel is not some ancient Bitcoin cycle. It is the immediately previous Iran-driven shock.
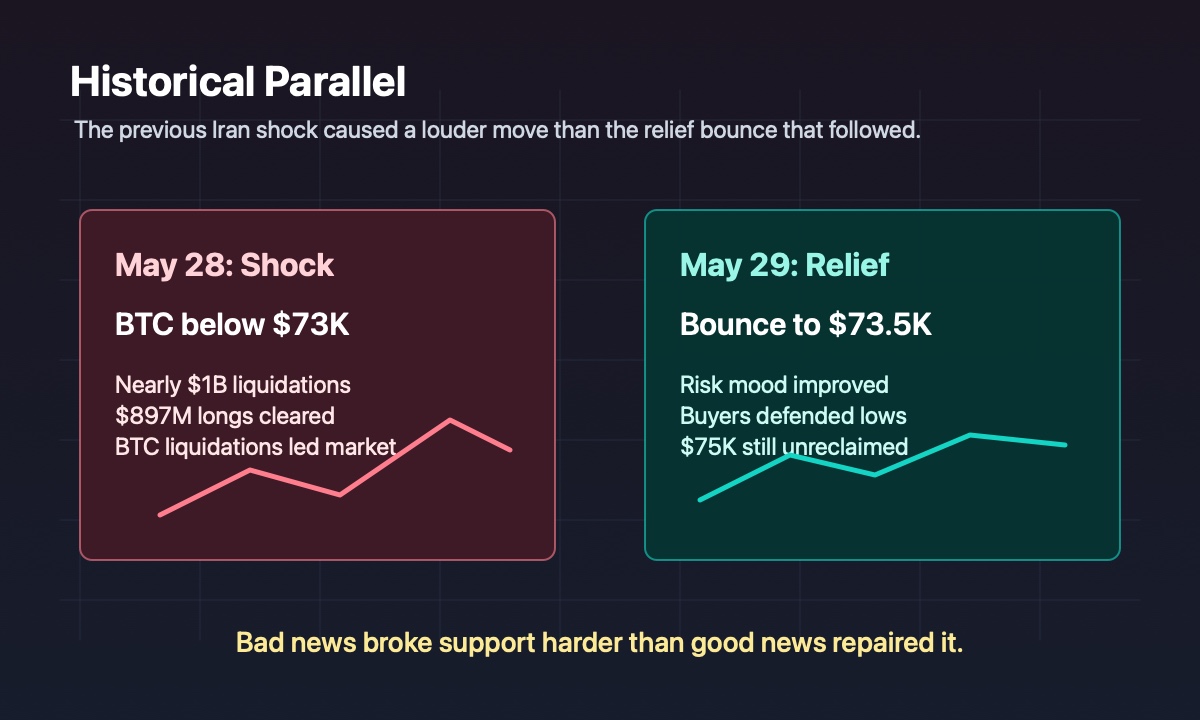
On May 28, CoinDesk reported that Bitcoin dropped below $73,000 after U.S. airstrikes on an Iranian military site near the Strait of Hormuz reignited a conflict that markets had started to price out. Nearly $1 billion in leveraged crypto positions were liquidated in 24 hours, including about $897 million from longs and $61 million from shorts. Bitcoin liquidations led the market at $386 million, followed by ether at $246 million.
That event was the loud version of the same mechanism.
The similar part is the geopolitical transmission channel. In both cases, Middle East headlines moved through oil, stocks, risk appetite, and crypto positioning. Bitcoin did not trade in a private little Bitcoin room with special Bitcoin furniture. It traded inside the same risk machine as everything else, except faster and with more leverage sitting near the exits.
The difference is direction and intensity. The May 28 shock was a forced deleveraging event: traders were leaning toward recovery, the headline hit the wrong way, and the market cleared positions in a single ugly session. The May 29 Trump post was the opposite kind of headline: a relief signal. But the relief bounce was smaller than the previous damage.
That is the lesson for the current BTC setup. Bad geopolitical news was strong enough to break the $73,000 area and trigger a liquidation cascade. Good geopolitical news was strong enough to lift BTC from the lows, but not strong enough to reclaim $75,000.
Markets do not speak English. They speak levels.
And right now, the levels are saying that relief is helpful, but repair is still unfinished.
Bitcoin Price Reaction and K-Line Analysis
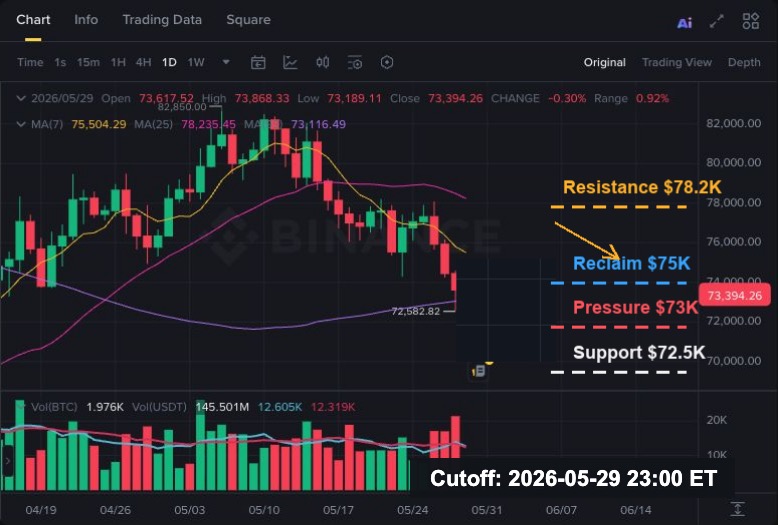
BTC/USDT daily candlestick chart showing Bitcoin's late-May rebound attempt after the Trump Iran post.
The daily K-line structure is still heavy.
Bitcoin pushed into the $82,500 area earlier in May and then rolled over. The decline did not stop at a polite shallow pullback. It pushed through the $75,000 area and tested the low-$72,000s, with CryptoCurrencyChart showing a May 29 low of $72,512.49 on Binance BTC/USDT.
That makes $72,500 to $73,000 the first real support zone.
The Trump-related bounce matters because it showed buyers were still present near that zone. BTC did not simply fall through the floor and keep going. It bounced toward $73,500. That is the good news.
The less good news is that the bounce did not reclaim $75,000.
That is why the $75,000 level is the hinge. Below it, the move looks like a relief rally inside a downshift. Above it, the market can start arguing that the late-May breakdown was overdone.
The moving averages on the chart also lean cautious. Shorter-term averages are above price, while the longer moving average sits closer to the support area. That tells us the market is no longer in a clean upside trend. It is in repair mode, and repair mode is a less glamorous neighborhood.
Volume adds one more clue. May 28 and May 29 carried heavier trading activity around the breakdown and rebound zone. That means the $72,500 to $75,000 area is not random chart decoration. It is where buyers and sellers actually showed up.
Key Levels to Watch
The first level is $72,500.
This is the nearest visible support from the late-May low. If BTC loses this area on a daily closing basis, the Trump-post bounce starts looking like a pause rather than a reversal.
The second level is $73,500.
This is the rebound area mentioned in the CoinDesk report. Holding above it would show that buyers are at least defending the post-bounce zone. Repeated failures around it would suggest the market is still fragile.
The third level is $75,000.
This is the reclaim level. BTC needs to get back above $75,000 before the short-term structure meaningfully improves. Without that, rallies can keep looking like temporary relief.
The fourth level is $78,200.
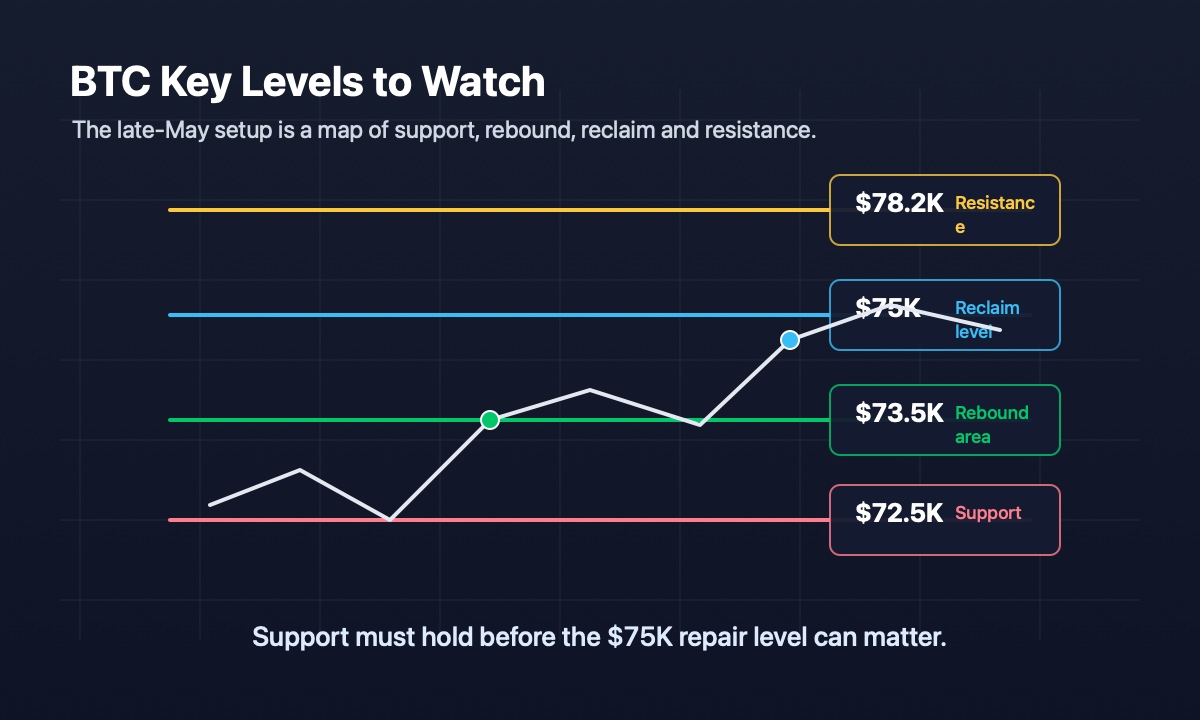
This is the stronger resistance area. A daily close above $78,200 would not make the May weakness disappear, but it would change the tone of the chart. It would suggest that sellers failed to turn the May breakdown into a deeper trend.
Conditional Forecast
Bullish Scenario
If BTC holds $72,500 to $73,000 and reclaims $75,000 with stronger volume, the market may treat the late-May weakness as a temporary geopolitical and positioning shock rather than the start of a larger breakdown.
In this scenario, the implied investor stance is cautious re-engagement. The first confirmation is $75,000. The stronger confirmation is $78,200.
The bullish read would weaken if BTC reclaims $75,000 but quickly loses it again.
Neutral Scenario
If BTC trades between $72,500 and $75,000, the market is still undecided.
This would mean the Trump post helped stabilize sentiment, but not enough to repair the May chart. The market would be in the waiting room: not broken, not healthy, and very much checking its phone every twelve seconds.
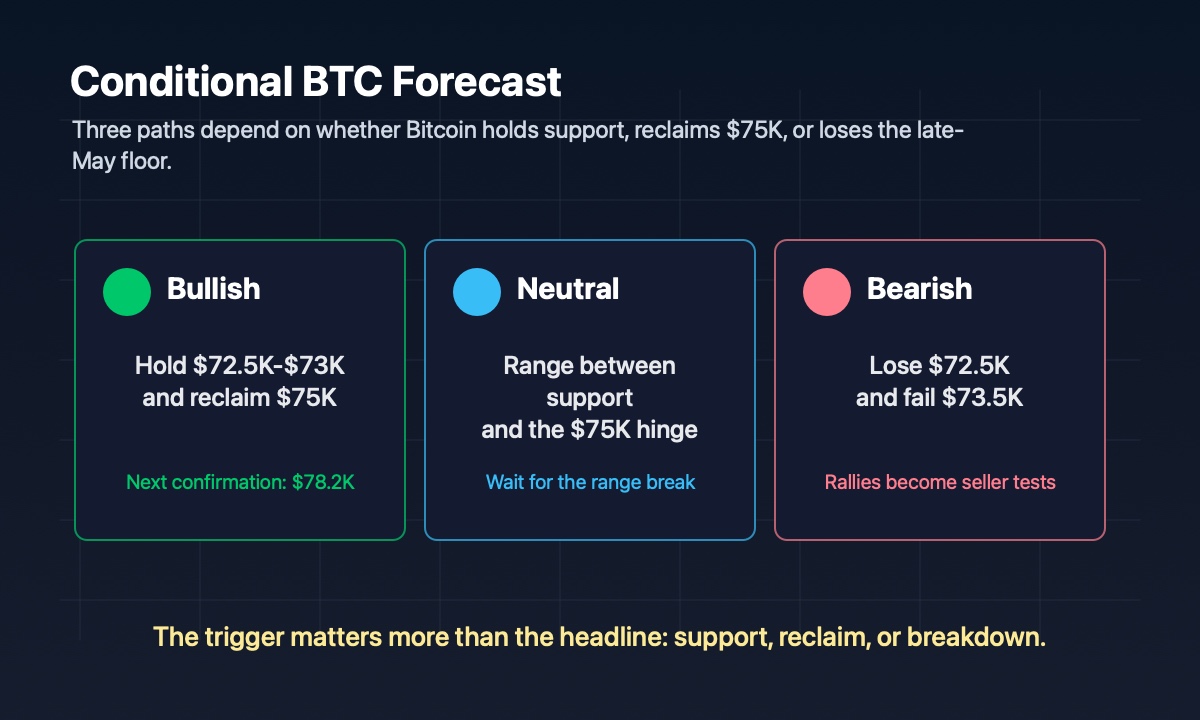
The implied investor stance here is patience. The range break matters more than the emotional temperature inside the range.
Bearish Scenario
If BTC loses $72,500 on a daily closing basis and cannot recover $73,500, the market may start treating the failed May rebound as confirmation that crypto demand is weaker than broader risk appetite.
That would shift focus toward deeper support below the visible late-May range. In this scenario, rallies into $73,500 to $75,000 would become tests of seller strength rather than automatic signs of recovery.
The bearish read would be invalidated if BTC quickly reclaims $75,000 and turns the breakdown into a failed move.
Investment Takeaway
The useful takeaway is not that Trump's post saved Bitcoin. It did not.
The useful takeaway is also not that Bitcoin is doomed because May was red. That is too neat, and markets enjoy making neat people look silly.
The better frame is this: Bitcoin received a risk-on headline, bounced from support, and still failed to reclaim the level that would make the chart look repaired.
For now, BTC needs to hold $72,500 to $73,000 and reclaim $75,000 before the short-term picture improves. Above $78,200, the bearish structure starts to lose authority. Below $72,500, the May weakness becomes harder to dismiss.
That is the map. The map is not exciting. This is fine. Exciting maps are usually how traders end up in swamps.
Sources
|
DISCLAIMER:
1. All content on this website (including but not limited to articles, data, charts, and analyses) is for general informational purposes only and does not constitute any form of investment advice, trading recommendation, or financial guidance. 2. Cryptocurrencies and digital assets are subject to extreme price volatility and high investment risk; you may lose part or all of your principal. Past performance does not predict future results. 3. The information on this website is based on sources we believe to be reliable, but we do not guarantee its accuracy, completeness, or timeliness. Any investment decisions made based on this website’s information are at your own risk. 4. We strongly recommend that you conduct your own thorough research and consult an independent, licensed financial advisor before making any investment decisions. |