Key Takeaways
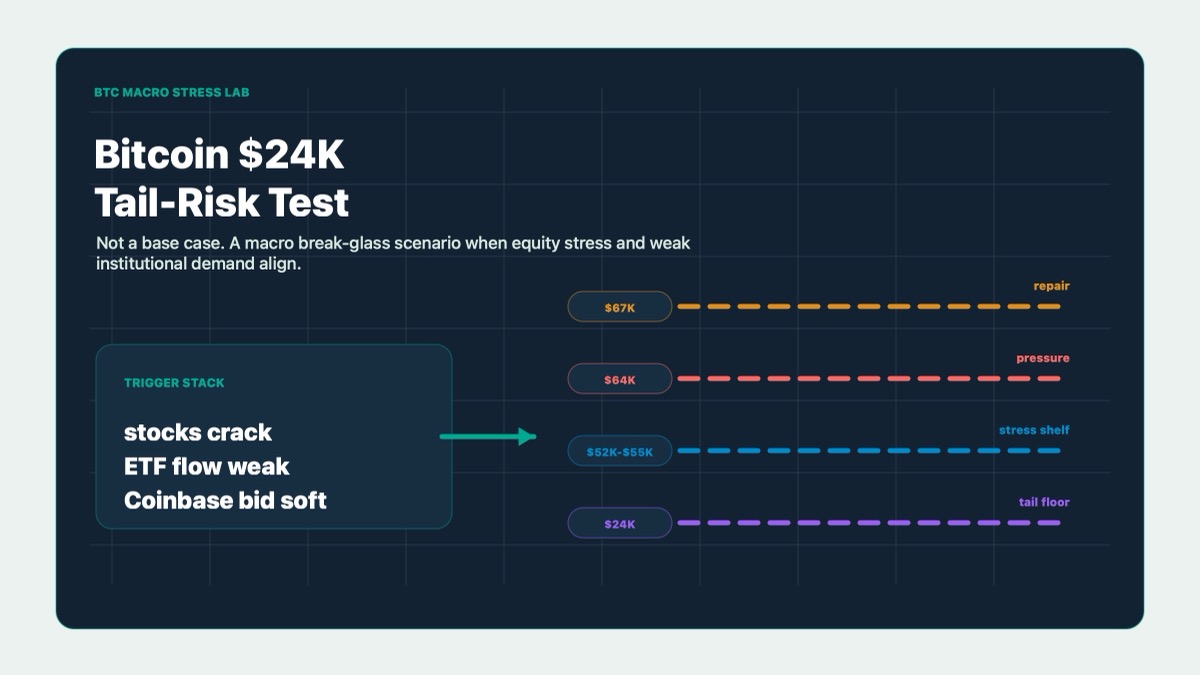
- Technical analyst Jesse Olson warned that Bitcoin could fall toward $23,980 in a severe macro sell-off where US stocks drop more than 50%.
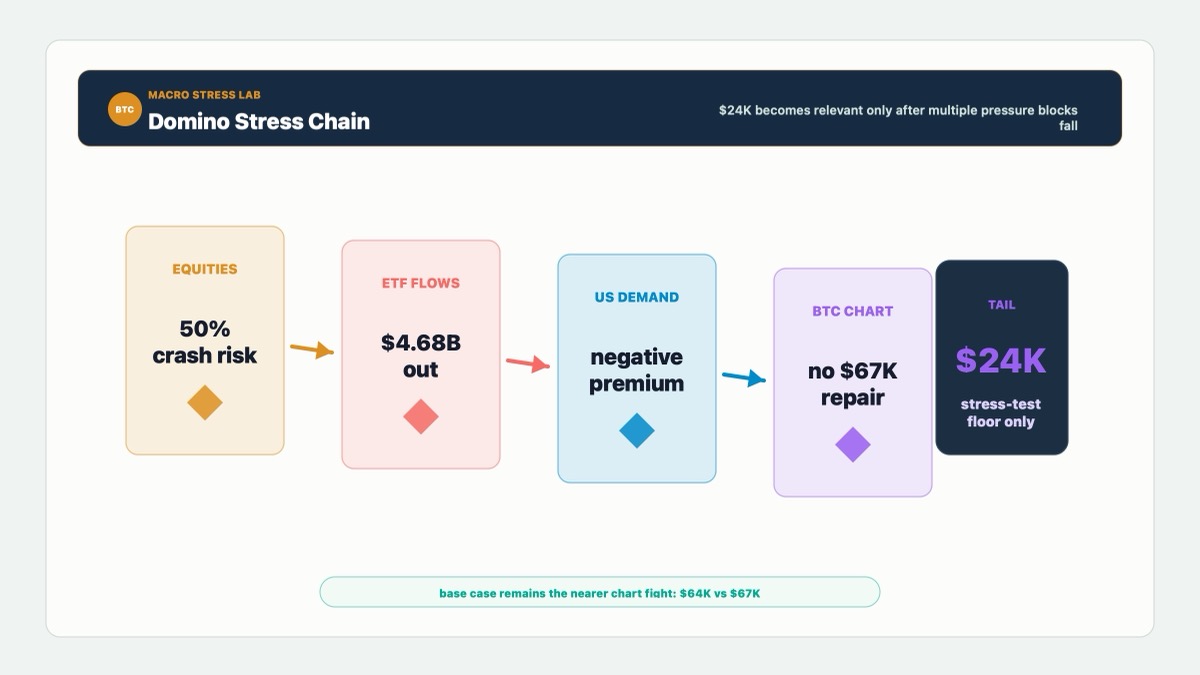
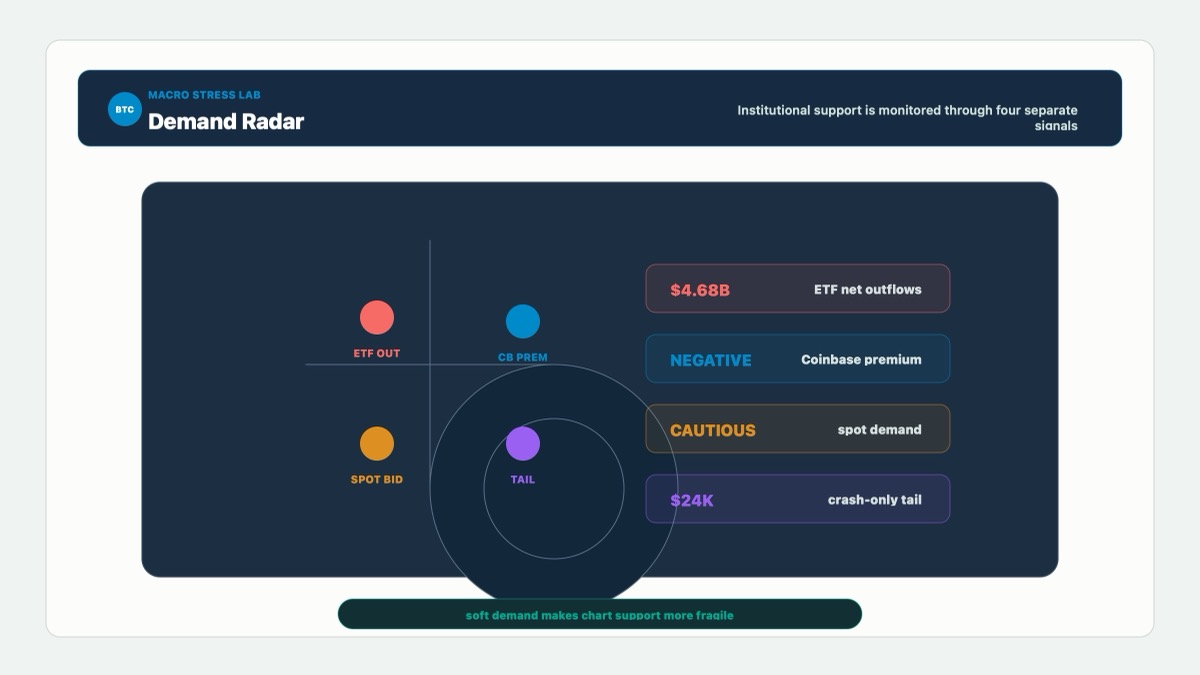
- The warning matters more because institutional demand looks weak: Coinbase premium has stayed mostly negative in 2026, and US spot Bitcoin ETFs have seen about $4.68B in net outflows since May.
- BTC needs to stabilize above the low-$60K area and reclaim the $67K zone; otherwise, deeper stress levels like $52K-$55K become easier for traders to discuss.
What Happened
Bitcoin just received one of those scary chart targets that makes people either panic, laugh or immediately start arguing about whether the analyst is secretly from the future.
The number is $23,980.
According to Cointelegraph, technical analyst Jesse Olson shared a two-week Bitcoin chart showing BTC potentially falling toward $23,980 if the US stock market suffers a major crash of more than 50%. The target was based on a long-term volume-weighted support line from Olson’s proprietary Market Sniper Pro VWAP indicator.
The idea is not that Bitcoin casually wanders to $24K because it is bored. The setup is conditional. Olson framed the level as a worst-case downside area in a severe macro risk-off scenario, where stocks break hard and Bitcoin trades like the high-beta risk asset it often becomes during market stress.
That macro backdrop is not coming out of nowhere. Cointelegraph cited warnings from veteran market observers who see speculative excess in the current US equity market. Jeremy Grantham has called the AI market boom a major speculative bubble, Michael Burry has compared the rally to late-stage dot-com mania, and Gary Shilling has warned that a US recession is almost inevitable by year-end, with stocks at risk of a 20%-30% decline.
The Bitcoin-specific demand picture is also not especially comforting. The Coinbase Premium Index, which measures the price gap between Coinbase and Binance, has remained largely negative so far in 2026. A negative premium usually suggests weaker US institutional buying or heavier selling on Coinbase.
Spot Bitcoin ETFs tell a similar story. Since May, US-based funds have recorded about $4.68 billion in net outflows, according to SoSoValue data cited by Cointelegraph.
So the story is not simply “analyst draws scary line.” It is a layered warning: macro risk is rising, institutional demand looks cautious, and Bitcoin’s chart still has not fully repaired.
Why This Matters for Bitcoin and Crypto Markets
The useful way to think about the $24K target is not as a prediction. It is a stress test.
Predictions pretend the future is a train schedule. Stress tests ask what breaks if conditions get ugly enough. That is a much better frame here.
Bitcoin does not need to fall to $24K for this analysis to matter. The point is that BTC’s downside map changes when institutional demand is weak at the same time macro risk is rising. If ETF buyers were aggressively accumulating, a scary macro chart target would look less threatening. If Coinbase premium were strongly positive, the market could argue that US institutions were absorbing weakness.
But that is not the picture described in the report. ETF outflows suggest professional buyers are not rushing in. Negative Coinbase premium suggests US demand is not leading. And when the marginal institutional bid is soft, Bitcoin becomes more dependent on technical support and broader risk appetite.
That matters for the whole crypto market because Bitcoin is the liquidity anchor. If BTC is struggling because macro investors are de-risking, altcoins usually do not get to live in a separate, cheerful universe. They may bounce harder, but they also tend to break faster when liquidity tightens.
The key distinction is between a normal correction and a forced macro unwind. In a normal correction, Bitcoin can fall, reset leverage, find buyers and rebuild. In a forced macro unwind, investors sell what they can sell, not necessarily what they hate. Bitcoin is liquid. That makes it useful in both rallies and risk reductions.
This is the uncomfortable part: liquidity is a superpower on the way up and a vulnerability on the way down.
For now, the $24K level is still a tail-risk scenario. But the tail gets fatter when ETF flows are negative, Coinbase demand is weak, and stocks look crowded enough that serious investors are talking about bubble risk.
Historical Parallel
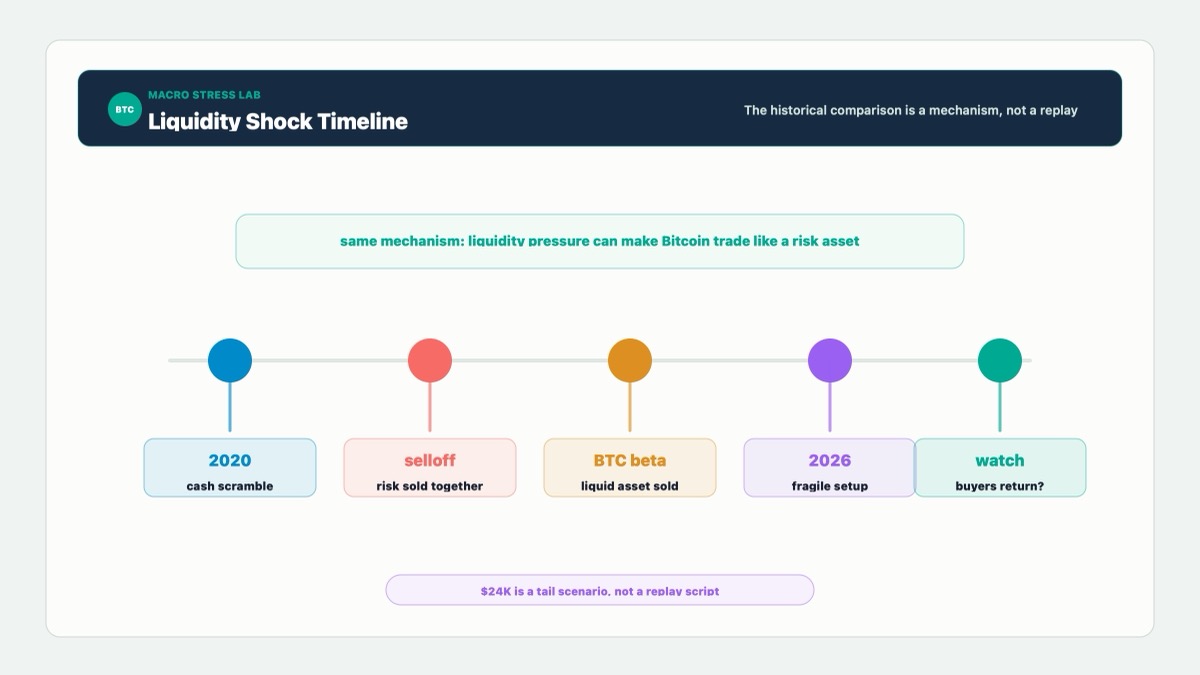
The cleanest historical parallel is March 2020, when the COVID liquidity shock hit global markets and Bitcoin briefly stopped behaving like a separate monetary experiment and started behaving like a liquid risk asset.
The historical event was straightforward in its violence. Stocks fell rapidly, volatility exploded, and investors rushed for cash. Bitcoin sold off hard alongside risk assets, not because its long-term thesis had changed overnight, but because in a liquidity panic, the market often stops asking philosophical questions and starts asking what can be sold quickly.
That is the similarity with the current warning. Olson’s $23,980 target is tied to a severe stock-market crash scenario, not to some isolated Bitcoin-only problem. The mechanism is the same: if equities fall far enough, investors may reduce crypto exposure as part of a broader de-risking wave. Bitcoin can be fundamentally interesting and still get sold when portfolios are being cleaned up under pressure.
The difference is that March 2020 was a sudden exogenous shock, while the current setup is about accumulated macro fragility. Today’s concern is not a single surprise event. It is the possibility that an AI-led equity boom, recession risk, weak ETF flows and cautious US institutional demand all line up at the wrong time.
That difference matters because slow-building risks can look harmless for a long time. Markets can stay expensive, flows can stay soft, and Bitcoin can keep chopping sideways while everyone gets used to the danger. Then, if the trigger arrives, the adjustment feels sudden even though the ingredients were sitting there in plain view.
The lesson for today is not that Bitcoin must replay 2020 or fall to $24K. Markets are not tribute bands. The lesson is that Bitcoin’s downside tail becomes more relevant when macro stress and weak institutional demand appear together. A real recovery would need evidence that buyers are returning before the chart is forced to test lower support.
Bitcoin Price Reaction and K-Line Analysis
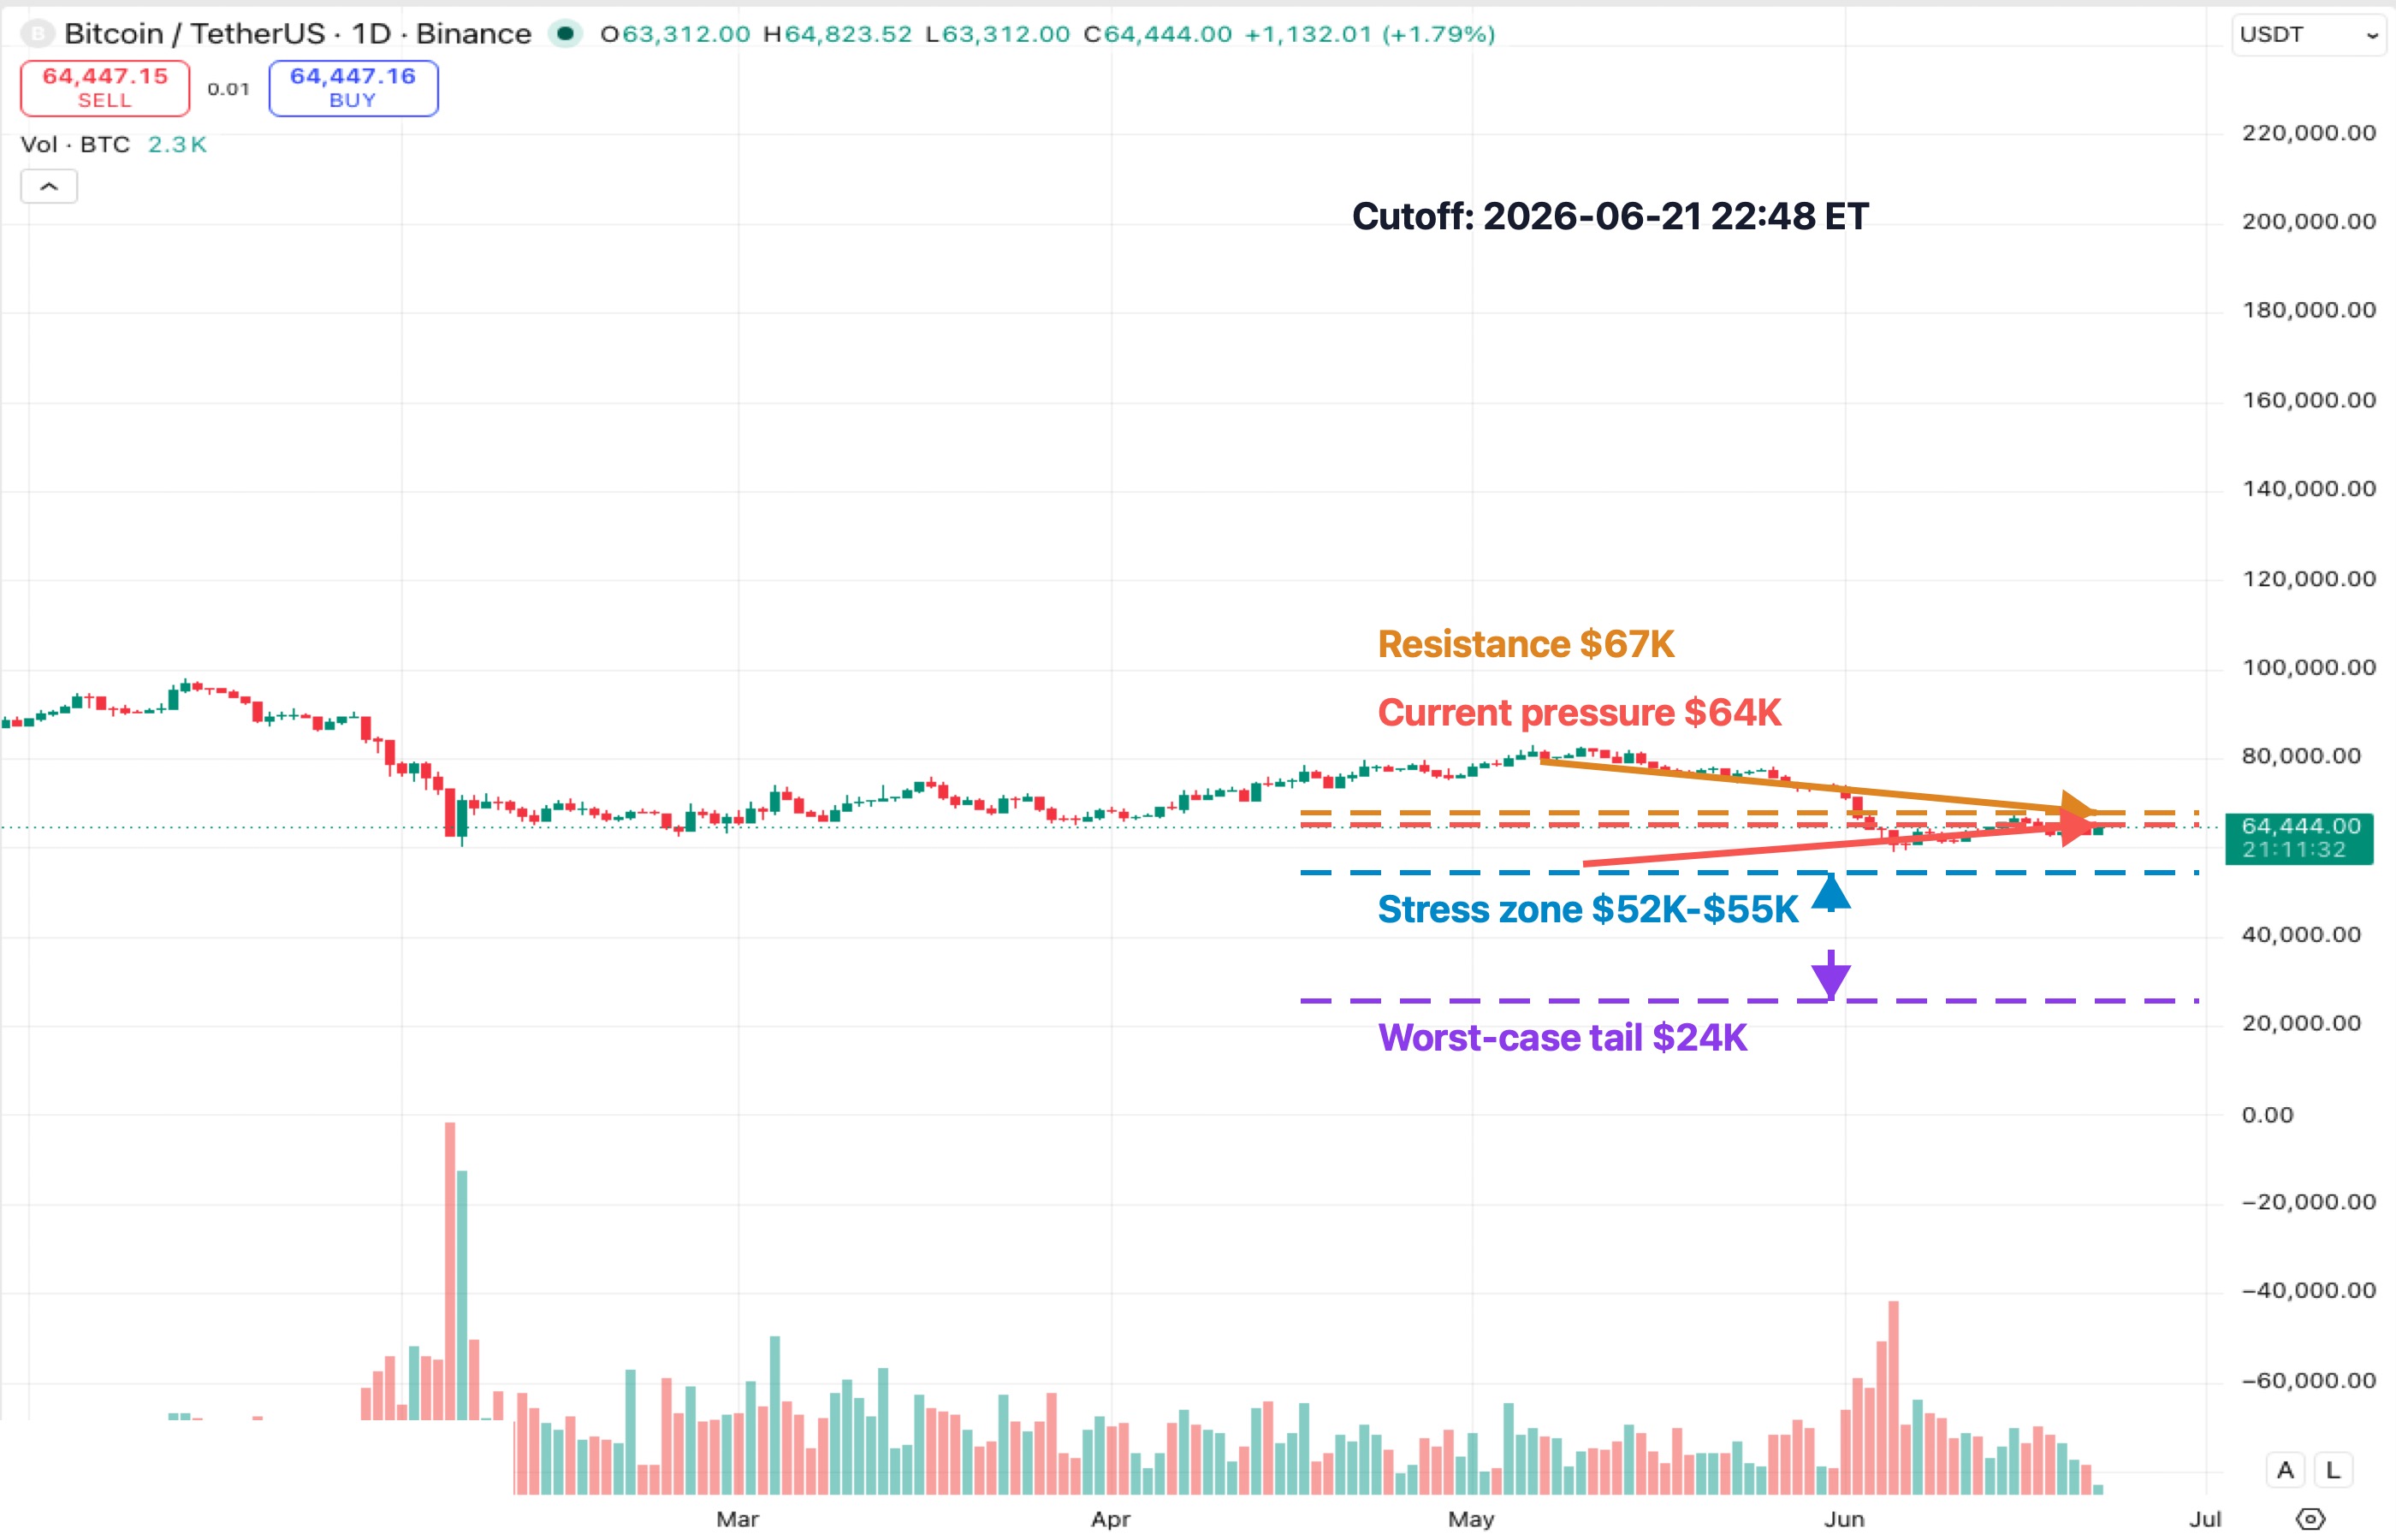
The BTCUSDT daily chart shows the main problem with this market: Bitcoin is not collapsing today, but it is also not cleanly repairing the breakdown.
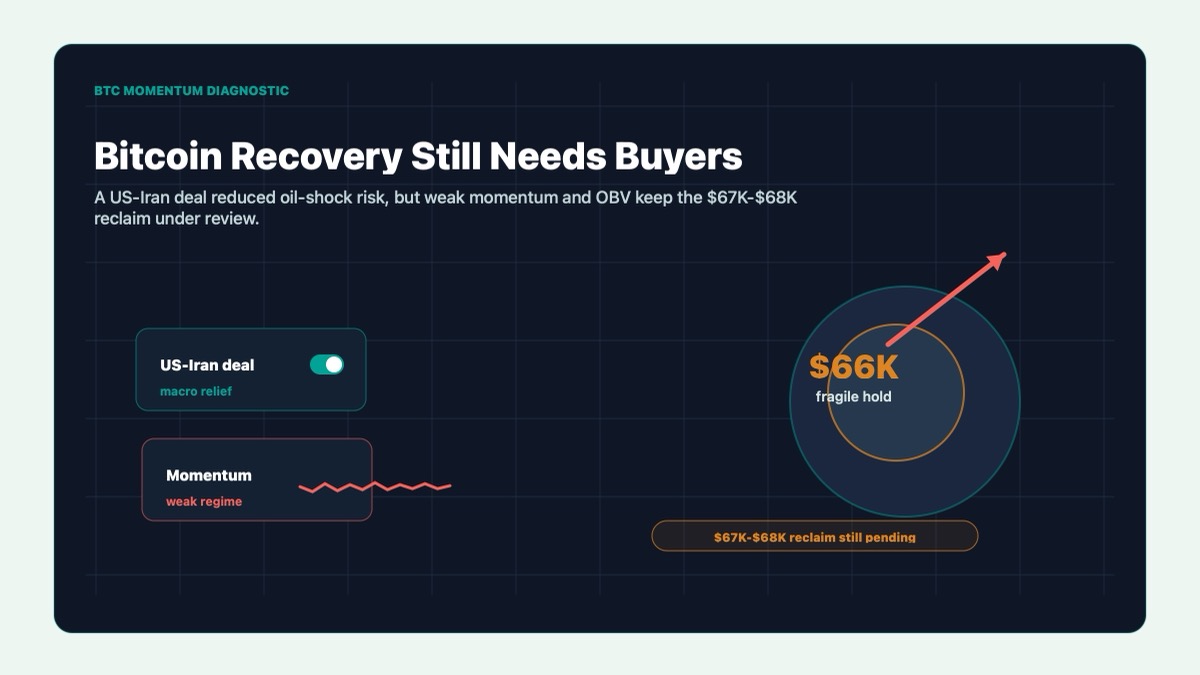
BTC is trading around the mid-$60K area after a sharp decline and a weak rebound. The first level that matters is $67K. A reclaim of that zone would not magically erase macro risk, but it would show that buyers can push price back above the nearest breakdown area.
The current pressure zone is near $64K. That is where Bitcoin is trying to prove that the recent stabilization is more than a pause. If BTC cannot hold near this area, the chart starts pointing back toward the lower stress zone.
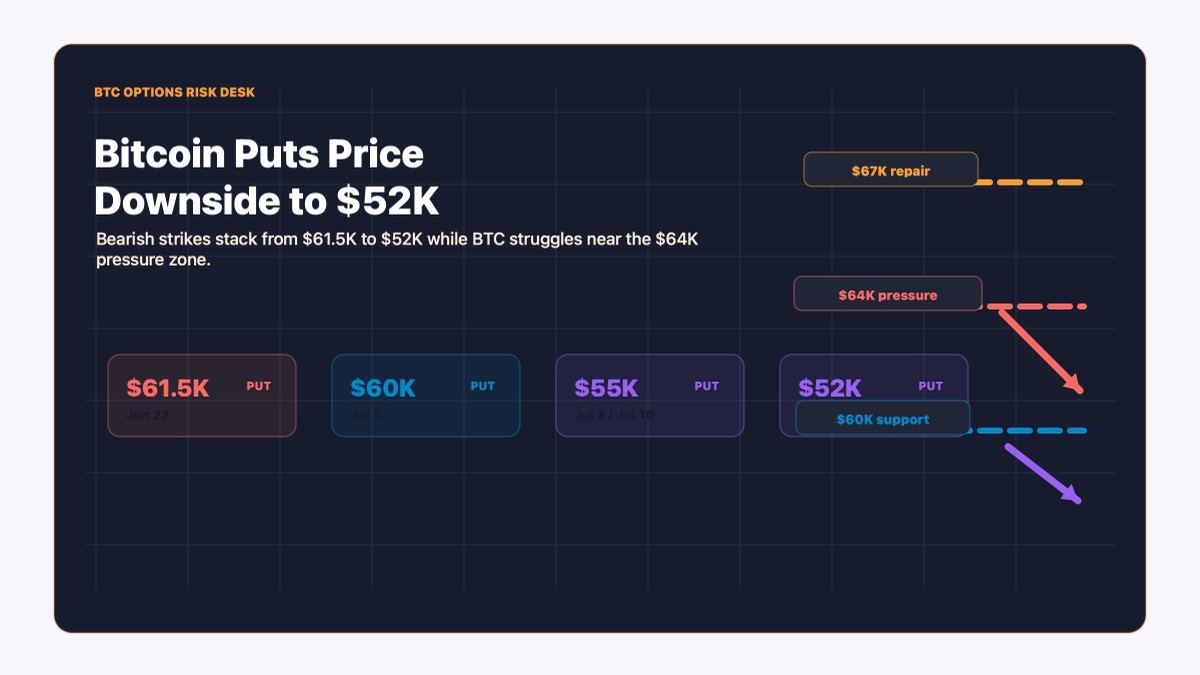
The $52K-$55K region is the first deeper zone that matters if the low-$60K structure fails. It is not the same as Olson’s $23,980 worst-case target. It is the more realistic intermediate stress area where traders would likely begin asking whether the selloff is becoming something larger.
The $24K area is different. That is not a normal support level for the current chart. It is a tail-risk level tied to an extreme stock-market crash scenario. The chart has to be zoomed out aggressively just to place it on the same map as today’s price, which is itself the point. This is not a routine downside target. It is the kind of level that only starts to matter if the entire risk environment breaks.
So the chart gives us two stories. The short-term story is $64K versus $67K. The macro stress story is whether weak institutional demand turns a correction into a much wider liquidation path.
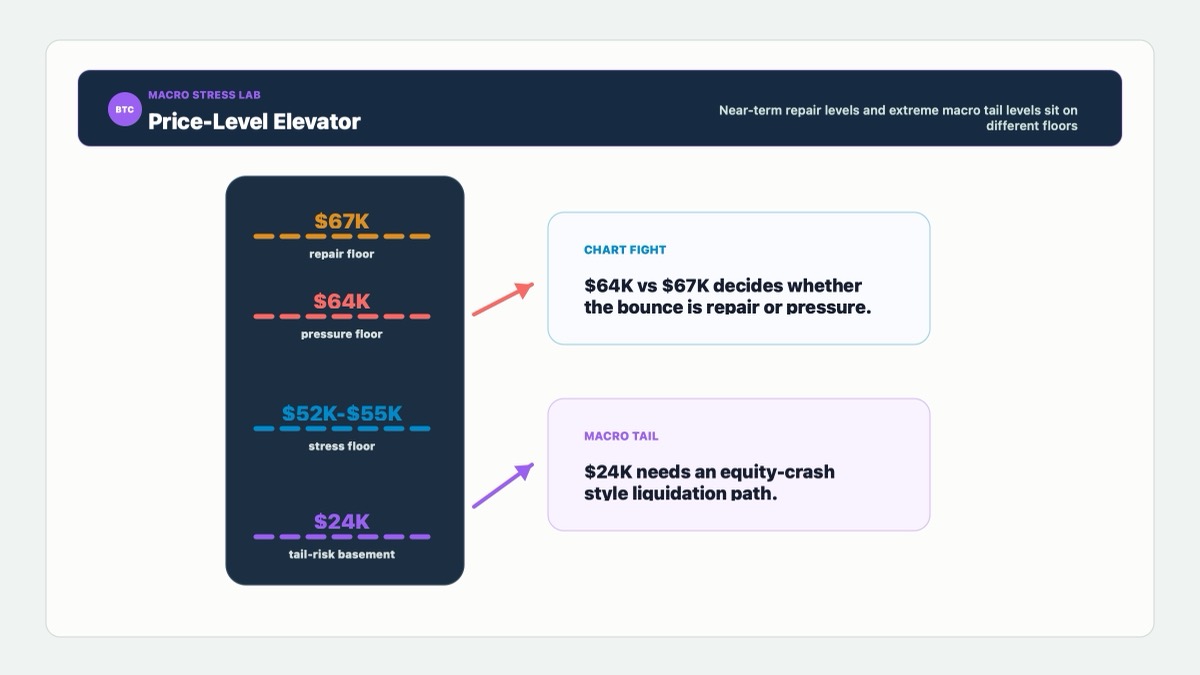
Key Levels to Watch
$67K resistance: BTC needs to reclaim this level to show that buyers are repairing the short-term structure. Without it, rallies can remain suspect.
$64K current pressure: This is the near-term battleground. Holding it keeps the market stable; losing it reopens the lower range.
$52K-$55K stress zone: This is the first deeper downside region to watch if the low-$60K area fails.
$23,980 worst-case tail: This is not a base-case target. It is the macro crash level highlighted by Olson’s long-term volume-weighted support analysis.
Conditional Forecast
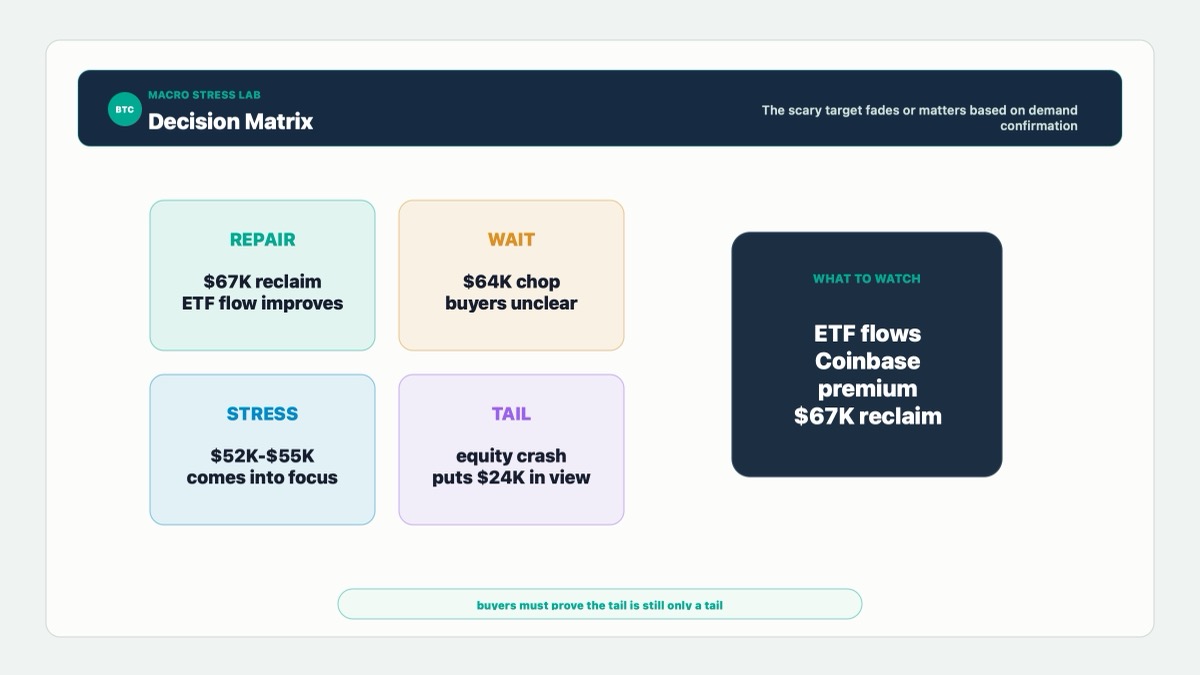
If Bitcoin reclaims $67K and ETF flows begin to stabilize, the $24K scenario stays where it belongs: in the tail-risk drawer. The market would still need work, but the immediate pressure would ease.
If BTC fails near $64K and slides back toward the low-$60K area, traders will likely focus on whether institutional demand appears. A weak Coinbase premium during that test would make the defense less convincing.
If the low-$60K area breaks cleanly, the $52K-$55K zone becomes the next realistic stress area. That is where the market would begin to price a deeper correction rather than a simple pullback.
If US equities suffer a major drawdown while ETF outflows continue, Olson’s $23,980 tail-risk scenario becomes more relevant. Not guaranteed. Relevant.
Investment Takeaway
The investment takeaway is not that Bitcoin is destined for $24K. That would be the loudest possible reading and probably the least useful one.
The better takeaway is that Bitcoin’s downside risk is now more dependent on macro conditions and institutional demand than on the chart alone. A weak Coinbase premium and ETF outflows make support levels more fragile because they suggest the big bid is not charging in with heroic confidence.
For traders, $67K is the repair level and $64K is the pressure point. For investors, ETF flows and US demand matter more than the scary chart number. If those improve, the tail-risk target fades. If they worsen during an equity selloff, the market will start taking lower levels much more seriously.
Bitcoin does not have to break. But it does have to prove that buyers are still there.
Sources
- Cointelegraph: Bitcoin price may hit $24K if US stock market crashes by 50%, analyst warns
- CryptoQuant data cited by Cointelegraph, including the Bitcoin Coinbase Premium Index.
- SoSoValue ETF flow data cited by Cointelegraph, including US spot Bitcoin ETF net outflows since May.
- TradingView: BINANCE:BTCUSDT daily chart
|
DISCLAIMER:
1. All content on this website (including but not limited to articles, data, charts, and analyses) is for general informational purposes only and does not constitute any form of investment advice, trading recommendation, or financial guidance. 2. Cryptocurrencies and digital assets are subject to extreme price volatility and high investment risk; you may lose part or all of your principal. Past performance does not predict future results. 3. The information on this website is based on sources we believe to be reliable, but we do not guarantee its accuracy, completeness, or timeliness. Any investment decisions made based on this website’s information are at your own risk. 4. We strongly recommend that you conduct your own thorough research and consult an independent, licensed financial advisor before making any investment decisions. |
Recommended reading

Latest News