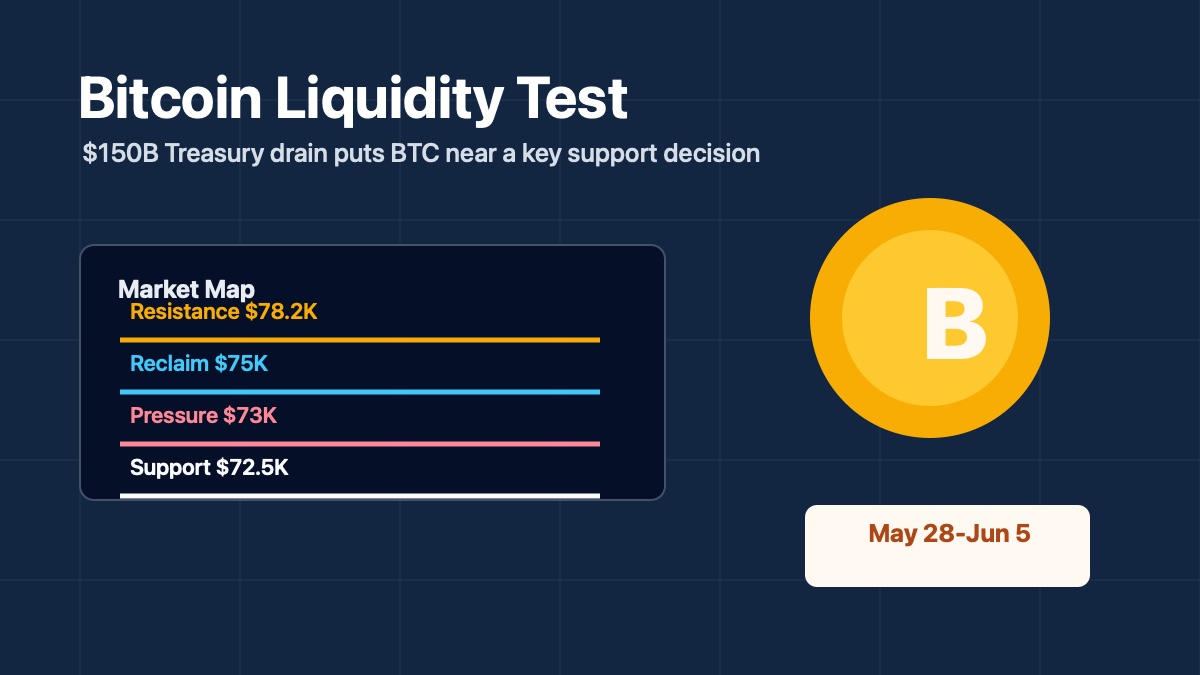
Bitcoin fell near $73,000 as a roughly $150 billion U.S. Treasury settlement window approached, putting BTC into a liquidity test. The key question now is whether Bitcoin can defend the $72,500 to $73,000 support band and reclaim $75,000.
Key Takeaways
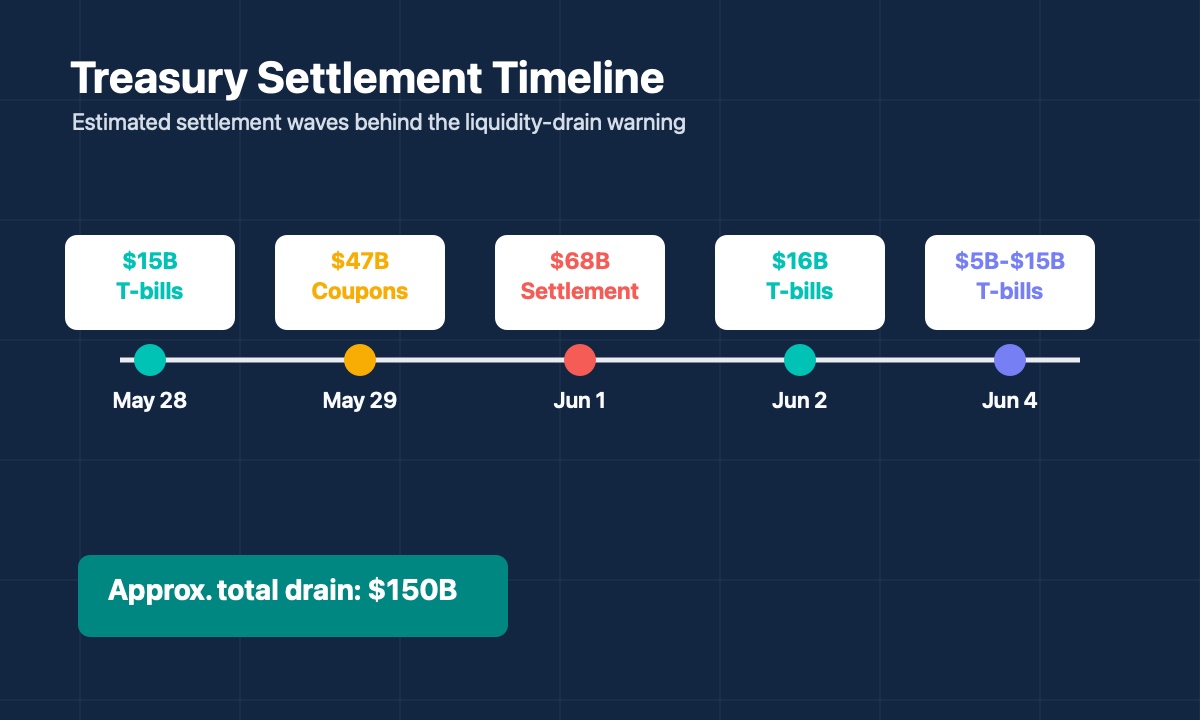
- U.S. Treasury operations from May 28 to June 5 could drain roughly $150 billion in liquidity from the financial system, according to the CoinDesk report citing Michael Kramer.
- BTC had already pulled back from about $82,500 to near $73,000, with the loss of $75,000 turning that level into the first major reclaim zone.
- The key downside area is $72,500 to $73,000; a break below it would strengthen the bearish liquidity-drain narrative, while a reclaim of $75,000 would ease pressure.
- The investment view is conditional: BTC remains vulnerable until support holds and lost levels are reclaimed, with $78,200 as the stronger resistance level.
What Happened
CoinDesk reported that U.S. Treasury operations from May 28 to June 5 could drain roughly $150 billion in liquidity from the financial system. The warning came from Michael Kramer, founder and CEO of Mott Capital Management, who argued that Bitcoin tends to act as a leading liquidity indicator.
The expected settlement schedule was not one giant switch being pulled. It was more like a series of cash vacuum moments:
- $15 billion in T-bills settling on Thursday
- $47 billion in coupon settlements on Friday
- $68 billion on Monday
- $16 billion in T-bill settlements on Tuesday
- Another T-bill settlement on June 4 estimated between $5 billion and $15 billion
BTC had already been weakening before the full settlement window arrived. The article said Bitcoin had fallen from about $82,500 earlier in May and was trading near $73,000 after breaking below the $75,000 area.
When the Treasury issues bills and bonds, investors pay cash for those securities. That cash then moves into the Treasury's account at the Federal Reserve. All else equal, money that was available in the market becomes money parked inside the government's account.
Why This Matters for Bitcoin and Crypto Markets
The lazy version of this story is: Treasury drain bad, Bitcoin down. That version is not useless, but it is too small.
A better model has three parts: the cash pipe, the risk dial, and the Bitcoin gauge. The cash pipe is the Treasury settlement process. When large settlements pull cash into the Treasury General Account or related government accounts, market liquidity can tighten for a period of time.
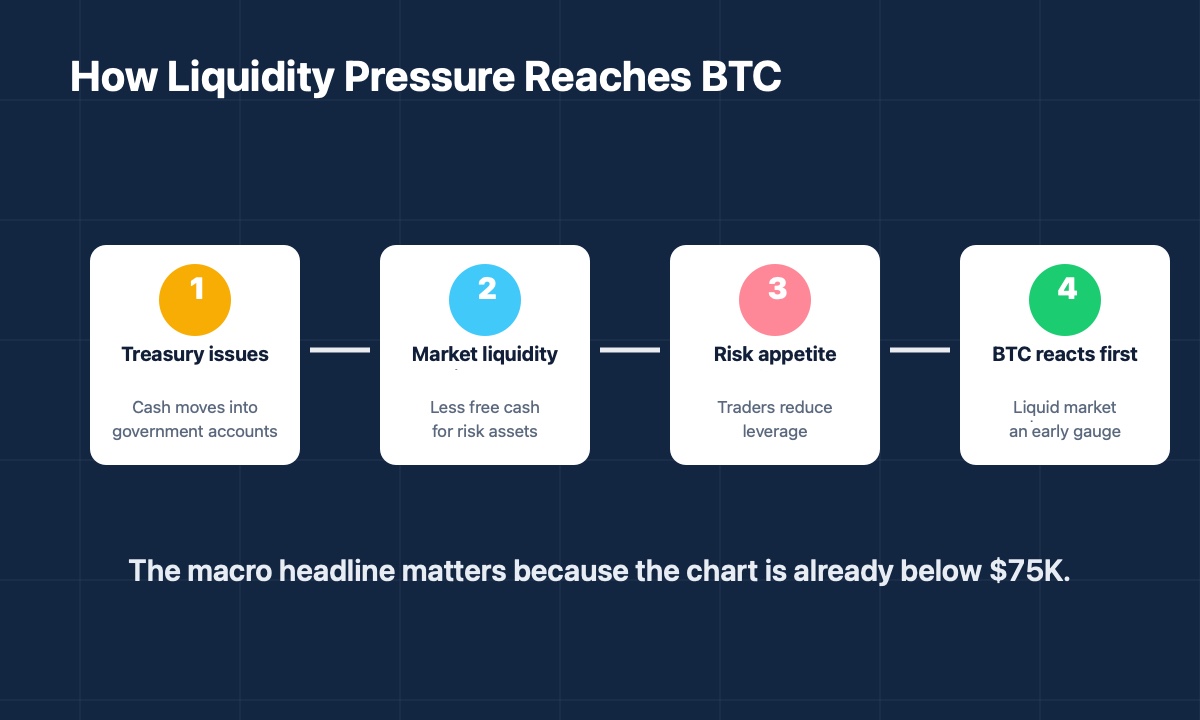
The risk dial is investor behavior. When liquidity is abundant, investors are often more willing to own assets that move fast, trade emotionally, and require patience during drawdowns. When liquidity tightens, those same assets start receiving more suspicious looks across the room.
Bitcoin is the gauge. It trades all day, it is liquid, and it has a large population of traders who react quickly to macro signals. That means BTC can sometimes show stress before slower parts of the market have finished reading the memo.
Bitcoin can be a long-term monetary asset and a short-term liquidity-sensitive risk asset at the same time. That is why Kramer's warning matters: BTC had already lost the $75,000 area and was pressing toward the $72,500 to $73,000 zone.
Historical Parallel: When Liquidity Pressure Hit Bitcoin Before
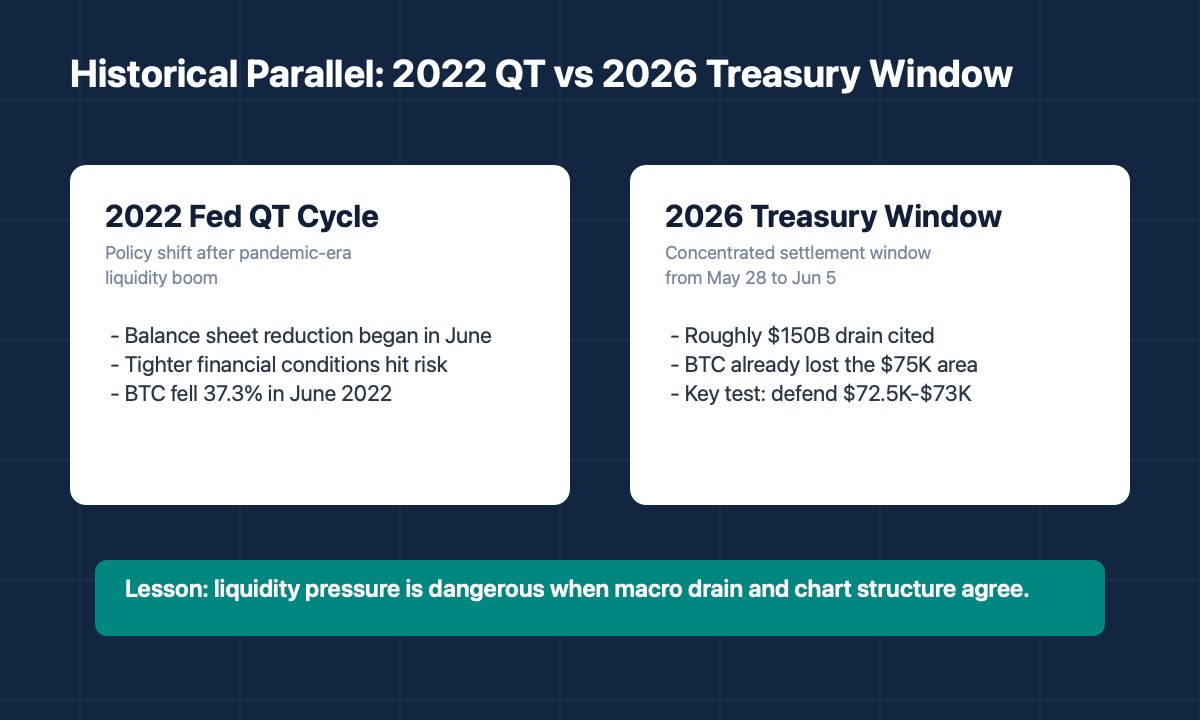
A useful historical parallel is the 2022 Fed quantitative tightening cycle. In June 2022, the Federal Reserve began reducing the size of its balance sheet after the pandemic-era liquidity boom.
Bitcoin did not enjoy that environment. June 2022 became one of BTC's worst months in years, with Fortune reporting a 37.3% monthly drop. The move was not caused by one clean factor. That period also included Fed rate hikes, inflation fear, crypto credit stress, and the Celsius withdrawal freeze.
The similarity to the current setup is the liquidity channel. In both cases, Bitcoin was acting less like a detached monetary object floating above the financial system and more like a fast-moving gauge for market cash, leverage, and risk appetite.
The difference is scale and duration. The 2022 QT cycle was a policy regime shift that lasted far beyond one week. The current Treasury operation is a concentrated settlement window from May 28 to June 5. That makes today's setup more tactical. It can still hurt, but it needs price confirmation.
The lesson is simple: liquidity pressure becomes dangerous for Bitcoin when the macro drain and the chart structure start agreeing with each other. This time, the key question is whether BTC defends $72,500 to $73,000 or starts behaving like the liquidity warning is right.
Bitcoin Price Reaction and K-Line Analysis
The daily chart has a simple message, and it is not especially cheerful. BTC pushed toward the $82,500 area earlier in May, then rolled over. The candles after that did not form a clean bullish reset. They formed a lower-high structure, with price sliding under short-term moving averages and failing to hold the $75,000 area.
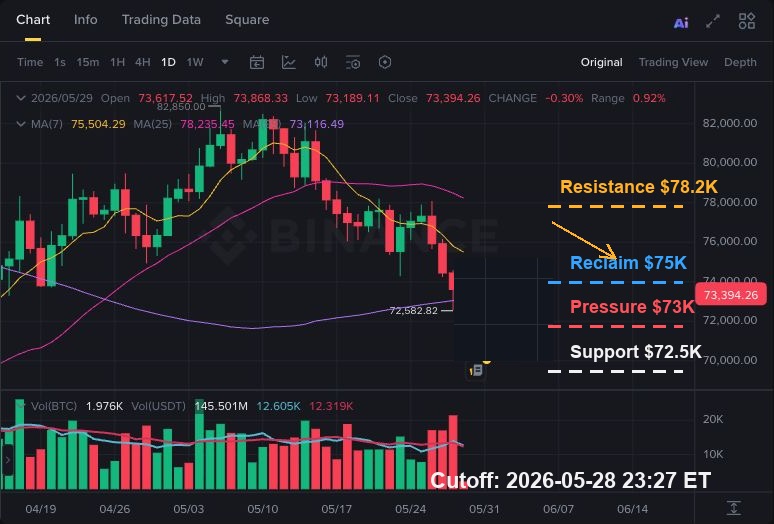
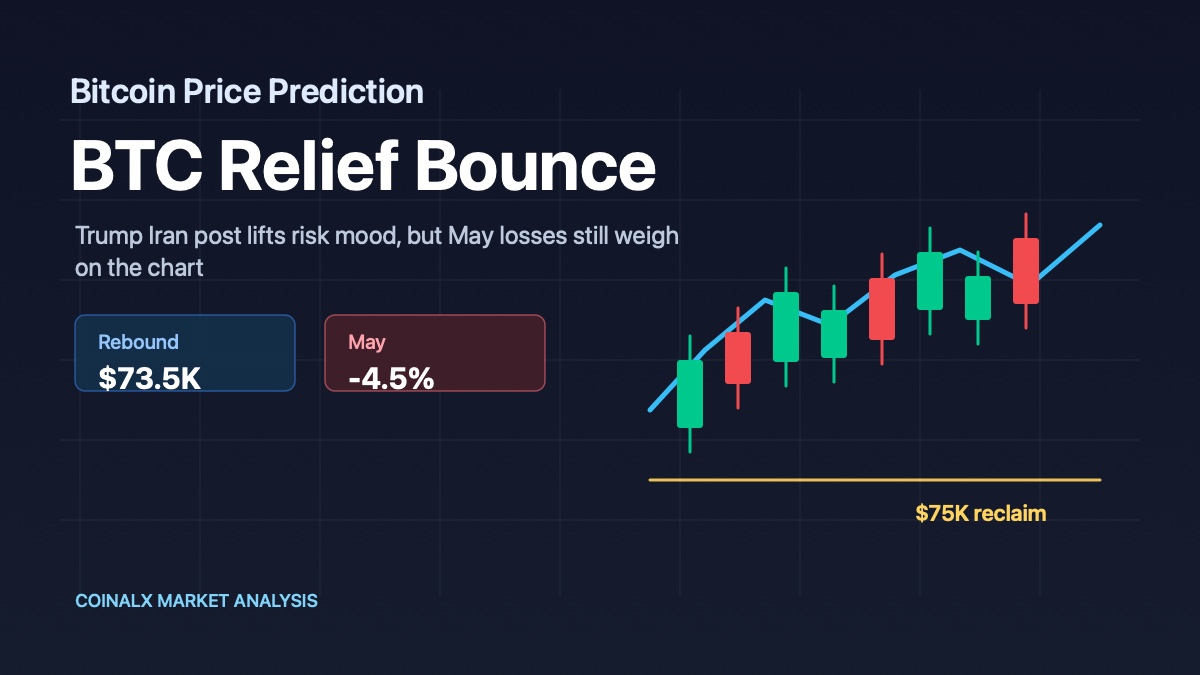
That $75,000 level is now the first big hinge. Before the breakdown, $75,000 was support. After the breakdown, it becomes a test. If BTC can reclaim it and hold it, the market can argue that sellers overreached. If BTC keeps failing below it, the level becomes a ceiling with better branding.
The latest visible low on the chart is $72,582.82, which makes the $72,500 to $73,000 area the immediate support band. This is where the chart either absorbs the liquidity-drain fear or starts confirming it.
The moving averages add to the same message. Shorter-term averages are above price, while BTC is hovering near the longer moving-average zone. Volume matters too: the May 28 drop came with heavier activity as BTC moved into the low-$72,000s.
Key Levels to Watch
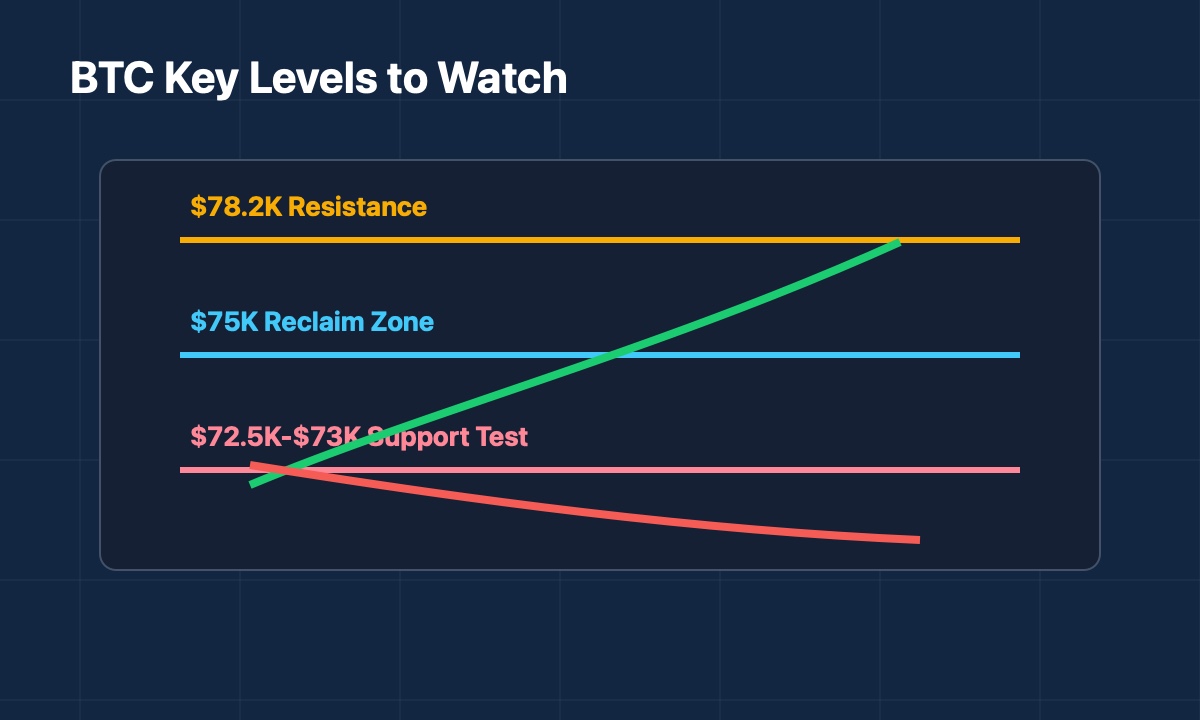
The chart is turning a vague macro fear into specific price tests.
- $72,500 to $73,000 is the support band that keeps the selloff contained.
- $75,000 is the reclaim level that would show the market can absorb pressure.
- $78,200 is the stronger resistance area that would weaken the bearish chart read.
The useful thing about these levels is that they keep the analysis honest. We do not need to pretend to know exactly how every Treasury settlement will hit every trading desk. We can watch whether BTC holds the floor, reclaims the middle, or breaks into a heavier range.
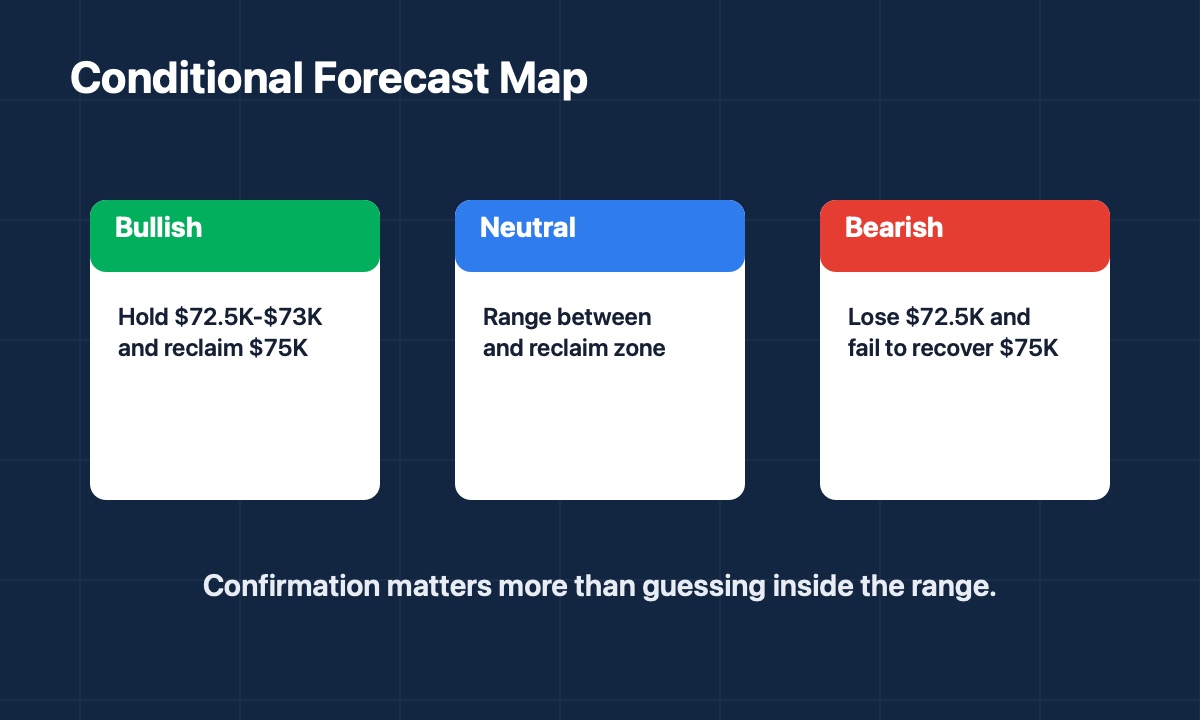
Conditional Forecast
Bullish Scenario
If BTC holds $72,500 to $73,000 and reclaims $75,000 with stronger volume, the market may start treating the Treasury liquidity drain as a short-term stress test rather than the beginning of a deeper repricing.
Neutral Scenario
If BTC stays between $72,500 and $75,000, the news remains important but not decisive. The range break matters more than the opinion inside the range.
Bearish Scenario
If BTC loses $72,500 on a daily closing basis and then fails to recover the $73,000 to $75,000 zone, the market may interpret the Treasury operation as part of a broader liquidity-tightening setup.
Investment Takeaway
The point is not that a Treasury settlement schedule has doomed Bitcoin. The point is that Bitcoin is sitting at a liquidity test with clearly visible levels. The macro news gives investors a reason to pay attention, while the K-line chart gives them the scoreboard.
For now, BTC needs to defend $72,500 to $73,000 and reclaim $75,000 before the short-term structure improves. Until that happens, the market remains vulnerable to another wave of risk-off pressure. Above $78,200, the story changes. Below $72,500, it gets heavier.
Sources
|
DISCLAIMER:
1. All content on this website (including but not limited to articles, data, charts, and analyses) is for general informational purposes only and does not constitute any form of investment advice, trading recommendation, or financial guidance. 2. Cryptocurrencies and digital assets are subject to extreme price volatility and high investment risk; you may lose part or all of your principal. Past performance does not predict future results. 3. The information on this website is based on sources we believe to be reliable, but we do not guarantee its accuracy, completeness, or timeliness. Any investment decisions made based on this website’s information are at your own risk. 4. We strongly recommend that you conduct your own thorough research and consult an independent, licensed financial advisor before making any investment decisions. |