Bitcoin Price Prediction: Roubini Partner Sees 70% BTC Crash Before $500K
Key Takeaways
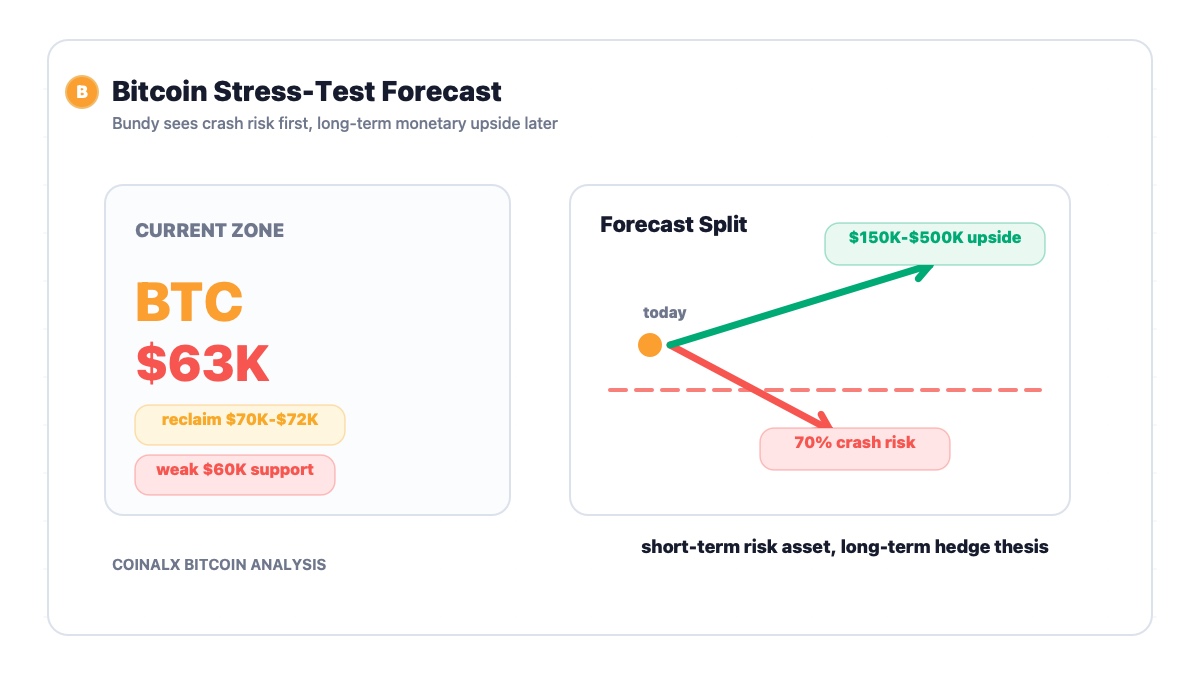
- Atlas Capital CEO Reza Bundy warned Bitcoin could fall as much as 70% within six months if equities enter a major correction.
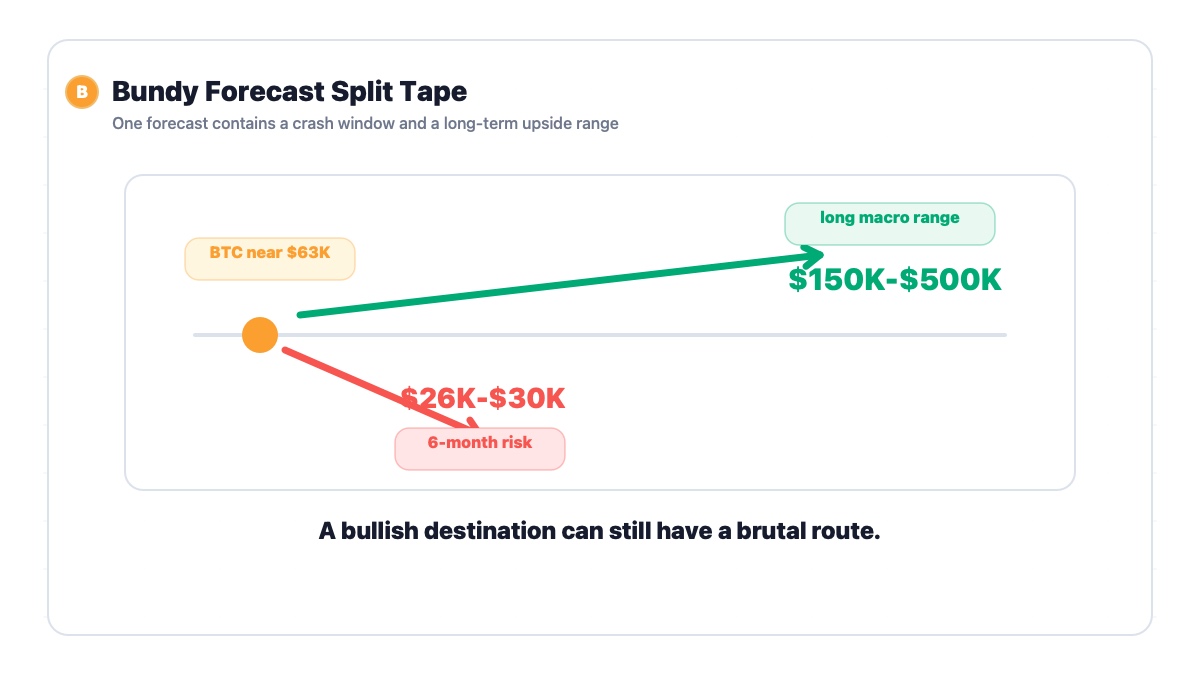
- Bundy's short-term downside target is roughly $26,000-$30,000, but his long-term Bitcoin forecast still reaches $150,000-$500,000.
- The forecast treats BTC as a volatile risk asset in the short run and a potential store-of-value asset in the long run.
- BTC now needs to reclaim $70,000-$72,000 to weaken the bearish chart setup; failure keeps the low-$60,000 area under pressure.
What Happened
Reza Bundy just offered the kind of Bitcoin forecast that makes both bulls and bears briefly wonder whether they are being insulted.
According to CoinDesk, the Atlas Capital CEO and business partner of economist Nouriel Roubini said Bitcoin could suffer a drawdown of as much as 70% within the next six months. Bundy gave a downside zone of roughly $26,000-$30,000, especially if equities suffer a major correction.
That is the scary half.
The other half is that Bundy is not a long-term Bitcoin bear. He also said BTC could eventually reach a range of $150,000-$500,000, depending on the macro path the world takes. So the forecast is not "Bitcoin is dead." It is more like: Bitcoin may get thrown down the stairs before being invited to the monetary future. Not a relaxing itinerary.
The timing makes the warning sharper. CoinDesk reported that Bitcoin was trading around $63,000, down nearly 28% on the year, while equity markets had been much stronger: the S&P 500 was up about 10%, and the Nasdaq had climbed around 19%, helped by AI enthusiasm and momentum chasing.
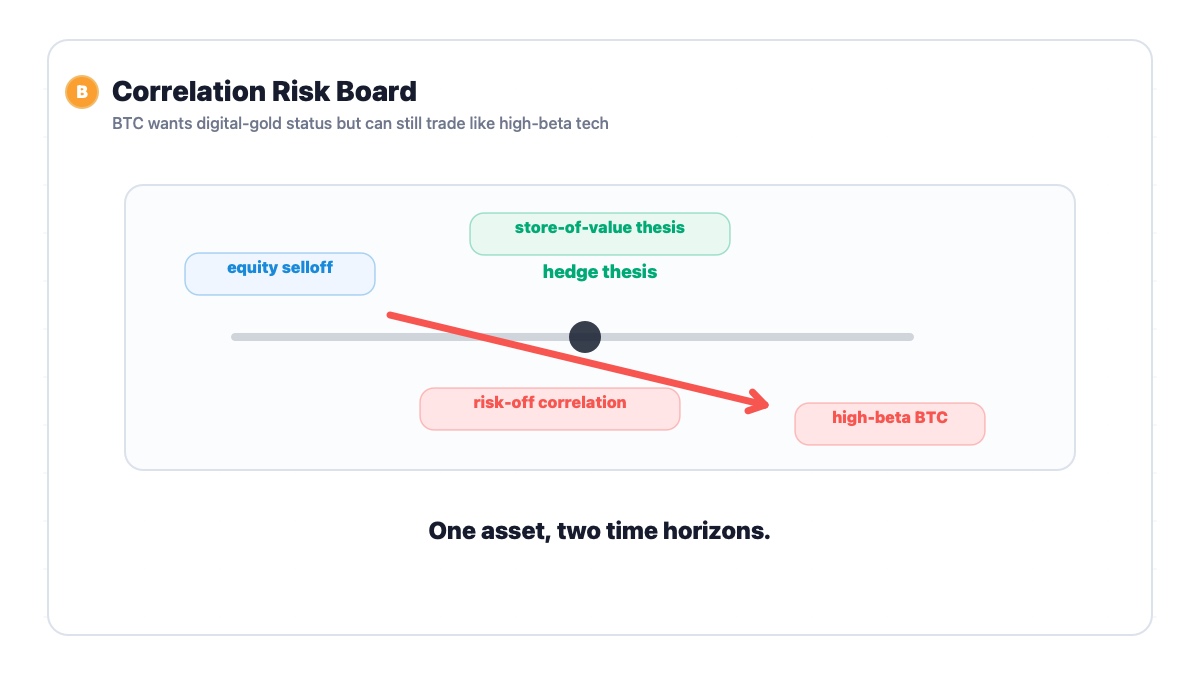
Bundy's short-term bearish case is built on the idea that Bitcoin has stopped behaving like a clean inflation hedge and is instead trading like a high-beta technology asset. If stocks drop hard, he argues, BTC could drop harder.
His long-term bullish case is different. Bundy still believes Bitcoin's original store-of-value thesis can reassert itself in a world of rising government debt, central bank money printing and falling trust in traditional currencies. That is the tension inside the forecast: BTC as risk asset today, BTC as monetary escape hatch later.
Why This Matters for Bitcoin and Crypto Markets
This matters because it names the problem Bitcoin keeps running into.
Bitcoin wants to be treated like digital gold. But in many market panics, it still trades like a risk asset with a dramatic personality. That gap between what Bitcoin is supposed to be and how it behaves under stress is where arguments like Bundy's become powerful.
If equities keep rising, Bitcoin can recover simply because liquidity and risk appetite improve. But if AI-led equity strength cracks, Bundy's framework says BTC would not be spared. It would be dragged into the same selloff, then potentially punished more severely because crypto liquidity is thinner and leverage moves faster.
That is the short-term risk.
The long-term point is almost the opposite. Bundy is not saying Bitcoin has no future. He is saying the future may arrive after a violent repricing. His four macro paths give that forecast a structure: controlled growth could push BTC to $150,000-$250,000; fiscal dominance and money printing could push it toward $250,000-$500,000; global conflict could first create panic and then reinforce Bitcoin's neutrality thesis; deflationary recession could keep BTC weak until central banks return with liquidity.
This is a useful model because it separates two questions traders often mash together:
Is Bitcoin useful in the long run?
Can Bitcoin still crash brutally in the short run?
The answer can be yes to both. Markets are rude like that.
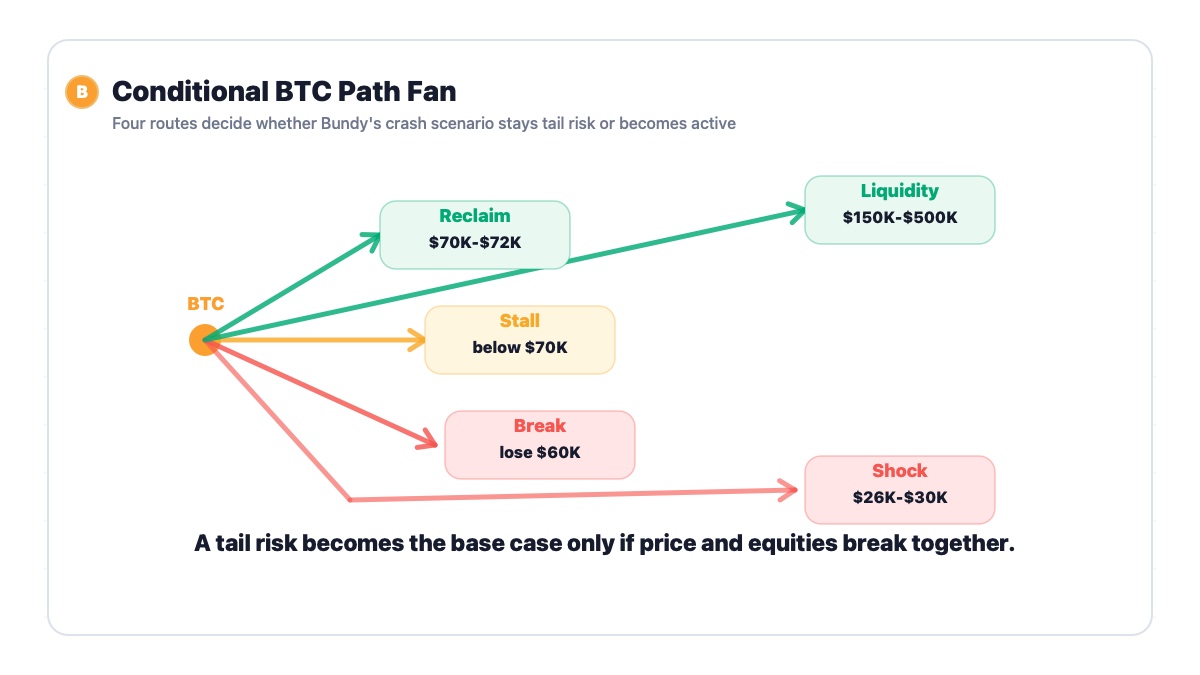
For crypto markets, the implication is clear. If BTC loses the low-$60,000 area and equity weakness accelerates, altcoins would likely absorb even more pressure. If BTC stabilizes and reclaims $70,000-$72,000, the market can start treating Bundy's crash scenario as a tail risk rather than the base case.
Historical Parallel: March 2020's Liquidity Shock
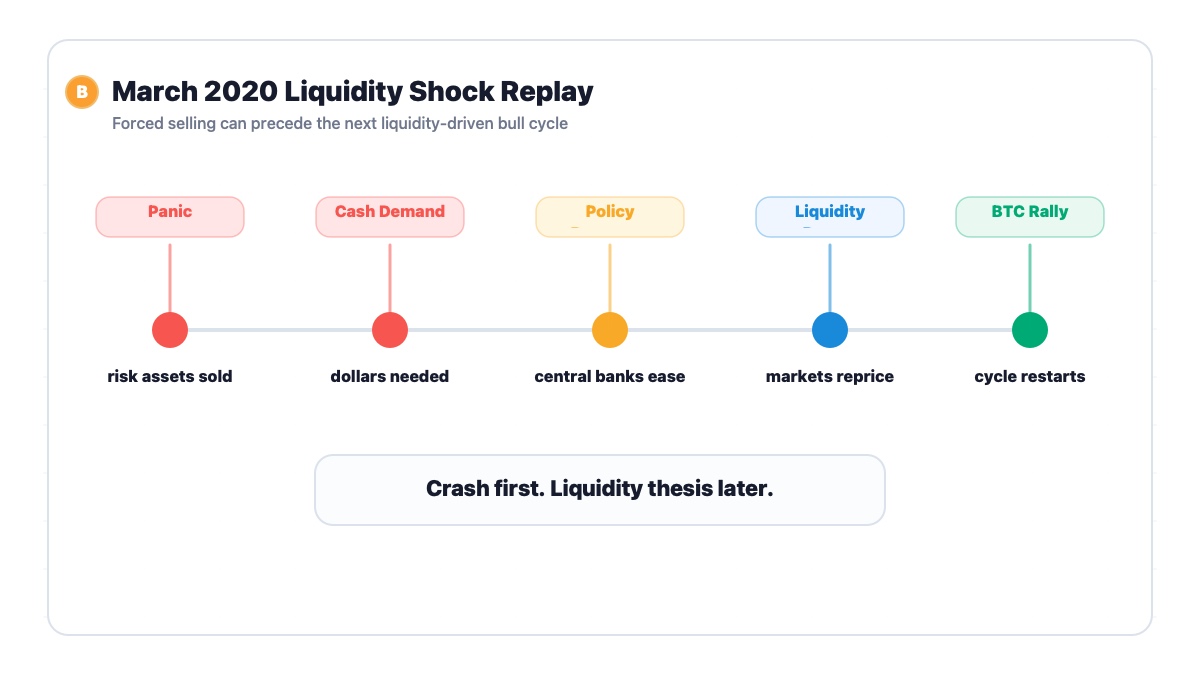
The closest historical parallel is March 2020, when Bitcoin fell sharply during the global COVID-era liquidity shock before later entering one of its strongest bull markets. That episode is useful because it shows both sides of Bundy's thesis: Bitcoin can sell off like a risk asset during forced deleveraging, and still later rally when liquidity returns and monetary trust weakens.
In March 2020, BTC dropped alongside equities as investors sold almost anything liquid. The market was not calmly debating Bitcoin's fixed supply or long-term monetary design. It was raising cash. That is the brutal part of liquidity crises: good assets, bad assets and interesting assets can all get sold because someone needs dollars now.
The similarity to Bundy's warning is the correlation risk. He argues that if equities suffer even a partial repeat of a crisis-style drawdown, Bitcoin could fall harder because it currently behaves more like a volatile tech-linked risk asset than a defensive hedge. March 2020 supports that possibility. In a panic, Bitcoin's philosophical brochure does not always stop the red candles.
The difference is starting point and structure. March 2020 was an acute shock followed by massive policy intervention. Bundy's 2026 warning is framed around equity overvaluation, AI momentum, macro fragility and a possible recession-style correction. That means the selloff he imagines may be slower, more tied to equity repricing, and more dependent on whether central banks respond quickly.
The lesson is conditional. If Bitcoin breaks down with equities and liquidity vanishes, a deep move toward much lower levels cannot be dismissed just because BTC has a strong long-term narrative. But if policy support returns and investors start pricing fiscal dominance or money debasement again, the same selloff could become the setup for the next major upside cycle.
Bitcoin Price Reaction and K-Line Analysis
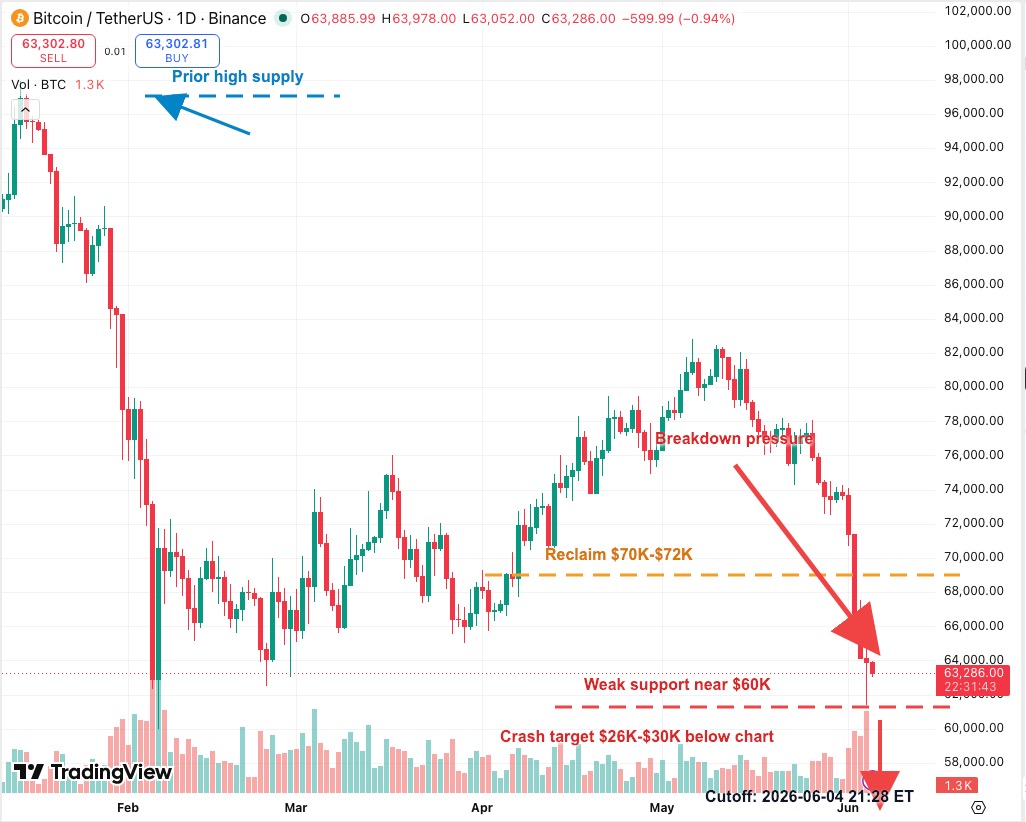
The BTCUSDT daily chart shows why Bundy's warning lands at an awkward moment.
Bitcoin has already fallen sharply from the prior high-supply area near the upper part of the chart, then staged a May recovery that failed below the earlier highs. The latest move pushed BTC down toward the $63,000 area, with a clear acceleration into early June.
That is not a chart begging for heroic confidence. It is a chart asking buyers to show up before the room gets weird.
The first repair zone is $70,000-$72,000. BTC needs to reclaim that area to show that the current breakdown is being absorbed. A weak bounce that fails below it would keep sellers in control and make the low-$60,000 region vulnerable.
The next important area is around $60,000. This is the visible support zone on the chart and the place where buyers need to prove the market is not simply stair-stepping lower. If $60,000 fails cleanly, the chart has room to test lower liquidity zones.
Bundy's $26,000-$30,000 target is far below the current chart window, which is why it is marked as a projected crash zone below the visible price axis rather than drawn as a fake on-chart support. That target would require a much larger macro shock, likely involving equity weakness, liquidity stress and a broad risk-off move. It is not a normal technical target from this chart alone.
Key Levels to Watch
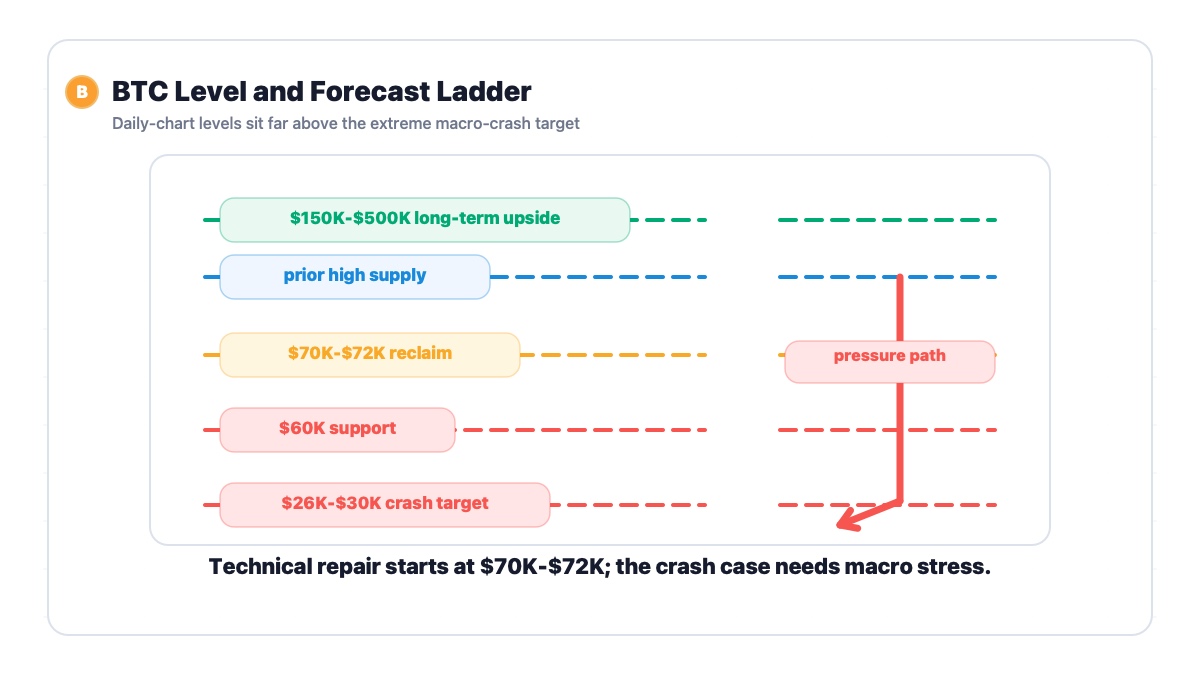
The immediate pressure zone is $63,000-$64,000. BTC is trading near this area, and failure to stabilize here keeps short-term downside pressure alive.
The visible support zone is around $60,000. Losing it would make the market more receptive to deeper crash scenarios.
The first reclaim zone is $70,000-$72,000. BTC needs to recover this range before the chart deserves a less defensive reading.
The extreme downside scenario is $26,000-$30,000. That is Bundy's macro-crash target, not a simple daily-chart support level.
The long-term upside forecast range is $150,000-$500,000. That range depends on macro scenarios such as controlled growth, fiscal dominance, conflict or renewed liquidity after recession.
Conditional Forecast
If BTC stabilizes above $60,000 and reclaims $70,000-$72,000, Bundy's 70% crash scenario remains a risk case rather than the active market path. The chart would still need repair, but the immediate breakdown pressure would ease.
If BTC loses $60,000 while equities weaken, the bearish setup becomes much more serious. In that case, traders may start pricing a deeper macro-driven drawdown rather than a routine crypto correction.
If equities suffer a major drawdown and BTC behaves like high-beta tech, Bundy's $26,000-$30,000 target becomes more plausible. It would still be an extreme scenario, but not an incoherent one.
If central banks respond to recession or market stress with liquidity, the long-term bull case can return quickly. That is the strange duality here: the same crash that hurts BTC first could create the policy conditions that help BTC later.
Investment Takeaway
The useful part of Bundy's forecast is not the shock value. It is the split personality model.
In the short term, Bitcoin may behave like a fragile risk asset tied to equities, AI momentum and liquidity. In the long term, it may still benefit from debt, money printing and declining trust in fiat systems. Those are not contradictions. They are different time horizons wearing the same ticker.
For traders, the chart says stay defensive below $70,000-$72,000 and especially cautious if $60,000 fails. For long-term investors, the question is whether they can survive the version of Bitcoin that trades like a tech crash before reaching the version that trades like a monetary hedge.
That is the uncomfortable part of Bitcoin: sometimes the thesis is right and the timing is still rude.
Sources
- CoinDesk: 'Dr. Doom'-backed Atlas Capital CEO says bitcoin could crash 70% before reaching $500,000
- TradingView: BTCUSDT chart, Binance
- Bloomberg: Nouriel Roubini market commentary
- Nasdaq: USAF ETF listing reference
|
DISCLAIMER:
1. All content on this website (including but not limited to articles, data, charts, and analyses) is for general informational purposes only and does not constitute any form of investment advice, trading recommendation, or financial guidance. 2. Cryptocurrencies and digital assets are subject to extreme price volatility and high investment risk; you may lose part or all of your principal. Past performance does not predict future results. 3. The information on this website is based on sources we believe to be reliable, but we do not guarantee its accuracy, completeness, or timeliness. Any investment decisions made based on this website’s information are at your own risk. 4. We strongly recommend that you conduct your own thorough research and consult an independent, licensed financial advisor before making any investment decisions. |