Bitcoin Price Prediction: BTC Falls Below $63K as Iran-Israel Risk Hits Markets
Key Takeaways
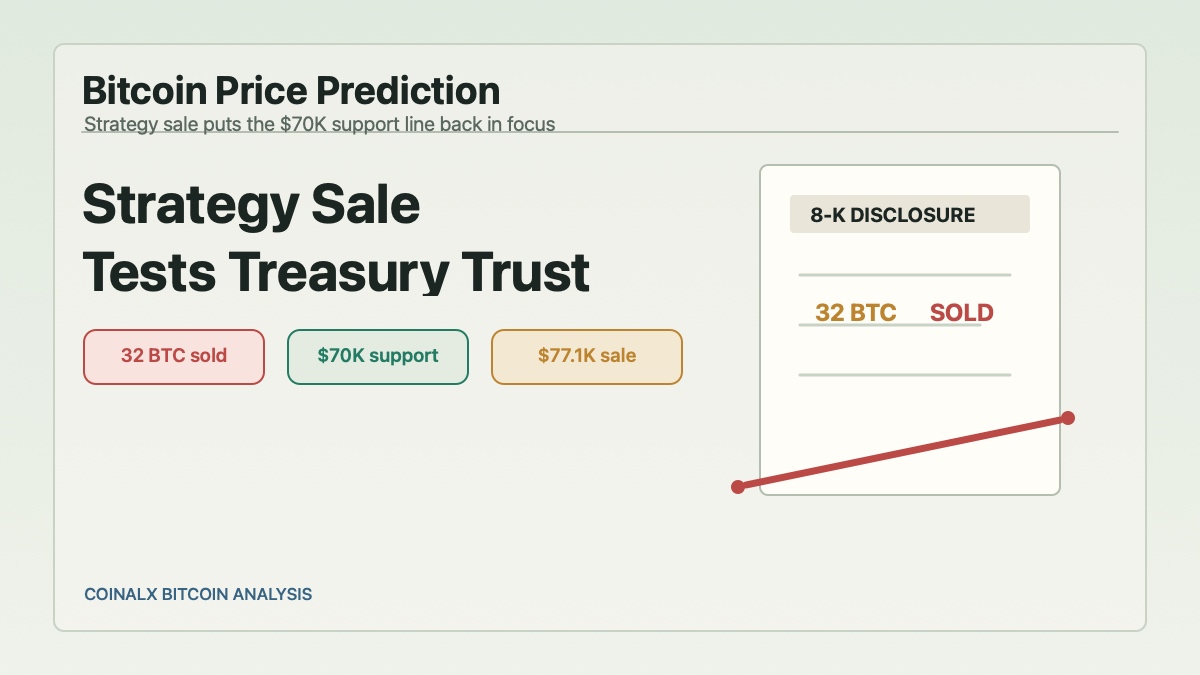
- Bitcoin slipped back toward $62,900 after Iran and Israel exchanged strikes, ending a fragile pause in energy-market tension.
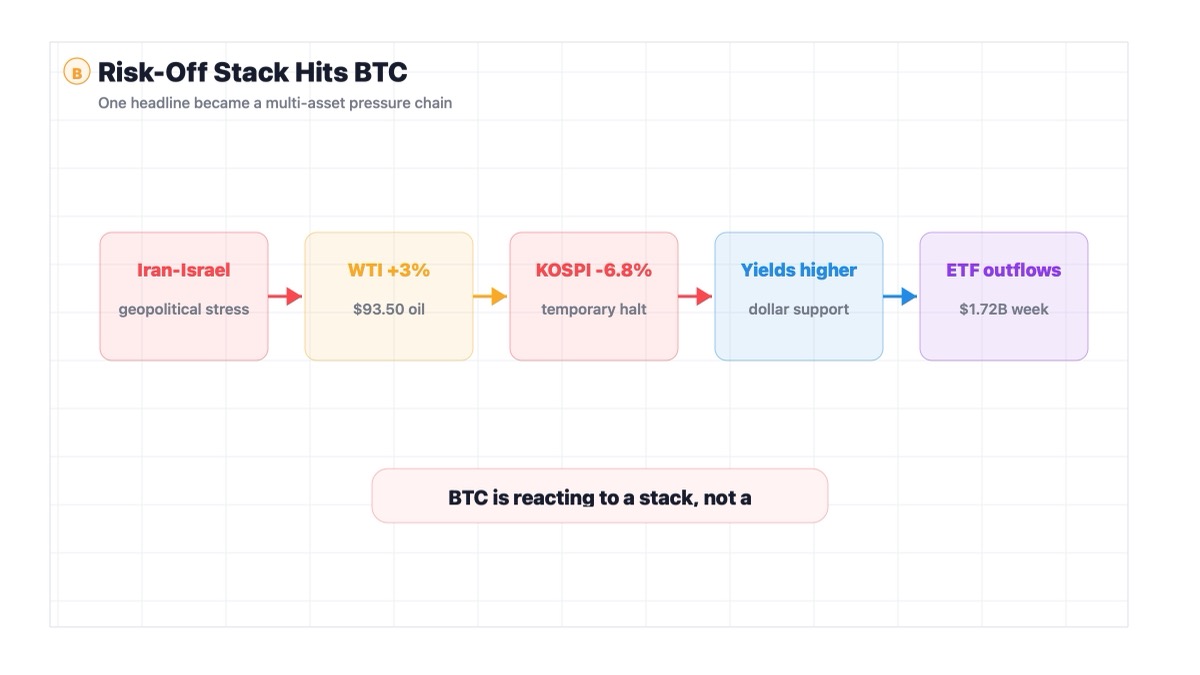
- WTI crude rose more than 3% to $93.50, while South Korea's KOSPI fell over 6.8% and triggered a temporary trading halt.
- Higher oil prices, rising Treasury yields and spot Bitcoin ETF outflows are combining into a rough macro setup for BTC.
- BTC needs to reclaim $63,000-$64,000 first, then $70,000-$72,000, or the $60,000 support zone stays exposed.
What Happened
Bitcoin had a small overnight recovery. Then the macro world walked in and kicked the chair.
According to CoinDesk, BTC pulled back from a Sunday high of $63,776 and traded near $62,900 around 4:00 UTC after renewed military conflict between Iran and Israel rattled global markets. The move came as WTI crude oil futures jumped more than 3% to $93.50 and Asian equity markets sold off hard.
South Korea's KOSPI fell more than 6.8%, triggering a temporary trade halt in volatile conditions. Japan's Nikkei dropped more than 3%. President Donald Trump urged restraint and said he had asked Israeli Prime Minister Benjamin Netanyahu not to retaliate further, but markets were already doing what markets do when geopolitics, oil and uncertainty arrive together: reducing risk.
That is the first layer.
The second layer is yields. CoinDesk noted that the oil-price spike could add to upward pressure on U.S. Treasury yields, which had already surged after a strong U.S. jobs report. Higher yields tend to boost demand for the dollar and dollar-like assets, while making high-beta assets such as crypto less attractive.
The third layer is crypto's own weakened structure. Bitcoin had already dropped nearly 14% last week and briefly pierced the $60,000 level. CoinDesk also reported that U.S. spot Bitcoin ETFs saw $1.72 billion in net outflows last week, the largest weekly redemption in over a year.
So BTC is not just reacting to one headline. It is reacting to a stack: geopolitical stress, oil inflation risk, rising yields, ETF outflows and a market already bruised from recent selling.
Very considerate of the universe to bundle everything neatly like that.
Why This Matters for Bitcoin and Crypto Markets
This matters because Bitcoin is again being tested as a risk asset rather than a clean safe haven.
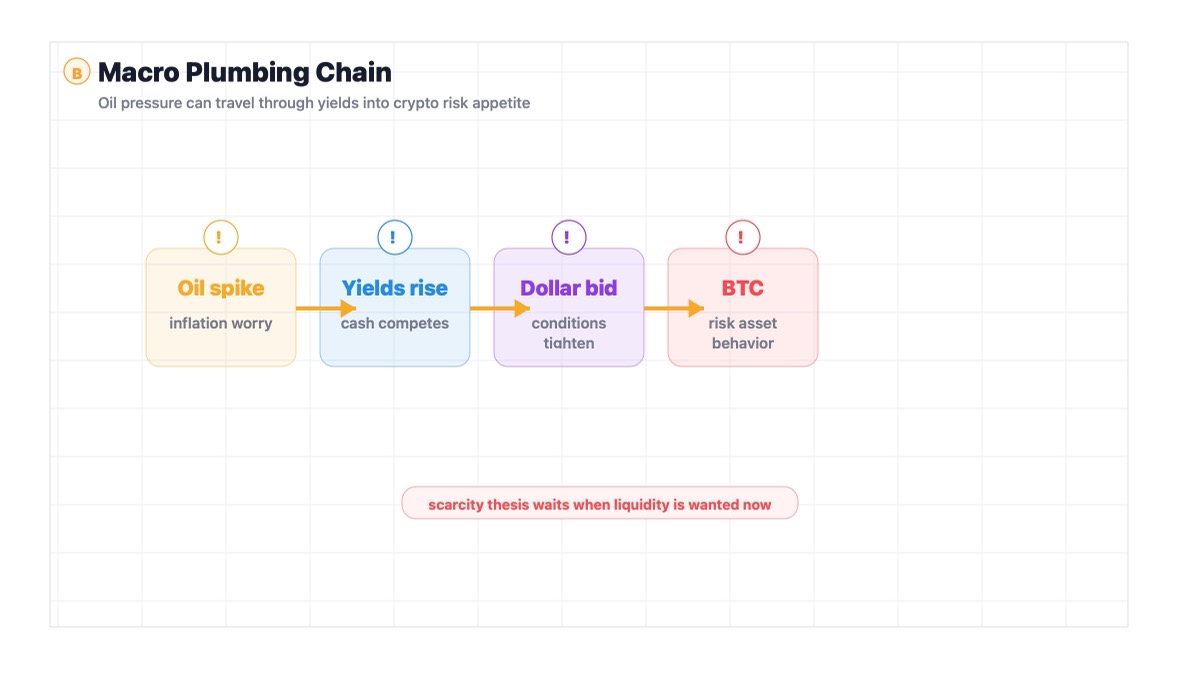
In theory, Bitcoin should benefit from geopolitical instability. It is scarce, borderless and not issued by a government. That is the brochure version. In practice, when oil jumps, yields rise and equity markets fall, traders often sell Bitcoin alongside other high-beta assets because they want liquidity first and philosophy later.
That gap between thesis and trading behavior is the important part.
The Iran-Israel escalation matters because it pushes oil higher. Higher oil can feed inflation concerns. Inflation concerns can push yields higher or keep them elevated. Higher yields support the dollar and tighten financial conditions. Tighter conditions pressure crypto.
That is the chain. It is not glamorous. It is plumbing.
The KOSPI crash adds another signal. South Korean equities have been tied to the AI and semiconductor trade, and a 6.8% fall with a temporary halt is not normal background noise. When a major Asian market breaks that sharply, crypto traders should not pretend they are on a separate planet. They are not. They are on the same risk map, just wearing different shoes.
ETF outflows make the setup more fragile. In February, dip-buying and institutional demand softened the blow. This time, CoinDesk reported heavy ETF redemptions as BTC returned toward $60,000. That means the structural bid is not cushioning the decline in the same way.
For crypto markets, the message is simple: BTC needs to stabilize before altcoins can breathe. If Bitcoin loses $60,000 while oil and yields keep rising, the rest of crypto will likely feel the pressure faster and louder.
Historical Parallel: February 2026's Geopolitical Risk Shock
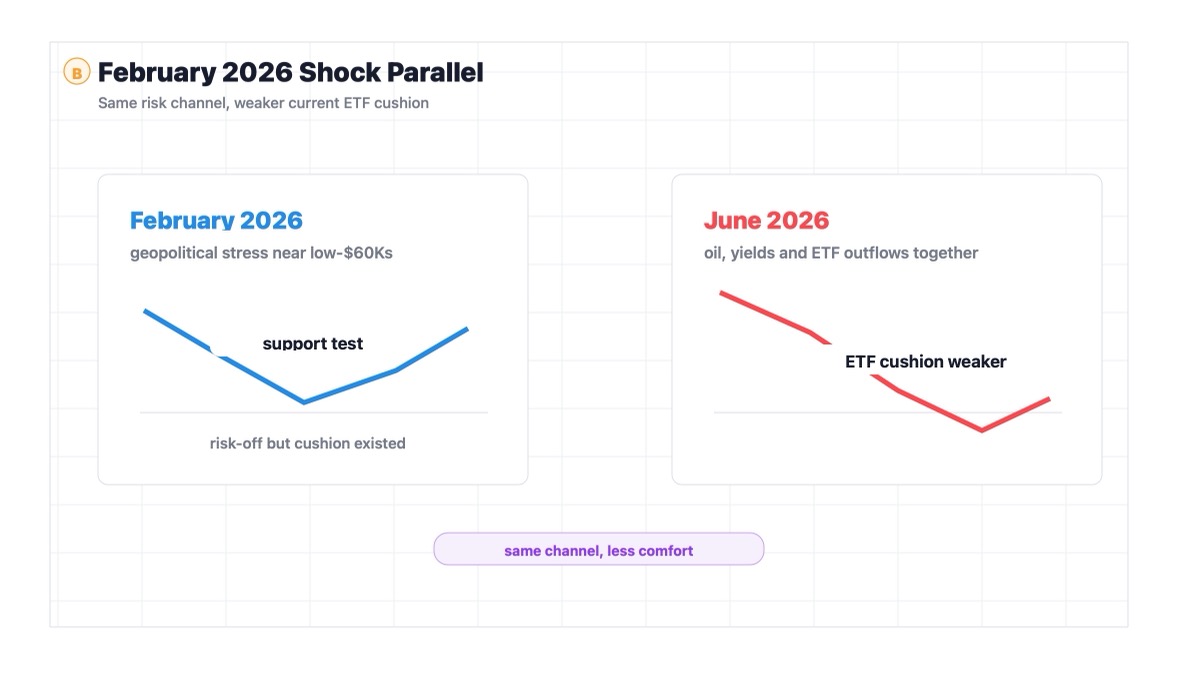
The closest historical parallel is the February 2026 geopolitical risk shock, when Bitcoin also traded near the low-$60,000s during a period of broader market stress. That episode matters because it showed the same uncomfortable dynamic: Bitcoin can have a long-term safe-haven narrative while still trading like a risk asset when markets are forced to cut exposure quickly.
At the time, BTC weakness coincided with a broader risk-off environment. Traders were not only evaluating Bitcoin's monetary properties. They were responding to liquidity, yields, equity stress and the need to manage portfolio risk. When forced selling or defensive positioning takes over, Bitcoin's fixed supply does not automatically stop the decline. It simply becomes one more asset that can be sold.
The similarity to the current setup is the macro transmission chain. In both cases, geopolitical risk did not hit BTC through some mystical crypto channel. It moved through oil, inflation expectations, yields, the dollar and global equity sentiment. Bitcoin then absorbed the shock as a high-beta liquidity asset.
The difference is institutional flow. CoinDesk highlighted that the current return toward $60,000 is happening alongside heavy spot Bitcoin ETF outflows, including $1.72 billion in net redemptions last week. That is a weaker support backdrop than a dip where institutional selling is easing. In plain English: if the cushion is leaving while the floor is being tested, you pay attention.
The lesson is conditional. If geopolitical tension cools, oil stabilizes and ETF outflows slow, BTC can turn this into another support test. If oil and yields keep rising while ETFs bleed, the February-style bottom comparison becomes less comforting and more like a warning label.
Bitcoin Price Reaction and K-Line Analysis
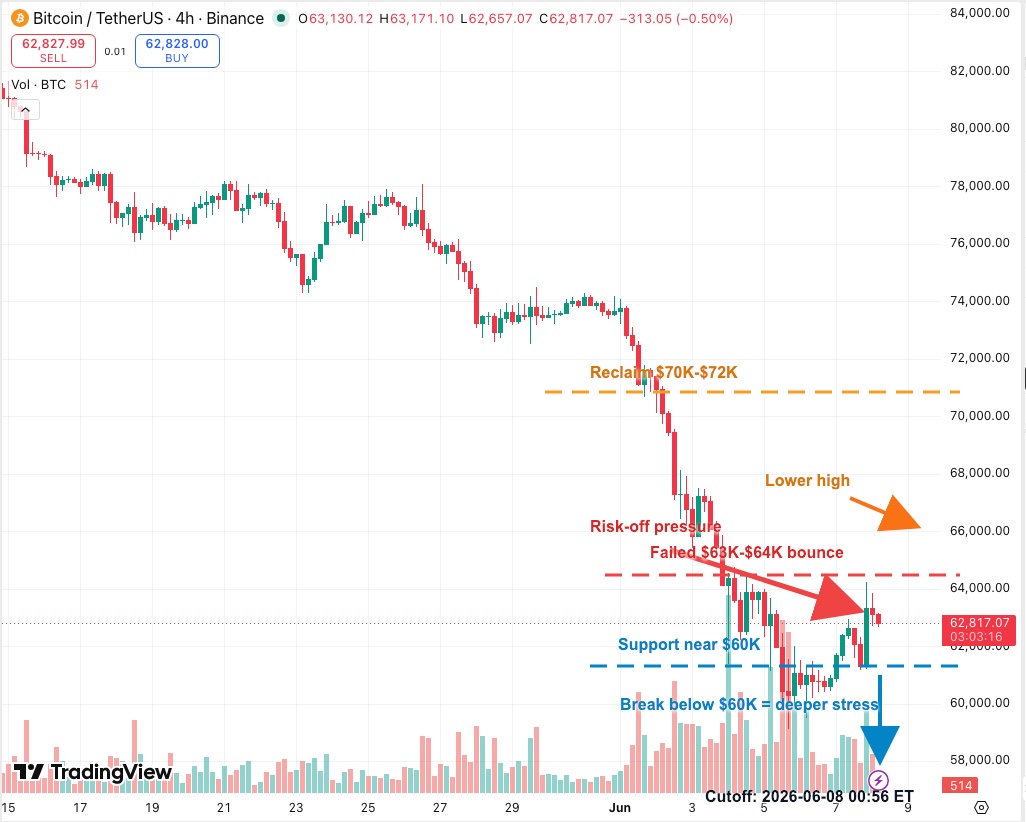
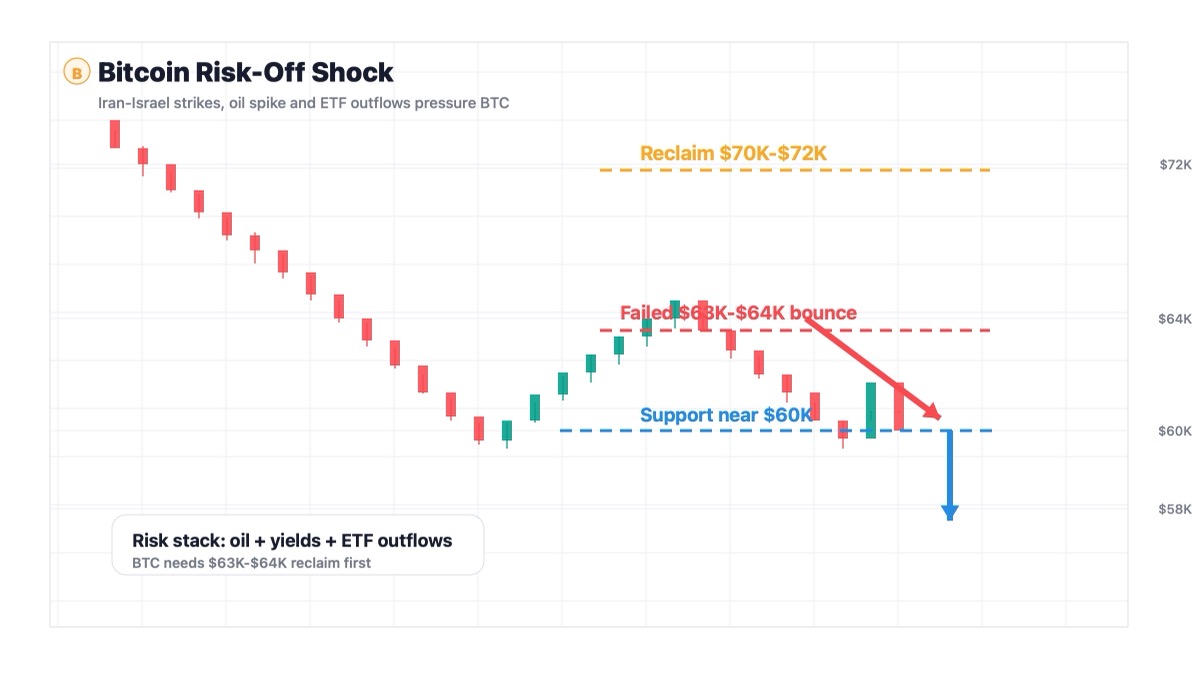
The BTCUSDT 4-hour chart shows a market trying to recover, then failing at exactly the wrong moment.
Bitcoin had rebounded from the $60,000 area and pushed back toward $63,000-$64,000. That bounce failed as the Iran-Israel headlines, oil move and Asian equity selloff hit risk sentiment. The result is a lower high and a pullback into the same fragile support structure.
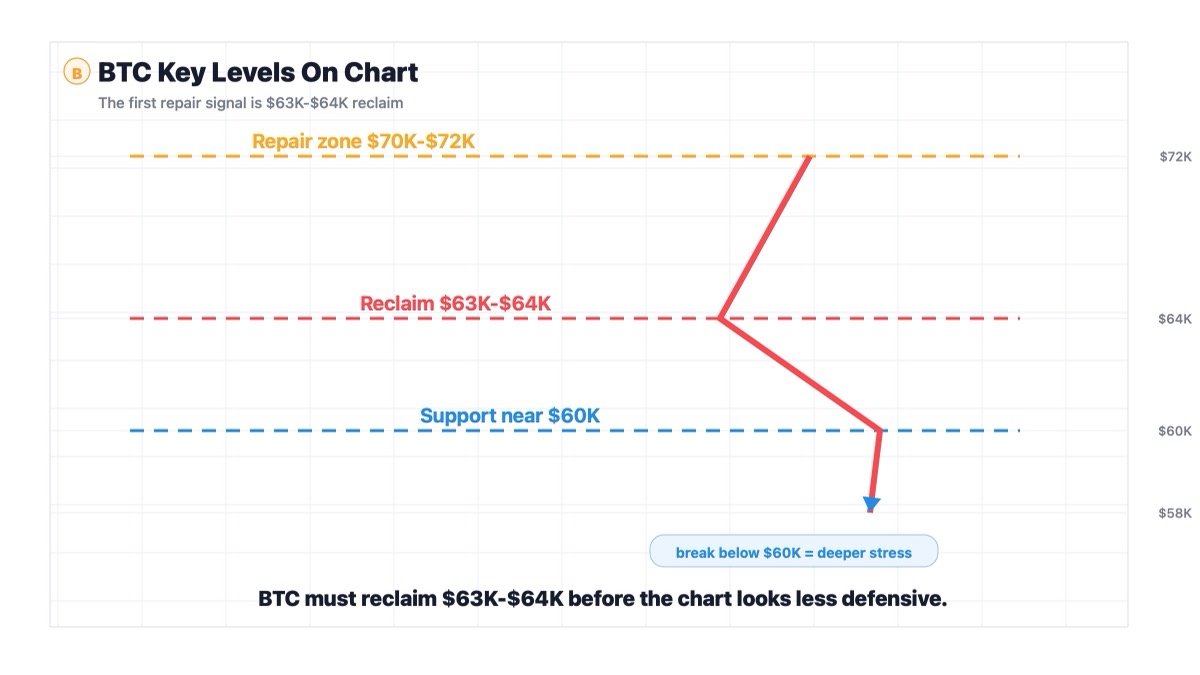
The first level to watch is $63,000-$64,000. BTC needs to reclaim that area quickly to show that the failed bounce is being absorbed. Without that reclaim, the market stays defensive.
The next major repair zone is $70,000-$72,000. That area is far above current price, but it matters because it marks the range BTC would need to recover before the broader downtrend looks less damaged.
The key support is near $60,000. This level has already been tested once, and repeated tests are not always friendly. Support is not a magic wall. It is a place where buyers either show up or reveal that the wall was mostly vibes.
If BTC breaks below $60,000 with volume, the market will likely start pricing deeper stress, especially if oil stays elevated, Treasury yields rise and ETF outflows continue.
Key Levels to Watch
The immediate reclaim zone is $63,000-$64,000. BTC needs to recover this area to reduce short-term pressure.
The major support zone is near $60,000. Losing it would shift the market from support test to deeper breakdown risk.
The larger repair zone is $70,000-$72,000. BTC needs to reclaim this band before the trend structure looks meaningfully healthier.
The macro levels to watch are WTI crude near $93.50, U.S. Treasury yields and ETF flow data. Those may matter as much as any candle pattern right now.
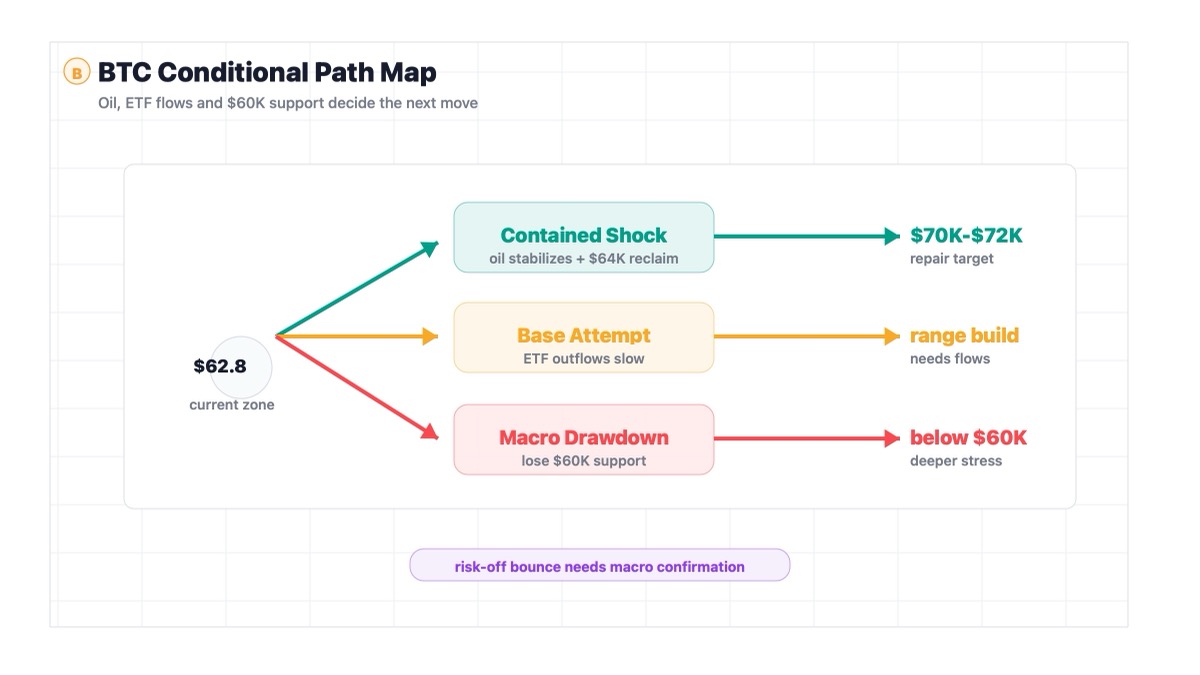
Conditional Forecast
If BTC reclaims $63,000-$64,000 and oil stabilizes, the selloff can remain a volatile but contained risk-off reaction.
If BTC loses $60,000 while crude and yields keep rising, the market may begin pricing a deeper macro-driven drawdown.
If ETF outflows slow and inflation data comes in softer, BTC could build a base and attempt a move back toward $70,000-$72,000.
If geopolitical escalation continues, short-term rallies may struggle because traders will keep treating BTC as part of the risk-asset basket rather than a standalone hedge.
Investment Takeaway
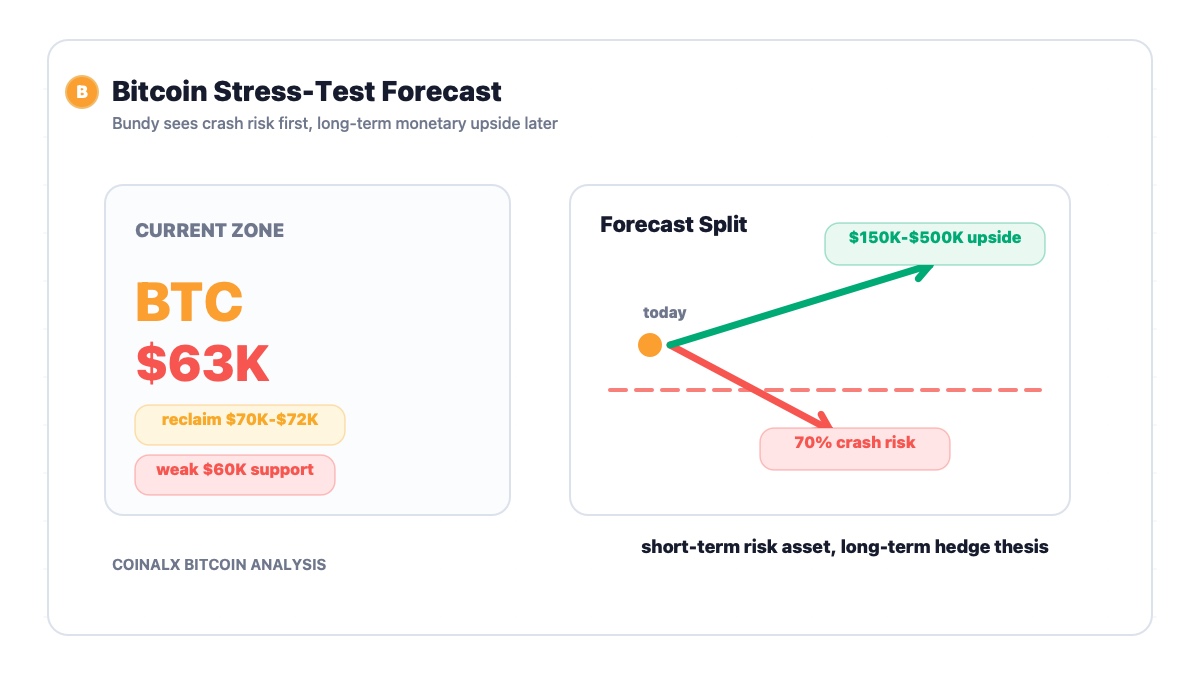
The useful takeaway is that Bitcoin is still caught between two identities.
Long term, it wants to be a hedge against unstable governments and monetary disorder. Short term, it is still trading like a liquidity-sensitive risk asset when oil, yields and equities move violently.
For traders, the map is straightforward: below $63,000-$64,000, BTC remains vulnerable; above that area, stabilization improves; below $60,000, the setup gets much colder.
For long-term investors, the key question is whether ETF demand returns when macro stress hits. If institutional buyers step back during the dip, Bitcoin's safe-haven story has to wait its turn behind the market's need for cash.
Sources
- CoinDesk: Bitcoin falls back below $63,000 as Iran-Israel trade strikes and Korean stocks crash
- TradingView: BTCUSDT chart, Binance
- CME Group: WTI crude oil futures
- U.S. Bureau of Labor Statistics: Inflation data releases
|
DISCLAIMER:
1. All content on this website (including but not limited to articles, data, charts, and analyses) is for general informational purposes only and does not constitute any form of investment advice, trading recommendation, or financial guidance. 2. Cryptocurrencies and digital assets are subject to extreme price volatility and high investment risk; you may lose part or all of your principal. Past performance does not predict future results. 3. The information on this website is based on sources we believe to be reliable, but we do not guarantee its accuracy, completeness, or timeliness. Any investment decisions made based on this website’s information are at your own risk. 4. We strongly recommend that you conduct your own thorough research and consult an independent, licensed financial advisor before making any investment decisions. |