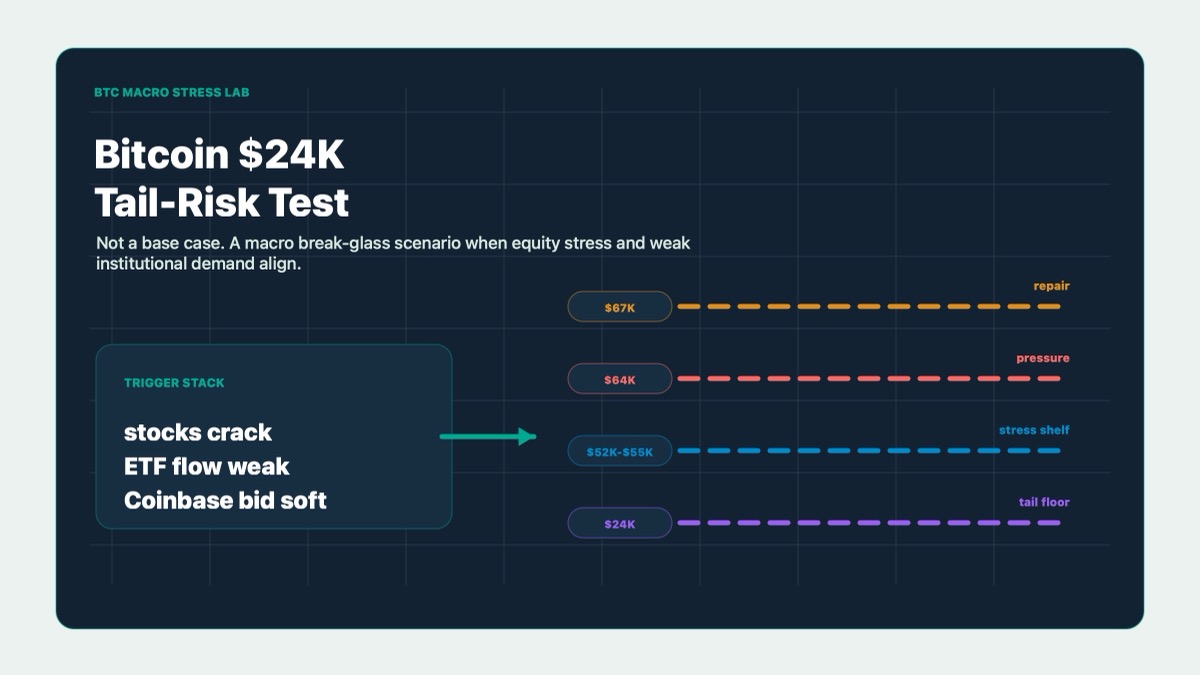
Key Takeaways
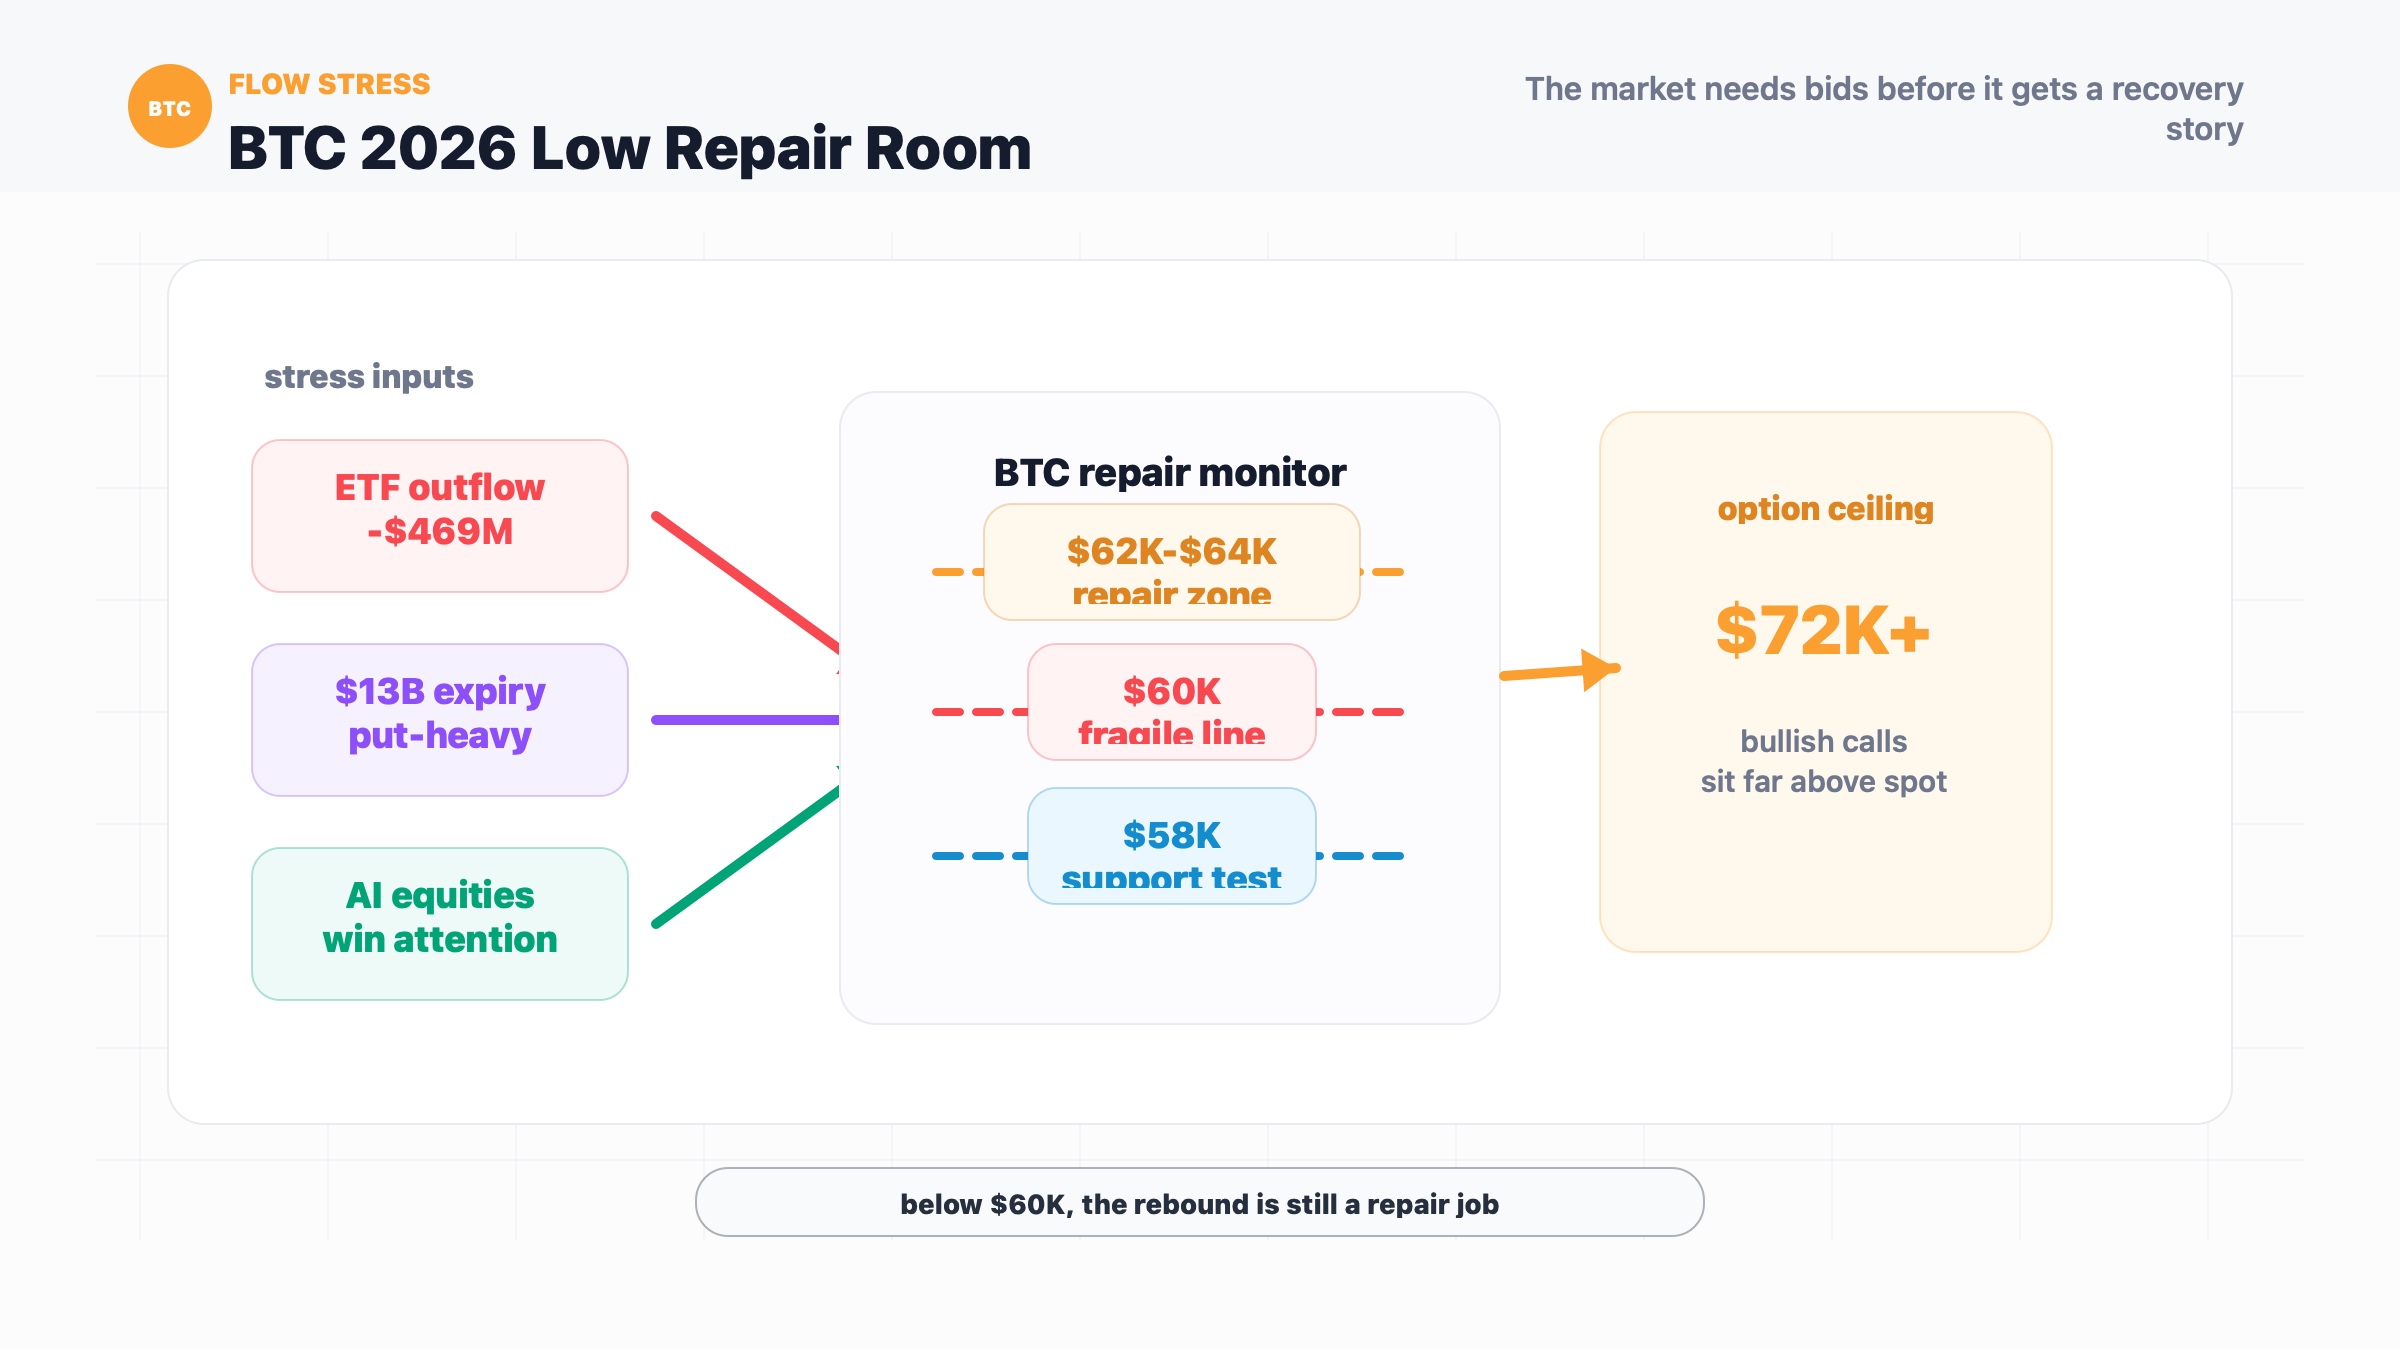
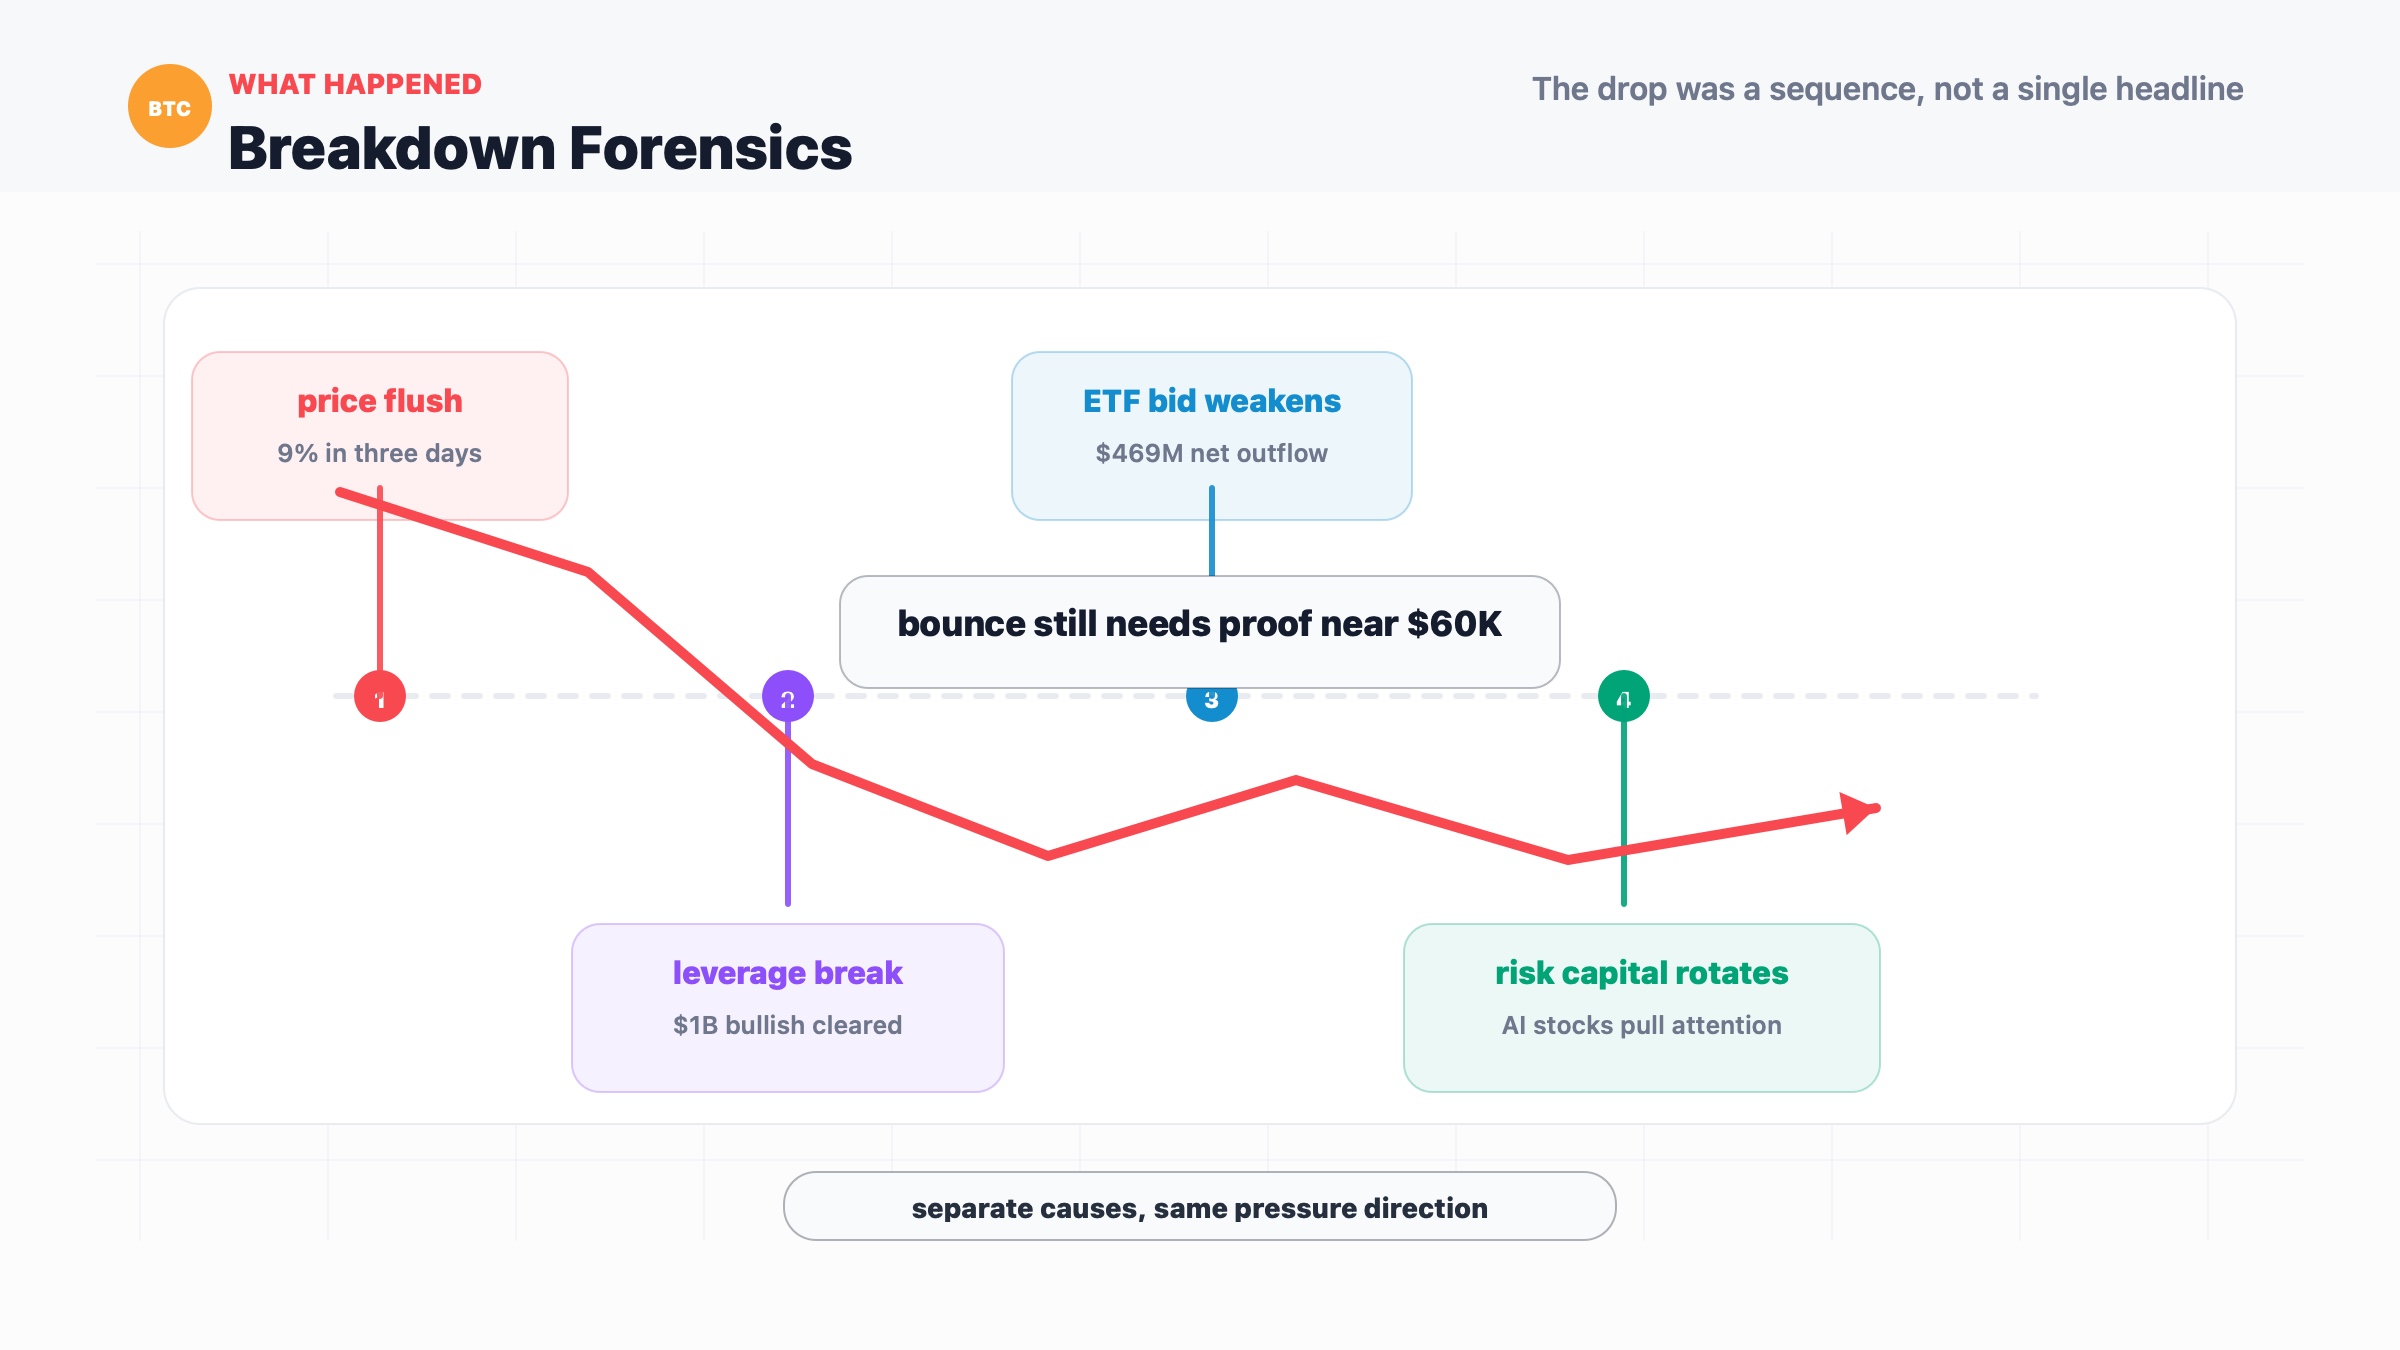
- Bitcoin fell 9% in three days, retested the $58,000 area and triggered more than $1 billion in bullish leveraged liquidations.
- A modest rebound toward $59,500 does not yet solve the problem, because BTC remains under pressure below the $60,000-$62,000 repair zone.
- Spot Bitcoin ETF outflows, a put-heavy options expiry and stronger AI-linked stock returns are pulling capital away from BTC.
- Bulls need a reclaim of $62,000-$64,000 to turn the bounce into a repair; losing $58,000 would reopen deeper stress.
What Happened
Bitcoin bounced, which is nice. The problem is that a bounce is not the same thing as a recovery.
According to Cointelegraph, BTC fell 9% in three days and hit its lowest level since September 2024, retesting the $58,000 area before recovering toward $59,500. The move triggered more than $1 billion in liquidations across bullish BTC leveraged positions. That is the market's way of turning optimism into accounting.
The pressure did not come from one clean villain. It came from several smaller machines all pulling in the same direction.
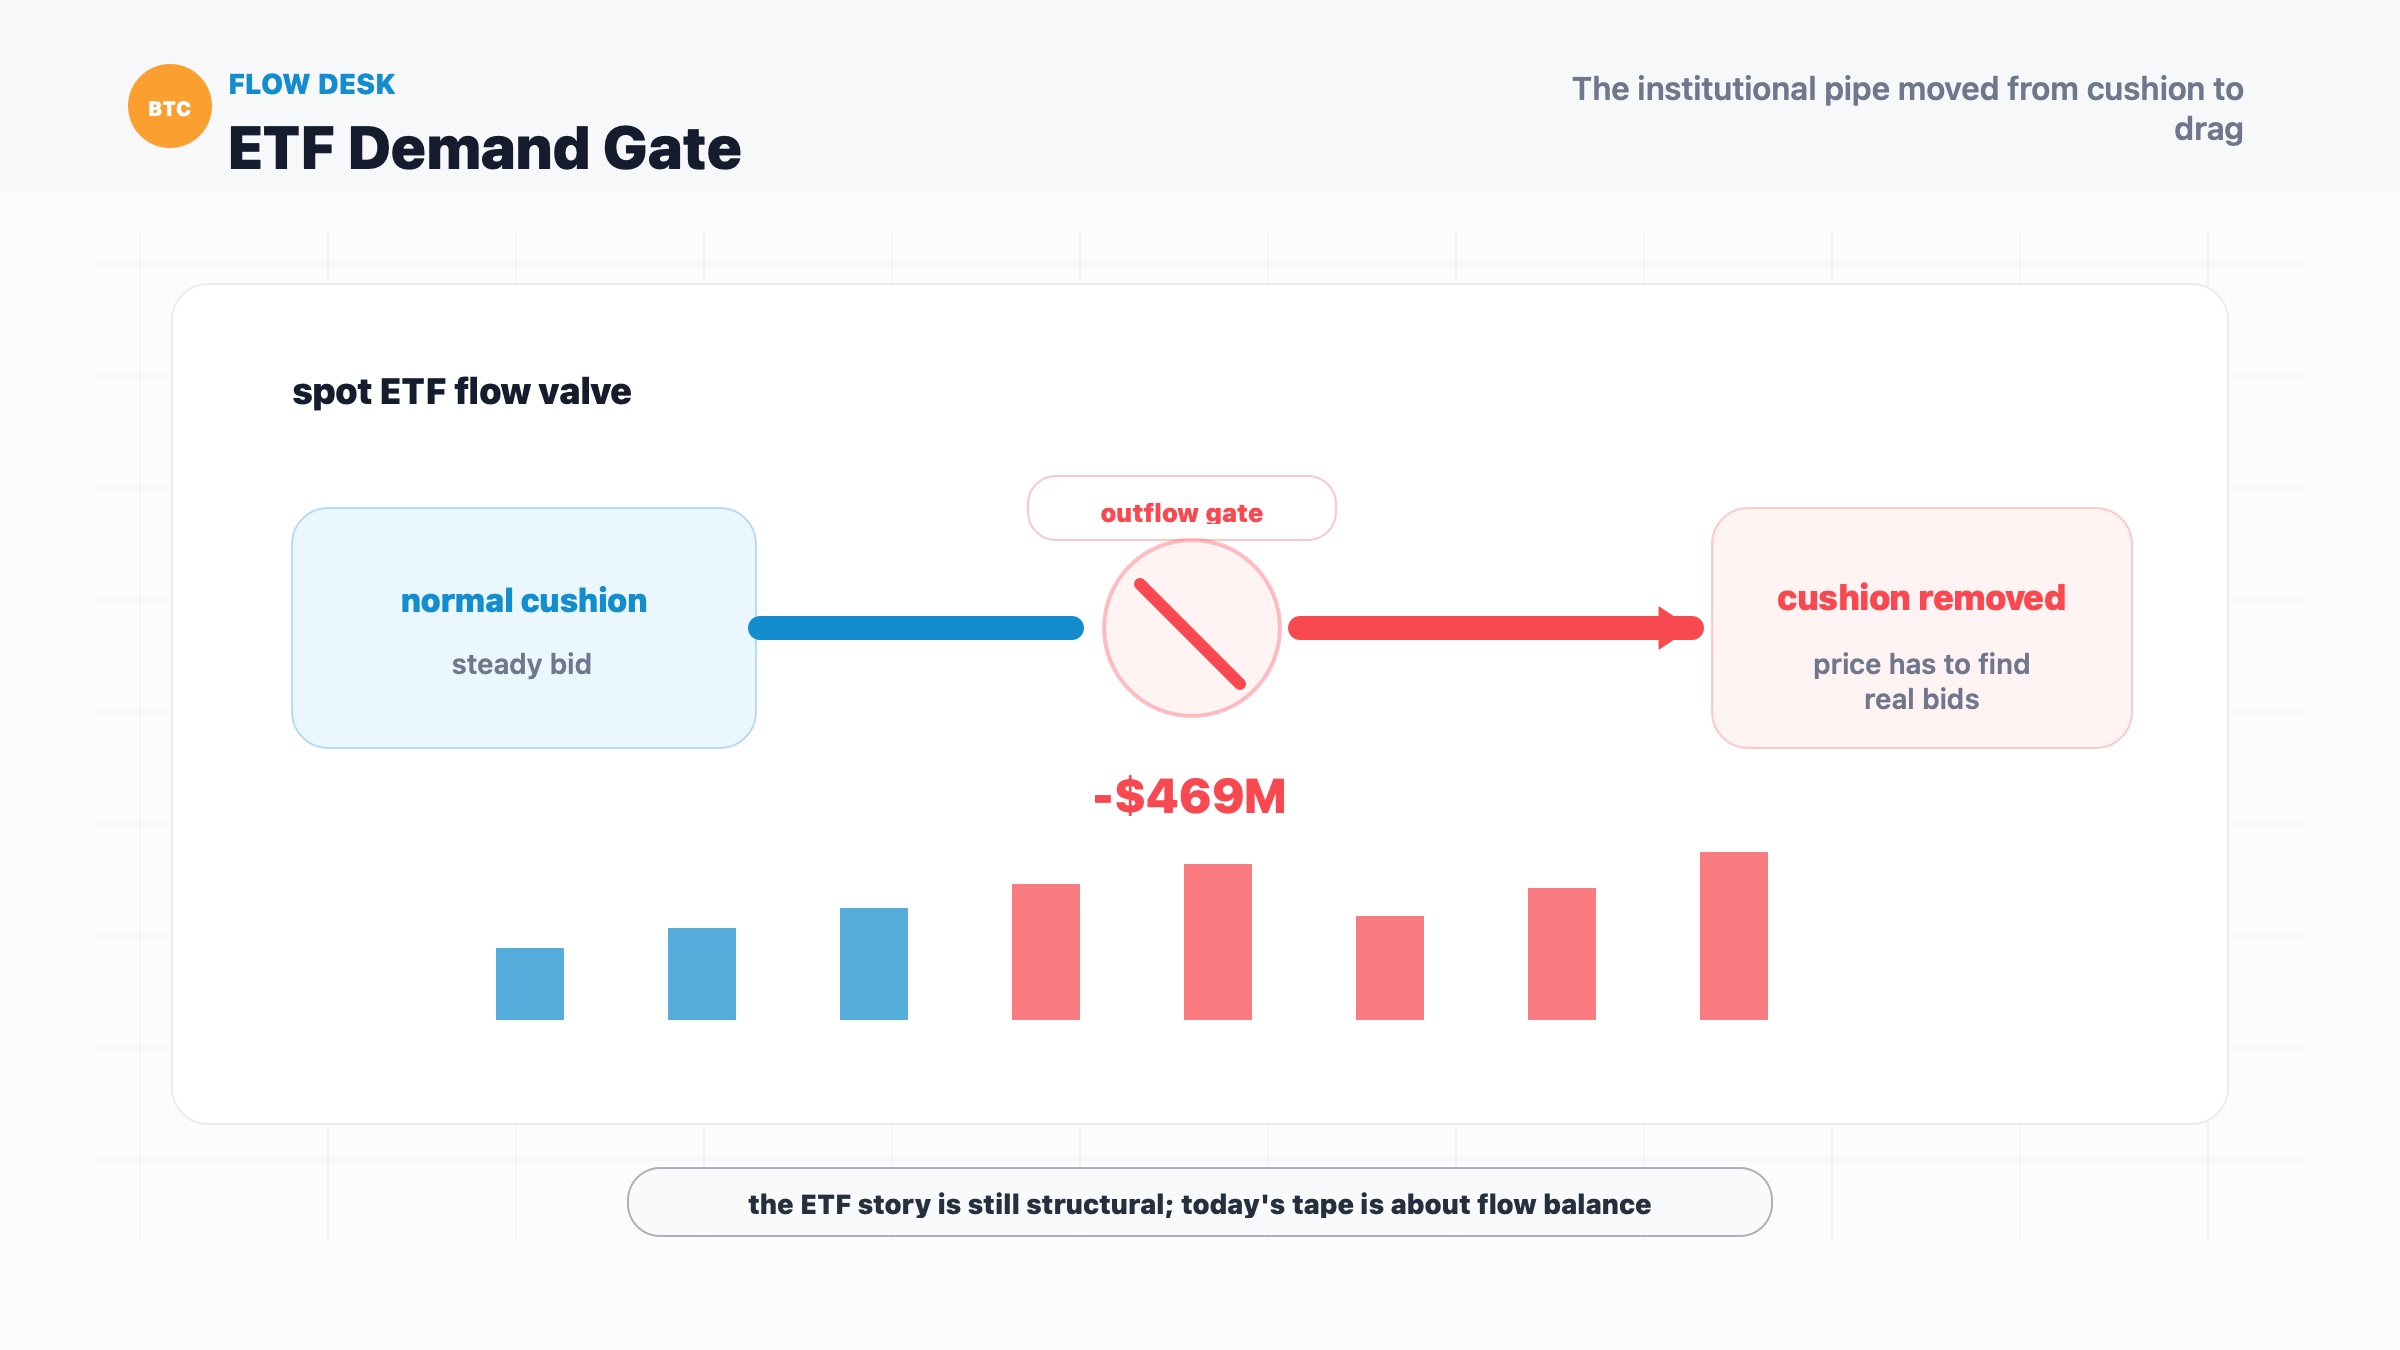
First, spot Bitcoin ETF demand weakened. Cointelegraph reported $469 million in net outflows from US spot BTC ETFs on Wednesday. For this cycle, that matters because ETF flows have become one of the cleanest proxies for institutional demand. When those flows are positive, Bitcoin gets a steady bid. When they turn sharply negative, the market loses one of its most important cushions.
Second, the options market is not helping. The upcoming $13 billion Bitcoin options expiry reportedly leans heavily toward puts, with most neutral-to-bullish call strategies sitting at $72,000 or above. That means a large part of bullish options positioning is stranded far above spot price. It is hard to call that support.
Third, Bitcoin is competing for attention with a very loud stock market. Micron, Sandisk and Applied Materials all jumped on AI-linked optimism, while the broader equity market recovered intraday losses. If you are a macro investor looking for risk exposure, the annoying question is simple: why buy the asset breaking down when the AI trade is still handing out dopamine?
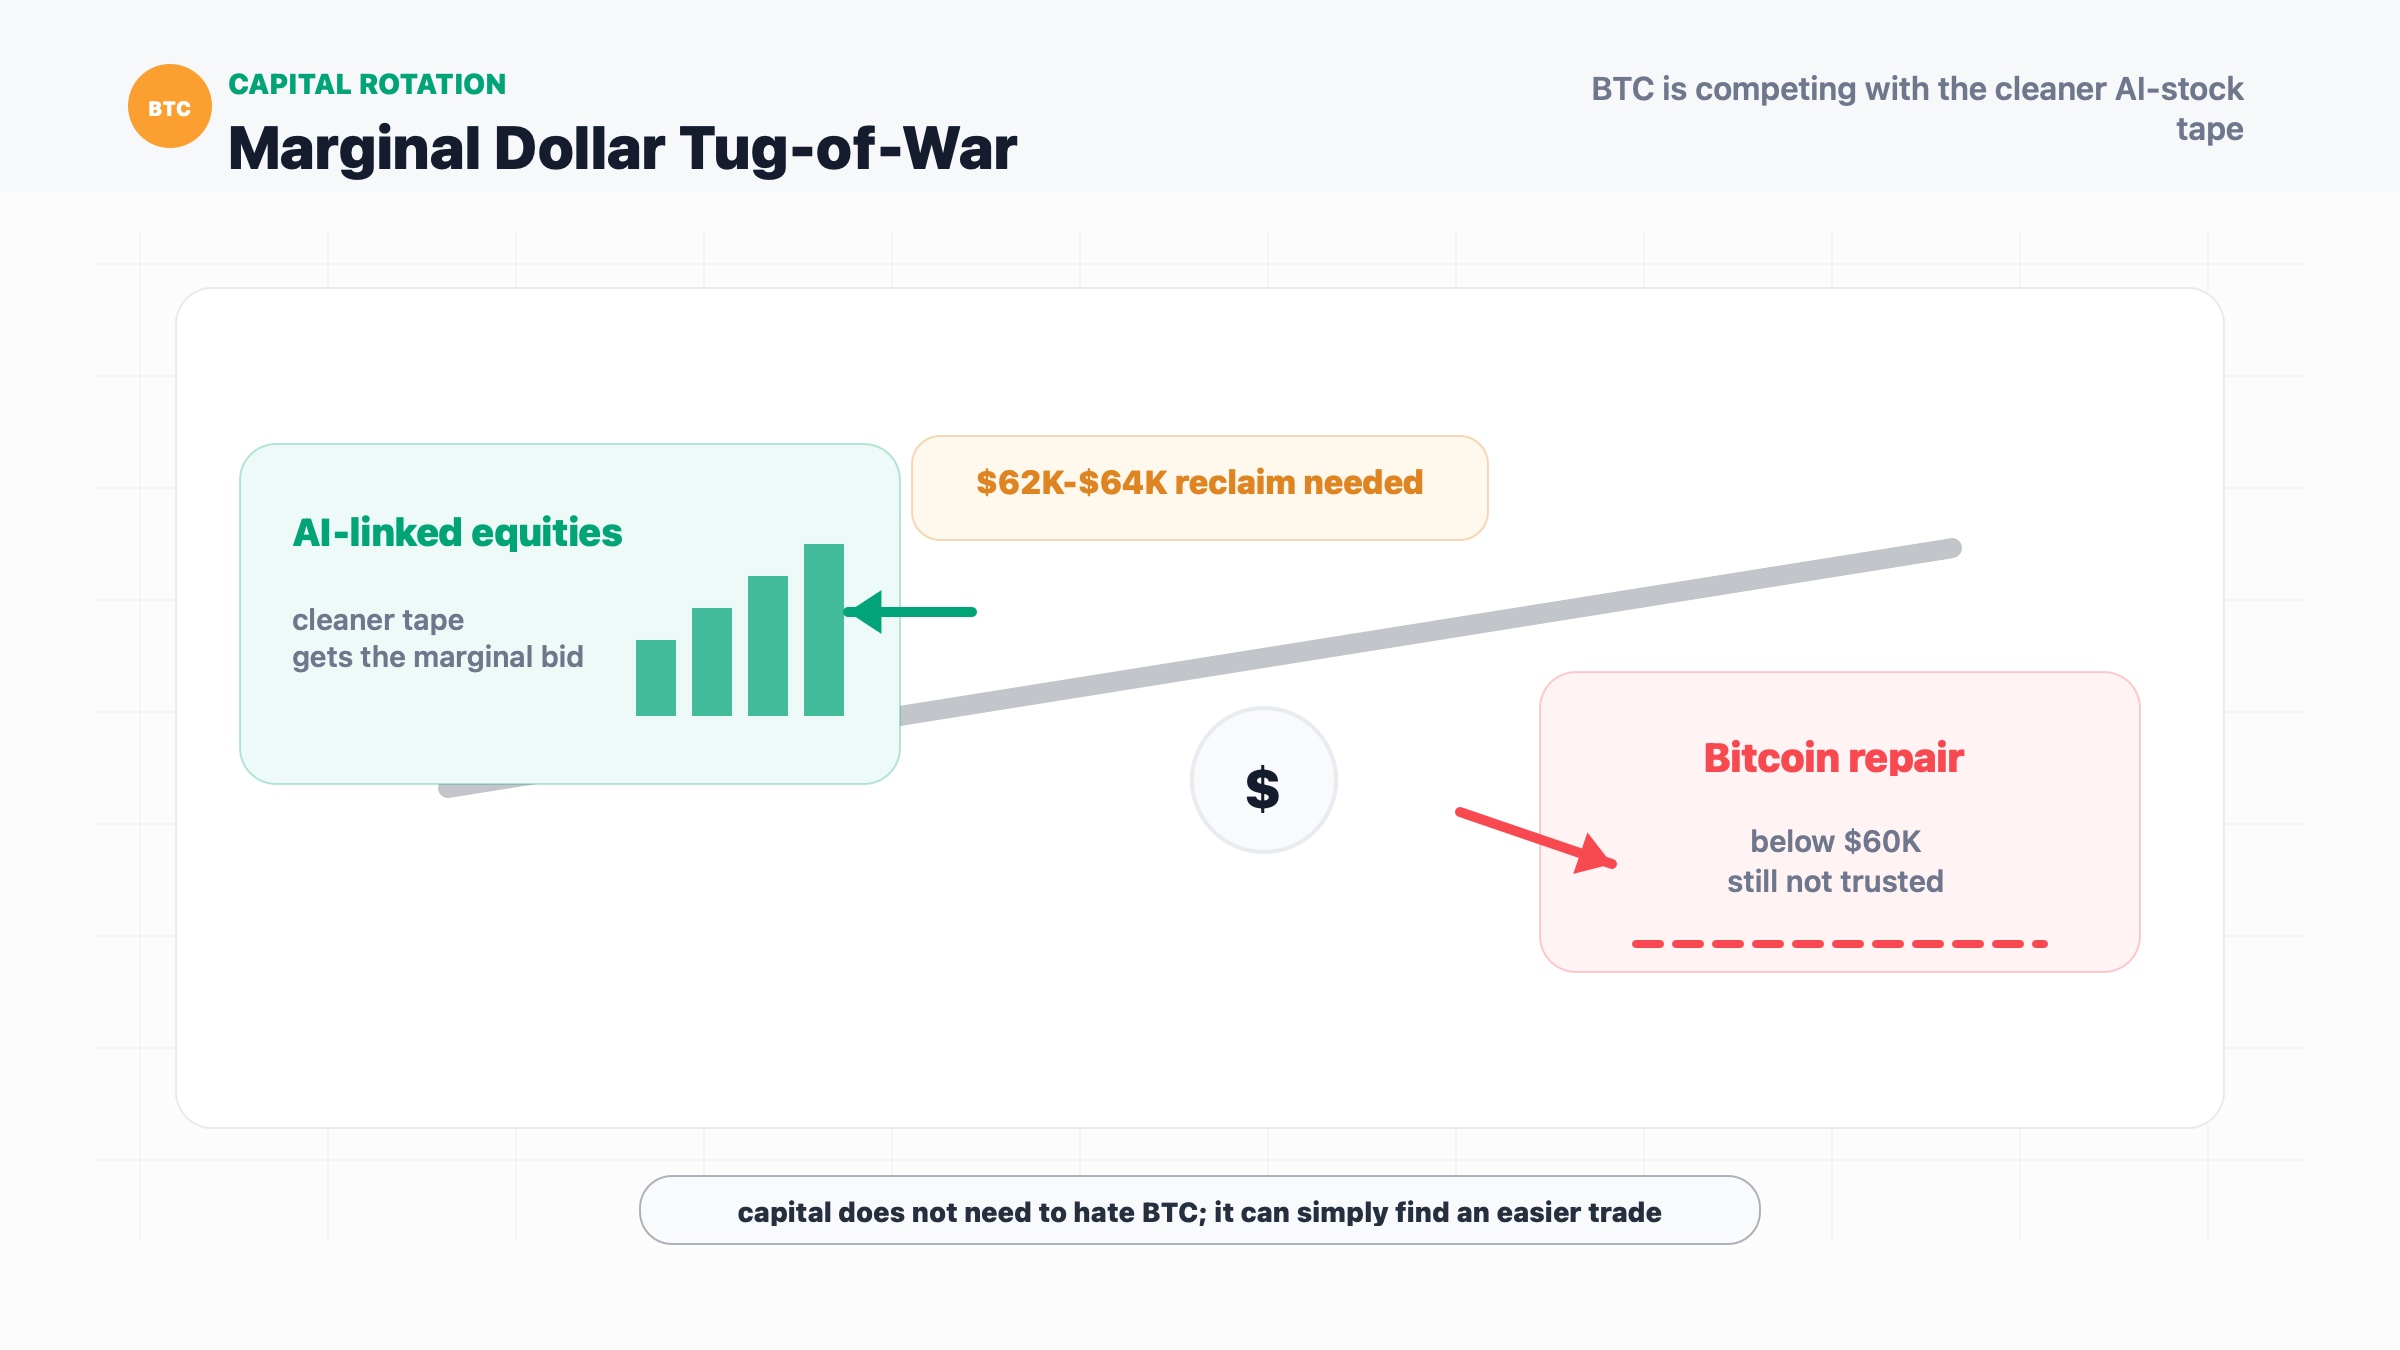
Bitcoin does not need to compete with AI as a technology. It does need to compete with AI stocks for marginal dollars. That is less philosophical, and more brutal.
Why This Matters for Bitcoin and Crypto Markets
This matters because Bitcoin is supposed to be the high-conviction asset in crypto. When it starts behaving like the asset that investors sell to fund a more exciting trade, the whole market notices.
The key issue is not that Bitcoin dropped to $58,000. Markets go down. The key issue is that the usual support stories are not lining up cleanly. Stocks bounced. Gold recovered intraday losses. Oil was lower. Investors grew more comfortable with the idea that inflation pressure may be peaking. In a simple "risk-on" story, that should have helped BTC more.
But Bitcoin had its own problems: ETF outflows, liquidation pressure, options expiry skew and concern around Strategy's unrealized losses. The market was not saying "macro is bad, sell everything." It was saying something more specific and more uncomfortable: "There may be better places to take risk right now."
That is why the $60,000 level matters so much. It is not just a round number. It is the line between a scary but repairable flush and a market that keeps failing every attempt to reclaim lost ground.
For the rest of crypto, this is a liquidity warning. If Bitcoin cannot hold a clean rebound while ETFs are bleeding and AI stocks are absorbing capital, altcoins should not assume they get a free pass. The market usually asks Bitcoin the hard question first. Then it starts asking everyone else with less patience.
Historical Parallel
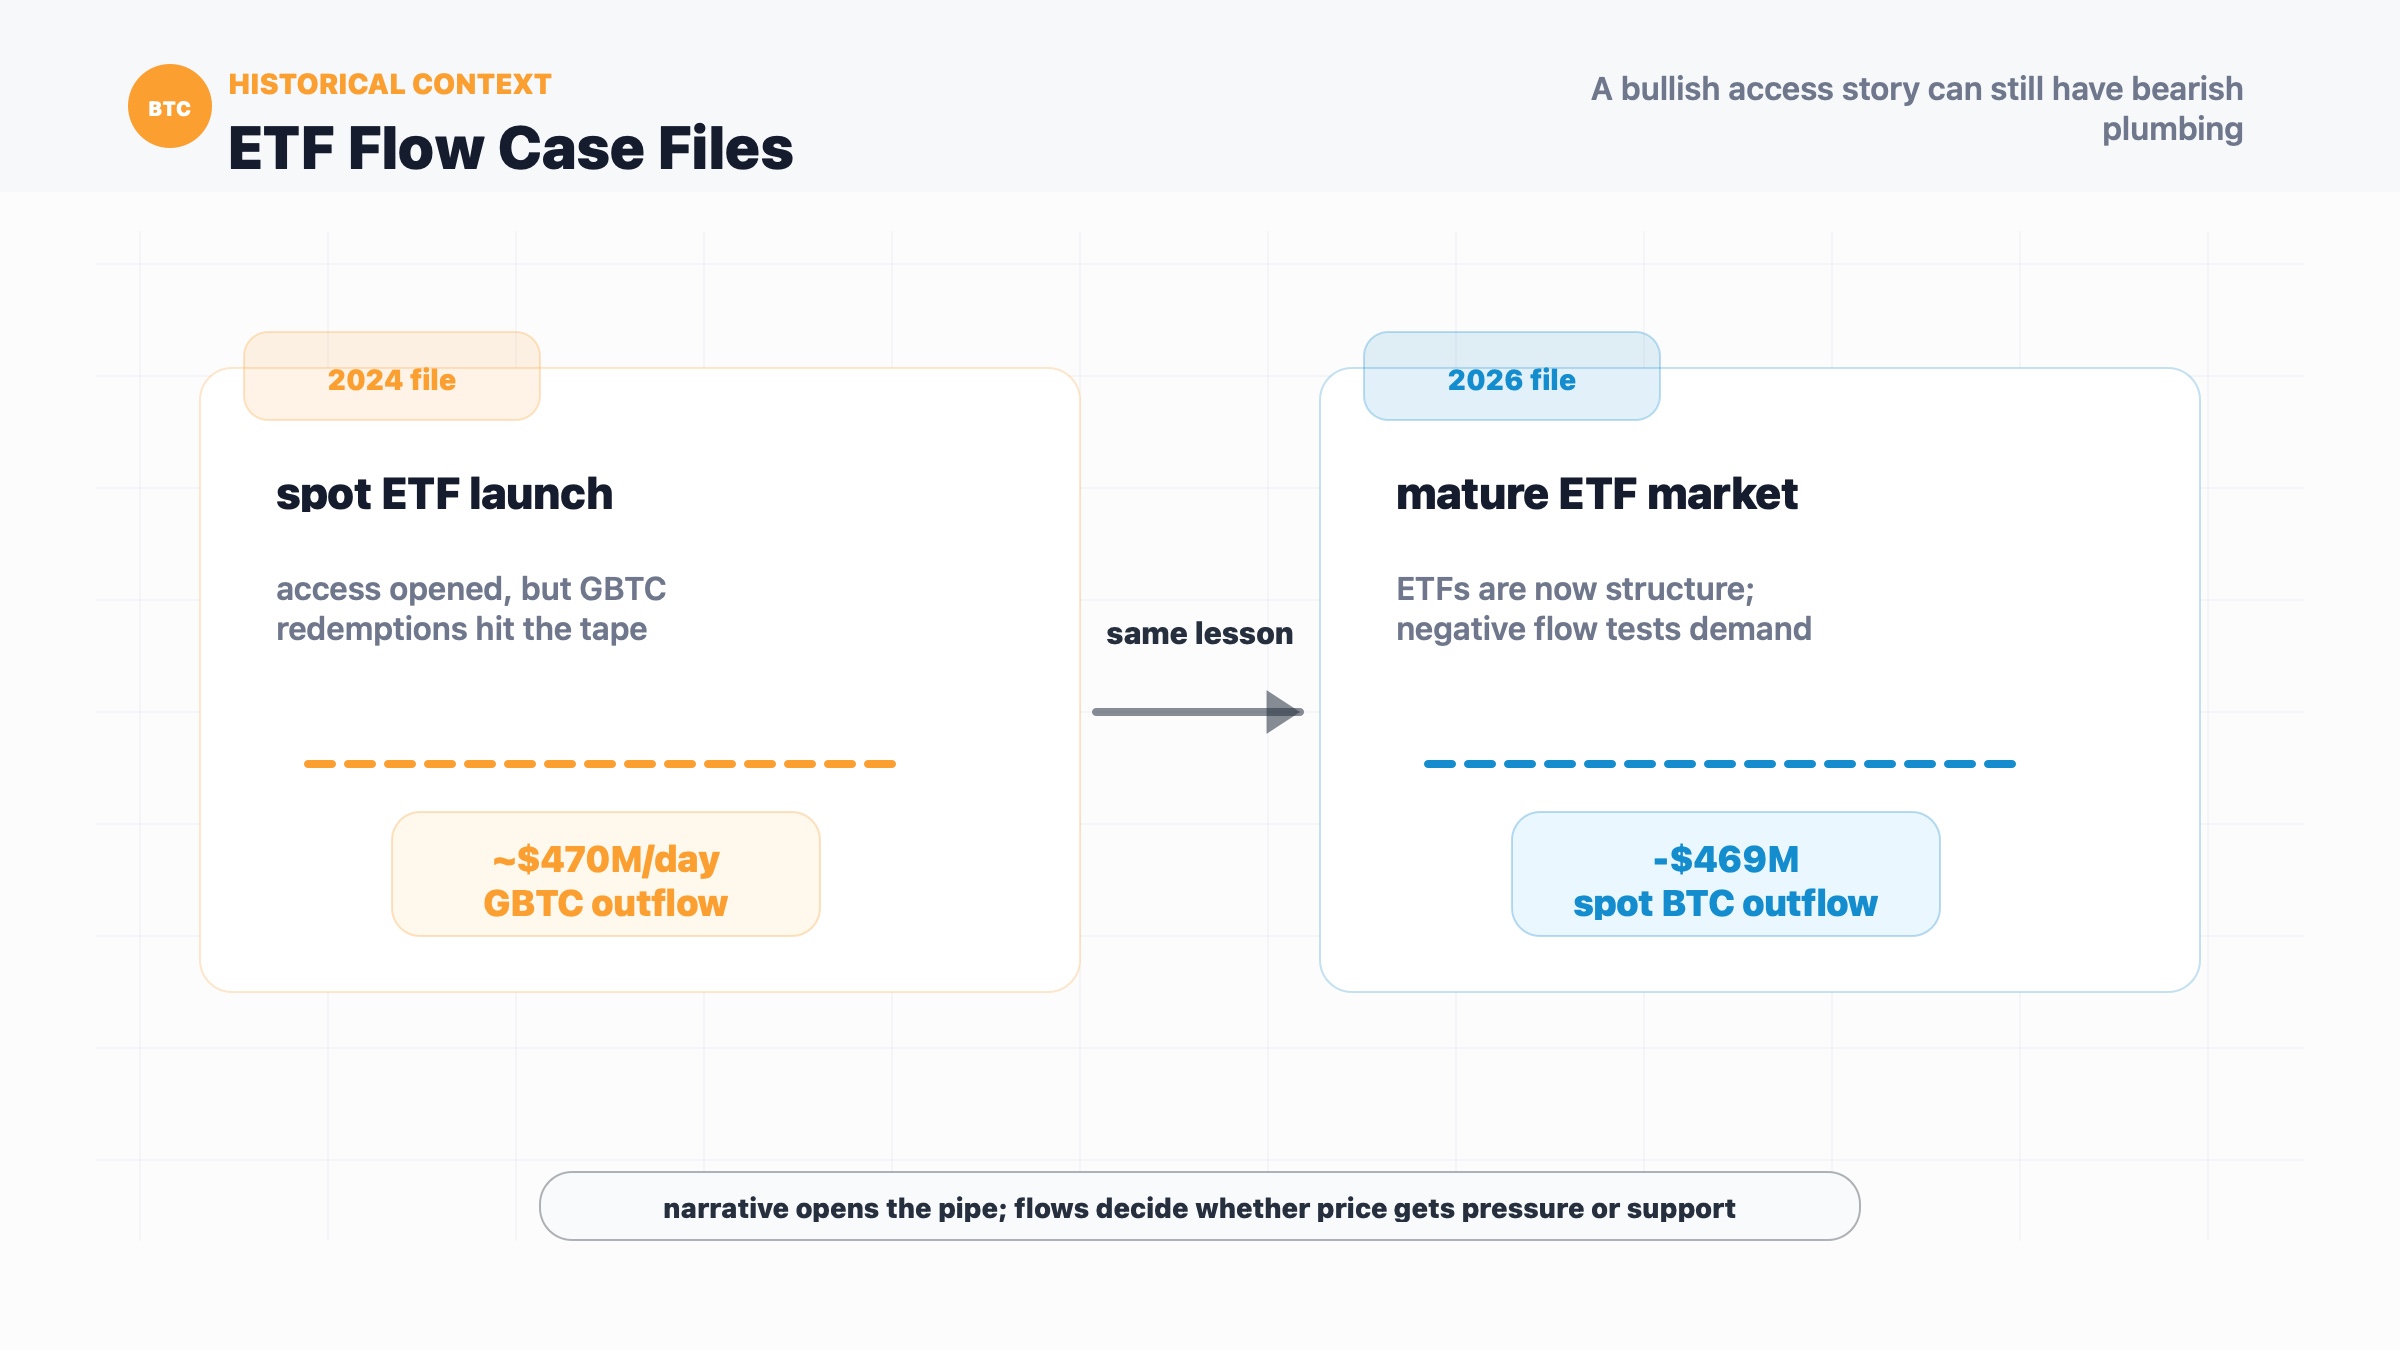
The closest historical parallel is the January 2024 spot Bitcoin ETF launch, especially the first weeks of GBTC outflows.
On January 10, 2024, the SEC approved the listing and trading of spot Bitcoin exchange-traded products. The headline was structurally bullish: regulated spot ETF access had finally arrived after years of failed attempts. In the simple version of the story, that should have meant instant upside. A new institutional pipe had opened. Money could flow in more easily. Everyone could clap politely and update their price targets.
The market, being the market, made it messier.
After the ETFs began trading, Grayscale's converted GBTC product saw heavy redemptions. CoinDesk reported that GBTC averaged about $470 million in daily outflows during the first six trading days, even as newer funds attracted demand. The result was a strange early ETF regime: the long-term access story improved, but the short-term flow balance was not automatically bullish. Bitcoin had to digest the plumbing before the narrative could work.
That is the similarity to the current setup. In both cases, the surface story is not enough. In 2024, "ETF approval" sounded bullish, but GBTC outflows mattered more in the short run. In 2026, "Bitcoin is an institutional asset" still sounds bullish, but spot ETF outflows, options positioning and competing equity returns are what traders have to trade today.
The difference is that January 2024 was an adoption shock with messy flow rotation. The current episode is a demand stress test after ETFs have already become part of Bitcoin's market structure. That makes it less celebratory and more mechanical. The lesson is the same: Bitcoin narratives do not clear trades by themselves. Flows do. Until ETF outflows slow and BTC reclaims the $60,000-$64,000 area, the bounce is just a sentence fragment.
Bitcoin Price Reaction and K-Line Analysis
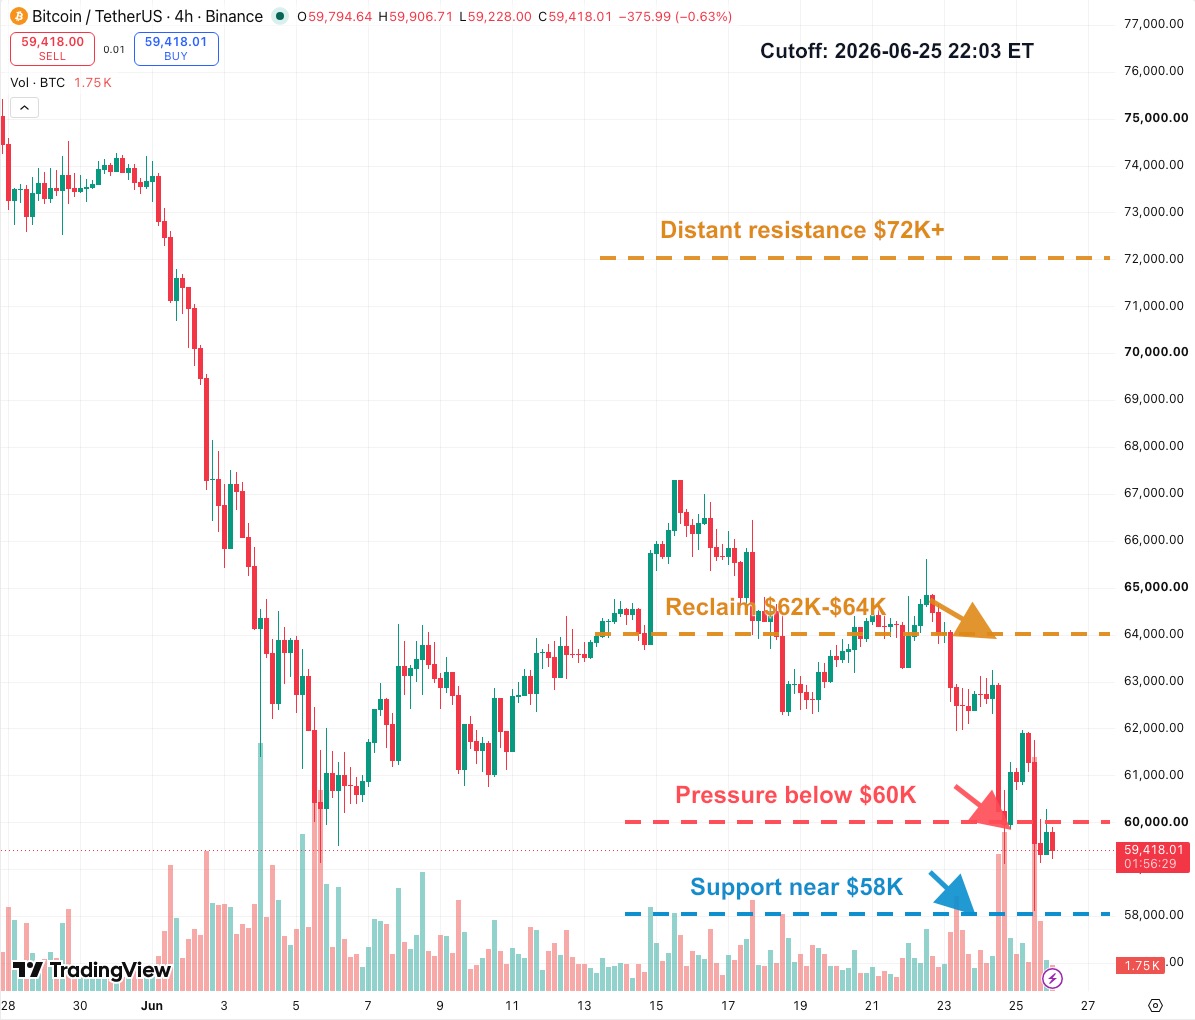
The 4-hour BTCUSDT chart shows a market that is trying to breathe after a sharp breakdown.
The left side of the chart is the easy part to understand: BTC sold off hard from the low-$70,000s, broke through multiple local shelves, and eventually hit the $58,000 area. The later part is more important. Bitcoin bounced, but the rebound stalled around $60,000-$62,000 rather than reclaiming the prior range.
That is not confirmation. That is negotiation.
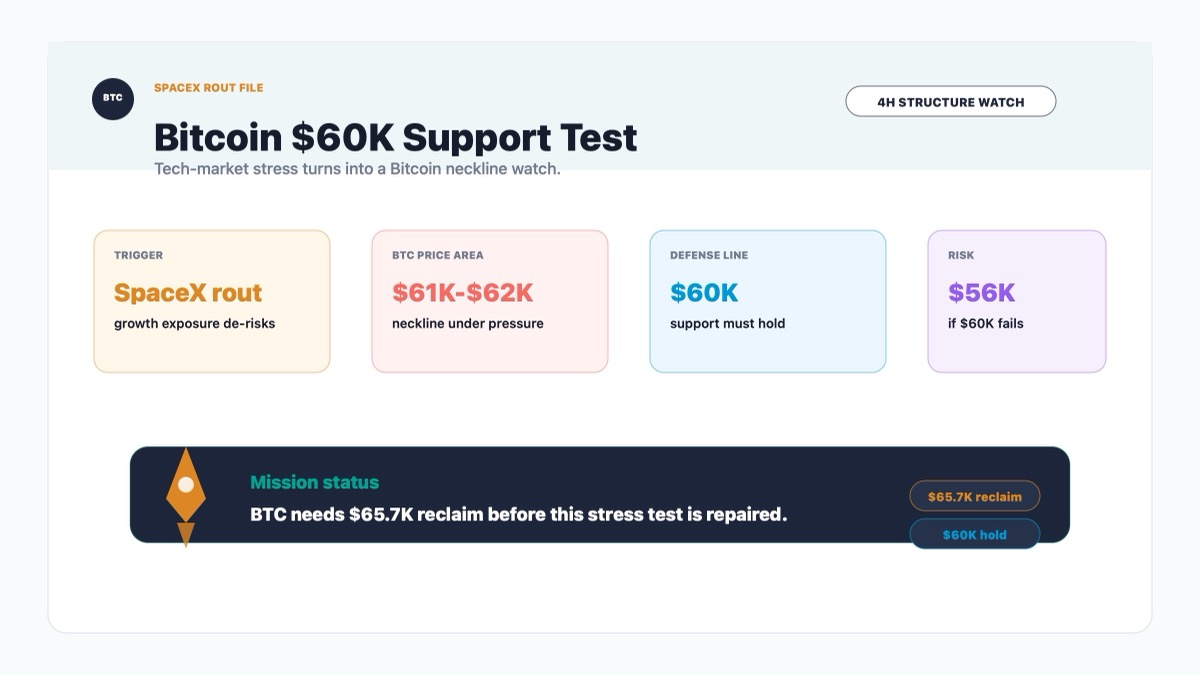
The first level is $58,000. This is the support area that caught the latest flush. If BTC keeps holding it, the market can argue that forced selling is cooling and the liquidation event is being absorbed.
The second level is $60,000. Bitcoin is hovering around this area, but not with much authority. A market that is truly repairing should not spend too long trapped below its first obvious reclaim line.
The third level is $62,000-$64,000. This is the real repair zone. It lines up with the prior local breakdown area and the short-term lower-high structure. If BTC can reclaim that band, the bounce starts to look like more than mechanical short covering.
The distant level is $72,000 and above. That matters less for immediate spot trading, but it explains why the options market looks so hostile: much of the neutral-to-bullish call exposure is sitting far above the current market.
Key Levels to Watch
$58,000: Immediate support. Losing this level would suggest the liquidation flush has not finished clearing.
$60,000: Psychological repair line. BTC needs to regain this area quickly to stop the bounce from looking weak.
$62,000-$64,000: Real reclaim zone. A move back above this band would show buyers are doing more than catching a falling candle.
$72,000+: Distant resistance and options pressure zone. It is not today's target; it is the reminder that bullish positioning is still far away from spot.
Conditional Forecast
If BTC holds $58,000 and reclaims $60,000 with stronger 4-hour closes, the market can start treating the drop as a forced deleveraging event rather than a fresh breakdown.
If BTC then pushes through $62,000-$64,000, the repair case becomes more credible. That would suggest ETF outflows and options pressure are still headwinds, but not enough to keep price pinned near the lows.
If BTC fails at $60,000 and loses $58,000, the next discussion becomes uglier. The market would likely start pricing a deeper demand search, especially if ETF outflows continue and AI-linked equities keep offering a cleaner risk trade.
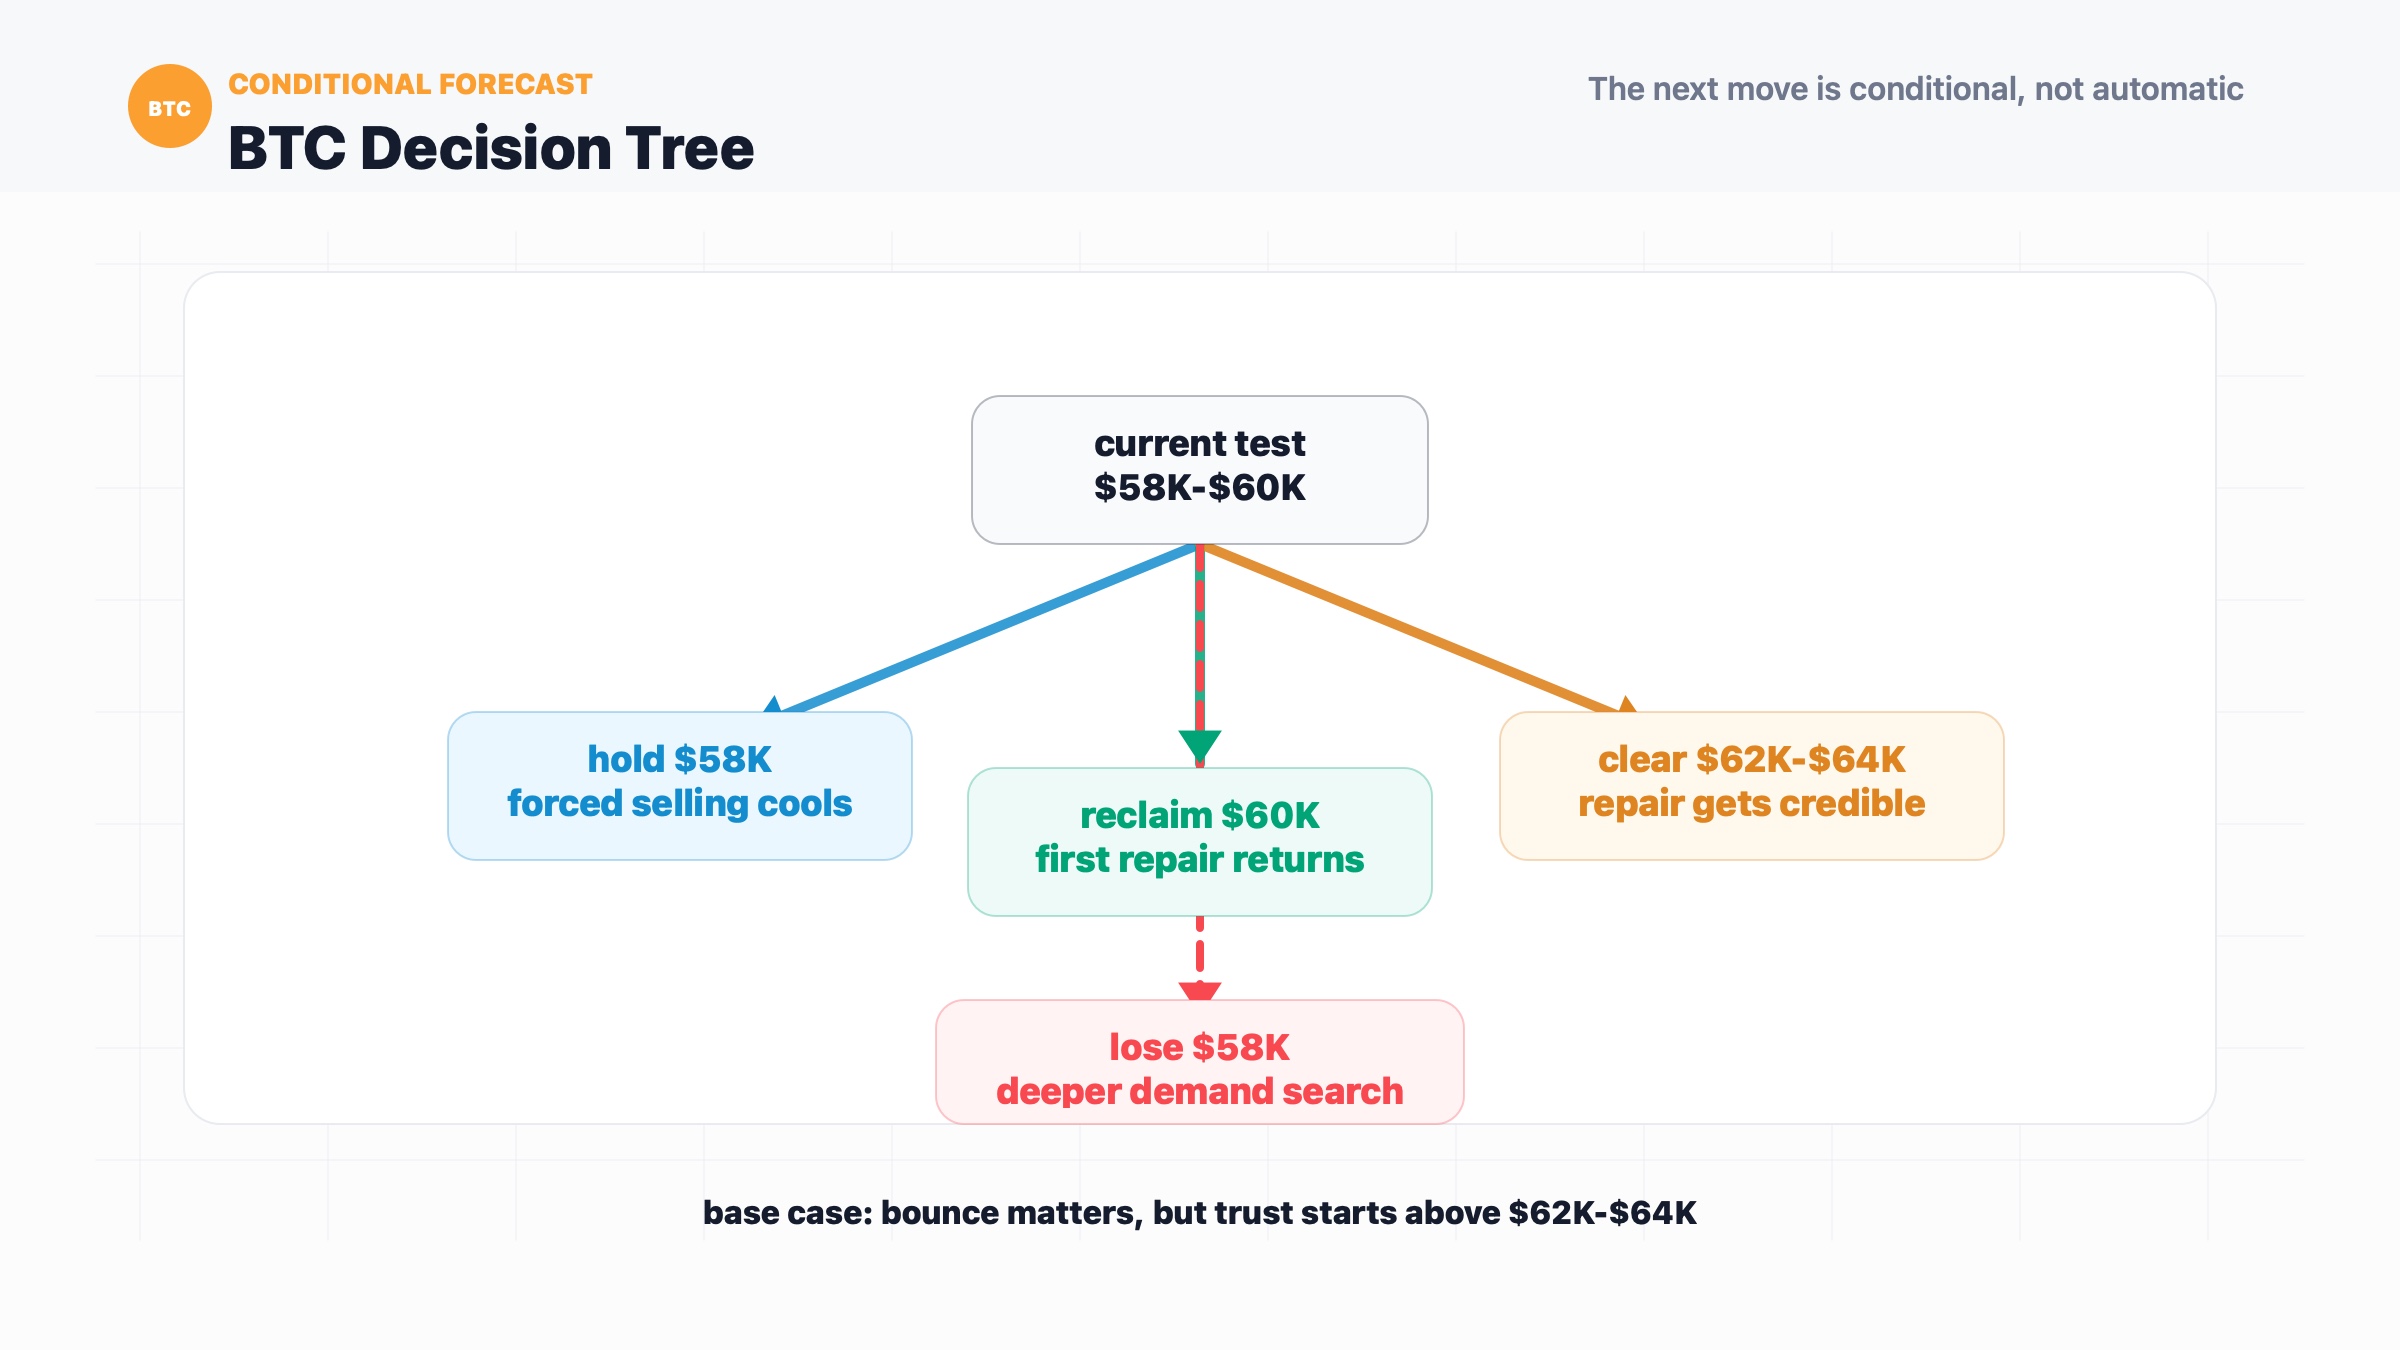
My base case is cautious: the bounce matters, but it has not yet earned trust. Bitcoin needs fewer stories and more bids.
Investment Takeaway
The useful takeaway is not that Bitcoin is "dead" because it retested $58,000. Bitcoin has had worse days and developed a whole personality around surviving them.
The better takeaway is that this is a flow problem, not just a price problem. ETF outflows weaken institutional demand. Options positioning creates overhead pressure. AI stocks are competing for risk capital. Treasuries offer yield. Put those together and Bitcoin has to work harder for the same dollar.
For traders, the map is simple: $58,000 must hold, $60,000 must be reclaimed, and $62,000-$64,000 is where the bounce either becomes repair or turns into another lower high.
For investors, the message is a little slower: Bitcoin's long-term thesis may remain intact, but this market is demanding proof that institutional demand is still there. The chart will tell us before the speeches do.
Sources
- Cointelegraph: Bitcoin bounces off new 2026 price lows: Will US stock weakness push BTC lower? (https://cointelegraph.com/markets/bitcoin-bounces-off-new-2026-price-lows-will-us-stock-weakness-push-btc-lower)
- TradingView: BINANCE:BTCUSDT 4-hour chart (https://www.tradingview.com/chart/?symbol=BINANCE%3ABTCUSDT&interval=240)
- SoSoValue: US spot Bitcoin ETF flows (https://sosovalue.com/assets/etf/us-btc-spot)
- CME Group: FedWatch Tool (https://www.cmegroup.com/markets/interest-rates/cme-fedwatch-tool.html)
- SEC: Statement on the Approval of Spot Bitcoin Exchange-Traded Products (https://www.sec.gov/newsroom/speeches-statements/gensler-statement-spot-bitcoin-011023)
- CoinDesk: Bitcoin price nears $44K as ETFs see net inflows for first time in a week (https://www.coindesk.com/markets/2024/01/30/bitcoin-price-nears-44k-as-etfs-see-net-inflows-for-first-time-in-a-week)
|
DISCLAIMER:
1. All content on this website (including but not limited to articles, data, charts, and analyses) is for general informational purposes only and does not constitute any form of investment advice, trading recommendation, or financial guidance. 2. Cryptocurrencies and digital assets are subject to extreme price volatility and high investment risk; you may lose part or all of your principal. Past performance does not predict future results. 3. The information on this website is based on sources we believe to be reliable, but we do not guarantee its accuracy, completeness, or timeliness. Any investment decisions made based on this website’s information are at your own risk. 4. We strongly recommend that you conduct your own thorough research and consult an independent, licensed financial advisor before making any investment decisions. |
Recommended reading
Latest News