Key Takeaways
- HYPE rallied more than 30% in five days and pushed into a record zone near $74-$76.
- The bull case combines three forces: a bull pennant breakout, rising leveraged demand and Hyperliquid's fee-driven buyback story.
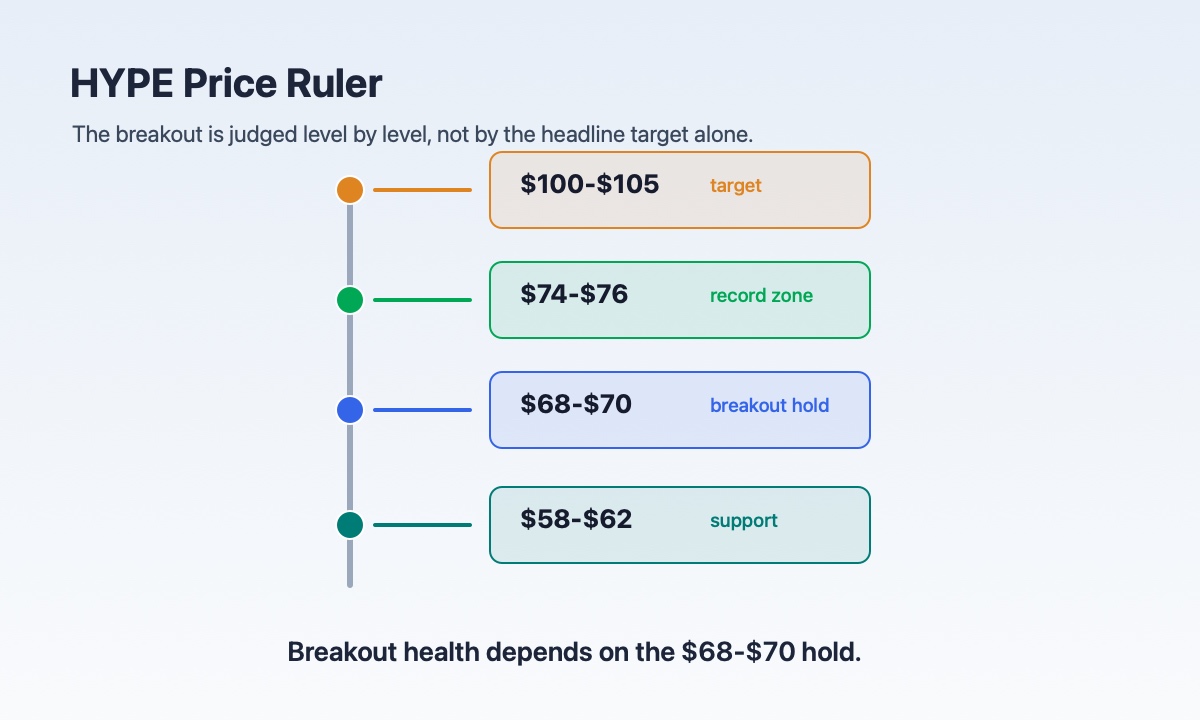
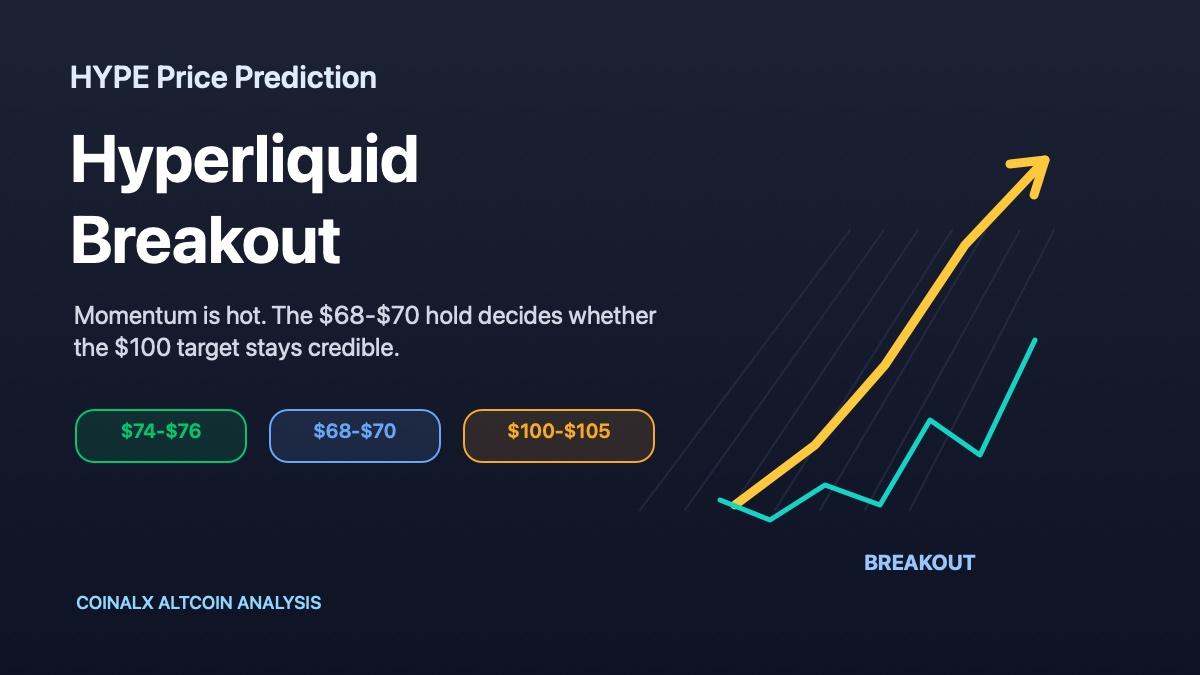
- The $68-$70 area now matters more than the headline $100 target because it tells us whether the breakout is actually holding.
- Momentum is hot, not magically risk-free; a loss of $58-$62 would weaken the entire setup.
What Happened
Hyperliquid's native token, HYPE, broke out from a bull pennant pattern after a sharp late-May rally. Cointelegraph reported that HYPE had climbed more than 30% in five days and reached a record high near $74, with the measured move from the pattern pointing toward roughly $105.30 by June or July.
That is the clean headline version.
The more useful version is that HYPE is being pulled by three engines at once.
First, the chart has entered breakout mode. The late-May move created the flagpole, then price compressed inside a tightening range, then broke above the upper boundary on stronger volume. Technical traders love this kind of structure because it gives them a target and a clear invalidation line. Markets enjoy giving people neat boxes right before making them emotionally expensive. Still, the structure is real.
Second, derivatives positioning is leaning bullish. The article cited CoinGlass data showing HYPE open interest at a record $3.5 billion, up from about $1.41 billion at the start of the year. Funding was positive, and short liquidations since May 20 were about $126.28 million, compared with $68.85 million in long liquidations. That is the shape of a market where shorts have been forced to buy back exposure as price rises.
Third, the fundamentals are not just decorative. Cointelegraph cited DefiLlama data showing Hyperliquid as the second-largest blockchain by 30-day app revenue, with $57.9 million generated at the article's snapshot. A later DefiLlama API check showed Hyperliquid L1 30-day revenue around $50.8 million, which is lower but still directionally strong. The exact number can move with time and methodology. The important mechanism is that Hyperliquid routes most protocol fees to its Assistance Fund, which buys HYPE on the open market.
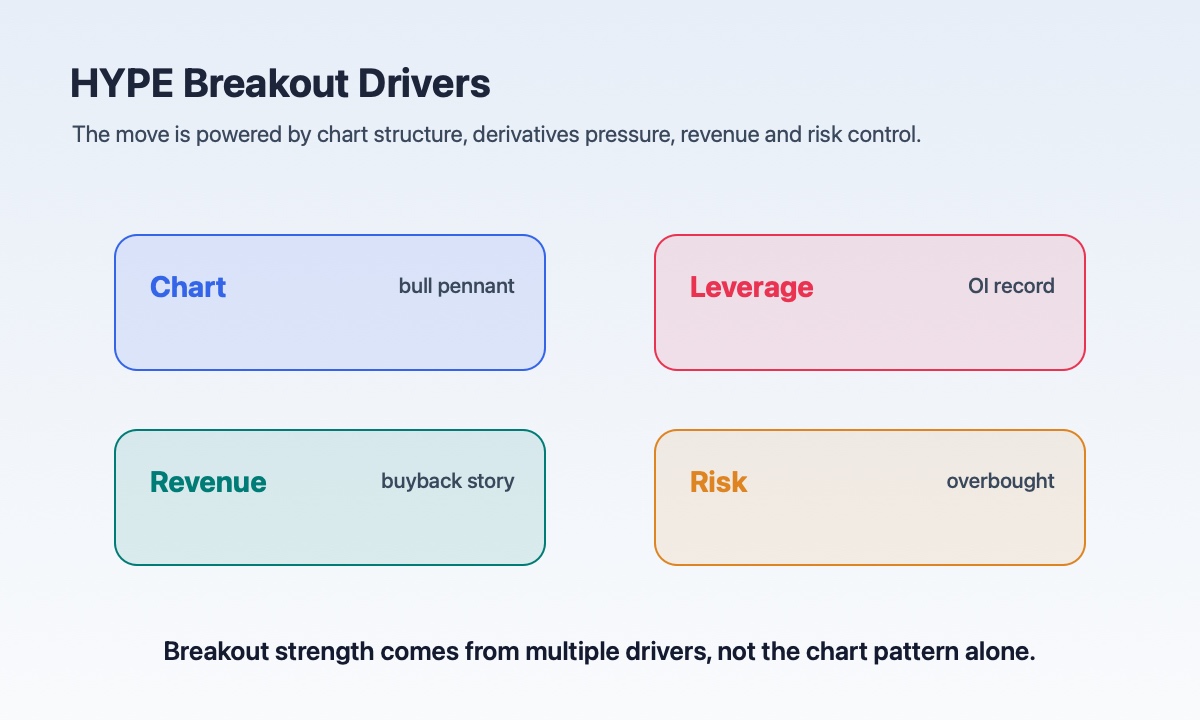
That turns trading activity into a buyback story. And once a token has a buyback story, traders tend to stop looking at it like a normal altcoin for a while. Dangerous? Sometimes. Powerful? Also yes.
Why This Matters for Altcoin and Crypto Markets
HYPE matters because it is not moving like a random small-cap altcoin catching a lucky candle. It is becoming one of the cleaner tests of whether crypto markets still reward protocols with visible usage, revenue and token demand loops.
This is the little machine investors are staring at:
More trading activity creates more fees. More fees strengthen the protocol revenue story. More revenue supports the Assistance Fund buyback narrative. That buyback narrative attracts more token demand. More token demand can push price higher, which brings more attention, more leverage and more volume.
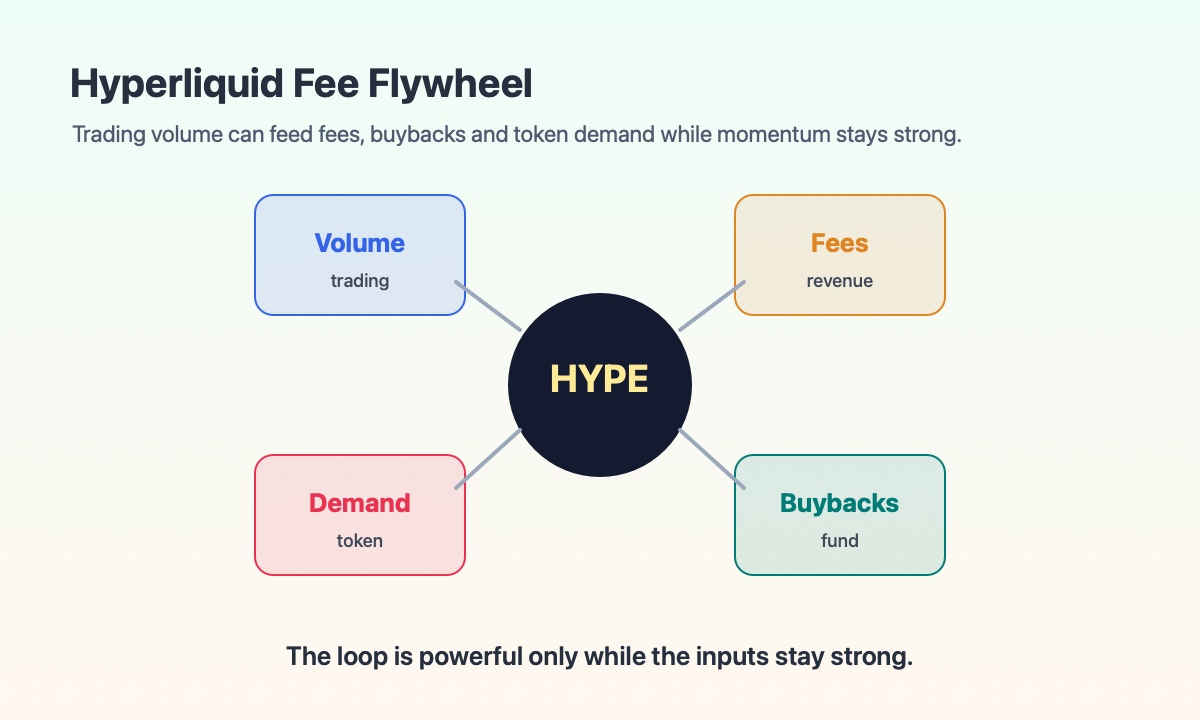
That is the flywheel.
The catch is that flywheels are not morality devices. They do not promise fair outcomes. They simply spin while the inputs are strong. If volume cools, if open interest becomes too crowded, or if HYPE loses key technical levels, the same market that celebrated the flywheel can suddenly discover gravity and become very philosophical about risk management.
For the broader altcoin market, HYPE's breakout is a signal that traders are willing to pay up for assets with a clear story. Not just "AI," not just "L1," not just a logo wearing sunglasses. A real story: product-market fit, derivatives volume, fee capture, buybacks and price discovery.
That is why this rally is important. It is not only about whether HYPE reaches $100. It is about whether the market is repricing crypto assets that can show something close to cash-flow gravity.
Historical Parallel: GMX and the Real-Yield Perpetual DEX Trade
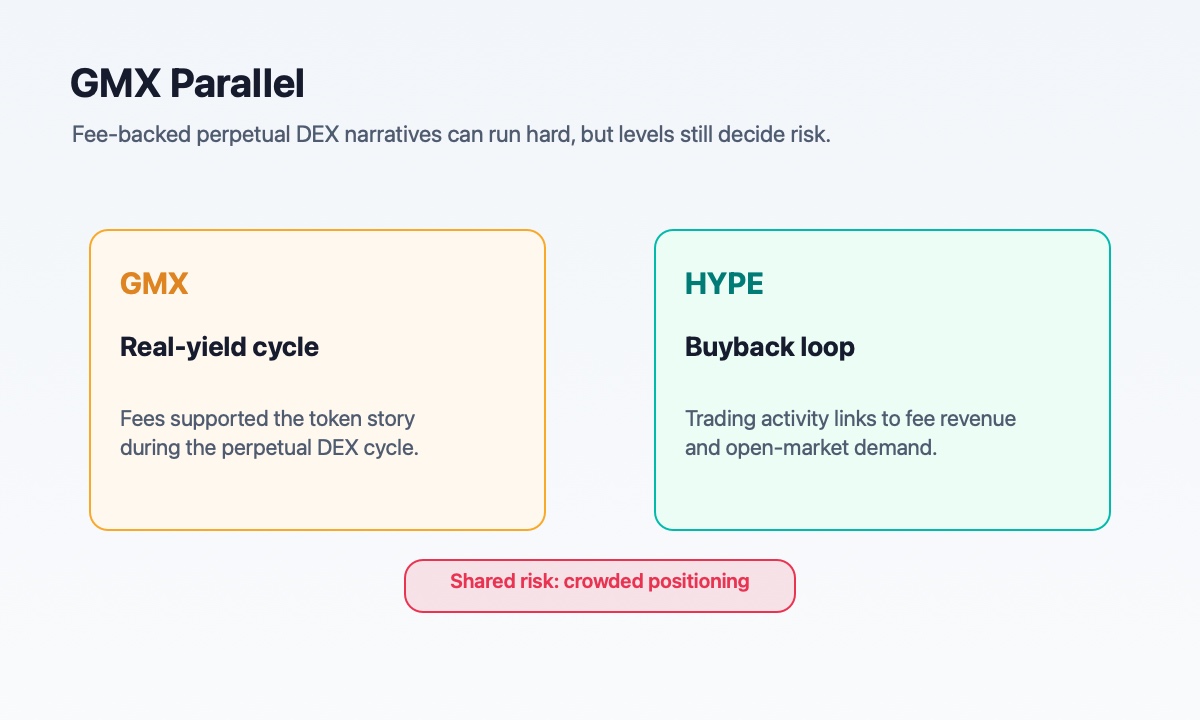
The closest historical parallel is GMX during the real-yield perpetual DEX cycle. GMX became one of the standout DeFi tokens because it offered a simple story that traders could understand without needing a ceremonial robe and seven whitepapers: people traded perpetuals, the protocol collected fees, and token holders had a visible link to that fee activity through the protocol's economic design.
At the time, this mattered because much of DeFi had been running on emissions. Tokens were often valuable because they were paid out to attract liquidity, not because the protocol underneath had a durable revenue engine. GMX felt different. It gave the market a cleaner equation: usage could translate into fees, and fees could support the token narrative. DefiLlama still tracks GMX fee data today, with all-time fees in the hundreds of millions of dollars, which is why the comparison is not just a vibe wearing a spreadsheet costume.
HYPE is similar because Hyperliquid is also tied to perpetual trading, fee generation and a token-demand mechanism. In both cases, the market is not only buying a chart. It is buying the idea that a derivatives venue can create recurring economic pressure behind the token.
But the differences are important. GMX was mostly a DeFi real-yield story inside a more fragmented onchain trading world. Hyperliquid is trying to be a much larger, faster and more vertically integrated trading venue. HYPE also has a stronger price-discovery and leverage component right now, with open interest and short liquidations doing part of the work.
The lesson is not that HYPE must copy GMX. Markets are not photocopiers, thankfully. The lesson is that fee-backed token narratives can run hard when revenue growth and price structure confirm each other. But once positioning gets crowded, the same narrative needs support from actual levels. For HYPE, that means $68-$70 and then $58-$62 matter more than the dream number on the headline.
HYPE Price Reaction and K-Line Analysis
The HYPE chart is doing the thing strong charts do when they start making people uncomfortable: it keeps holding higher levels even after everyone agrees it is overbought.
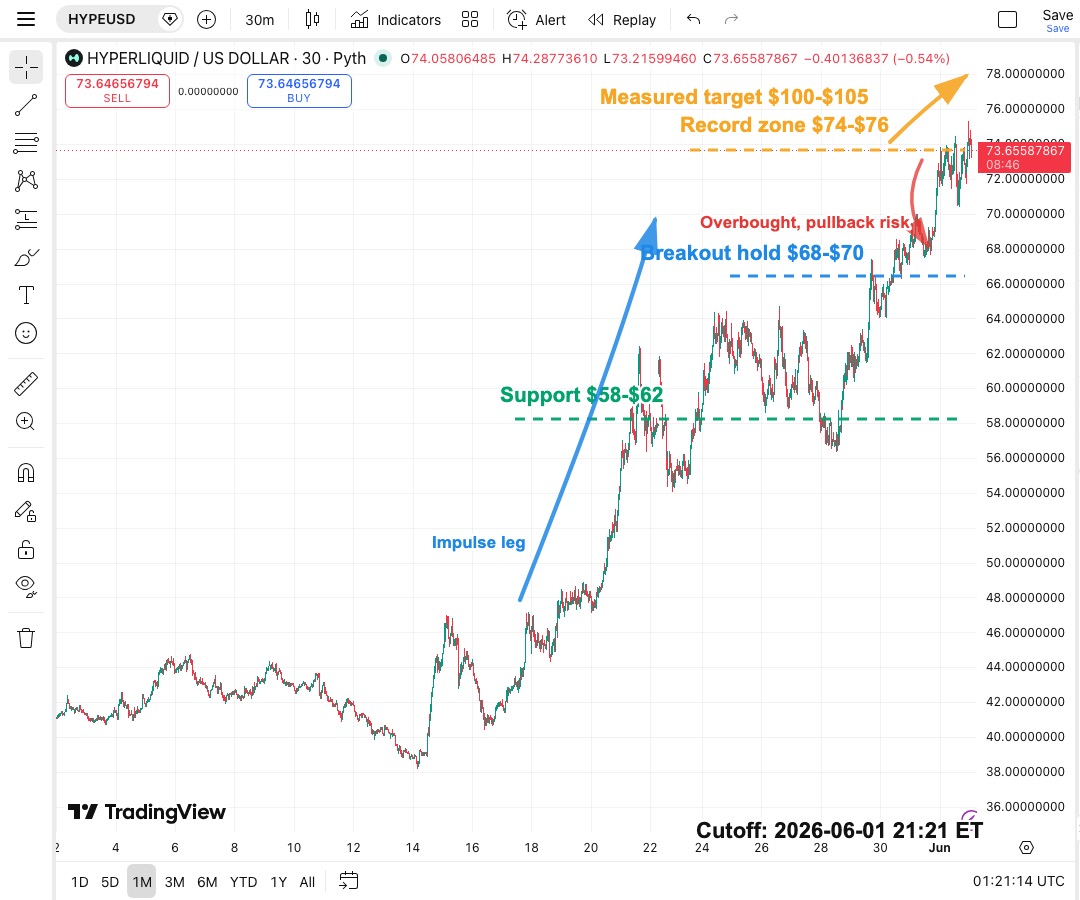
On the 30-minute HYPEUSD TradingView chart, the useful window is the last month, not a wide historical chart that makes the current breakout look like a tiny footnote. The move began with a climb from the low-$40s, accelerated into the $58-$62 zone, consolidated, then broke into the $70s.
The first important level is $74-$76. This is the current record zone. If HYPE can keep accepting price here, the $100-$105 measured target remains alive as a technical objective. That does not mean price teleports there because a pattern said so. The chart is not a vending machine. It means the structure still supports upside continuation if buyers keep defending higher levels.
The second level is $68-$70. This is the breakout hold area. For a clean continuation setup, HYPE should not spend too much time back below this zone. A quick wick is one thing. A sustained rejection is another.
The third level is $58-$62. This is the support shelf that matters if the rally cools. It lines up with the prior consolidation and the article's 20-day EMA reference near $58.32. If HYPE falls into that area and stabilizes, the broader bullish structure can survive. If it slices through it, the $100 target becomes less of a forecast and more of a motivational poster.
Momentum risk is real. The article cited RSI above 77, which is classic overbought territory. Overbought does not mean "must crash." It means the market is stretched enough that late buyers are paying for speed. Speed is wonderful until it sends you the invoice.
Key Levels to Watch
- Record zone: $74-$76
- Breakout hold: $68-$70
- First support shelf: $58-$62
- Measured upside target: $100-$105
- Bullish continuation signal: acceptance above $76 with rising volume
- Bearish invalidation: sustained breakdown below $58
Conditional Forecast
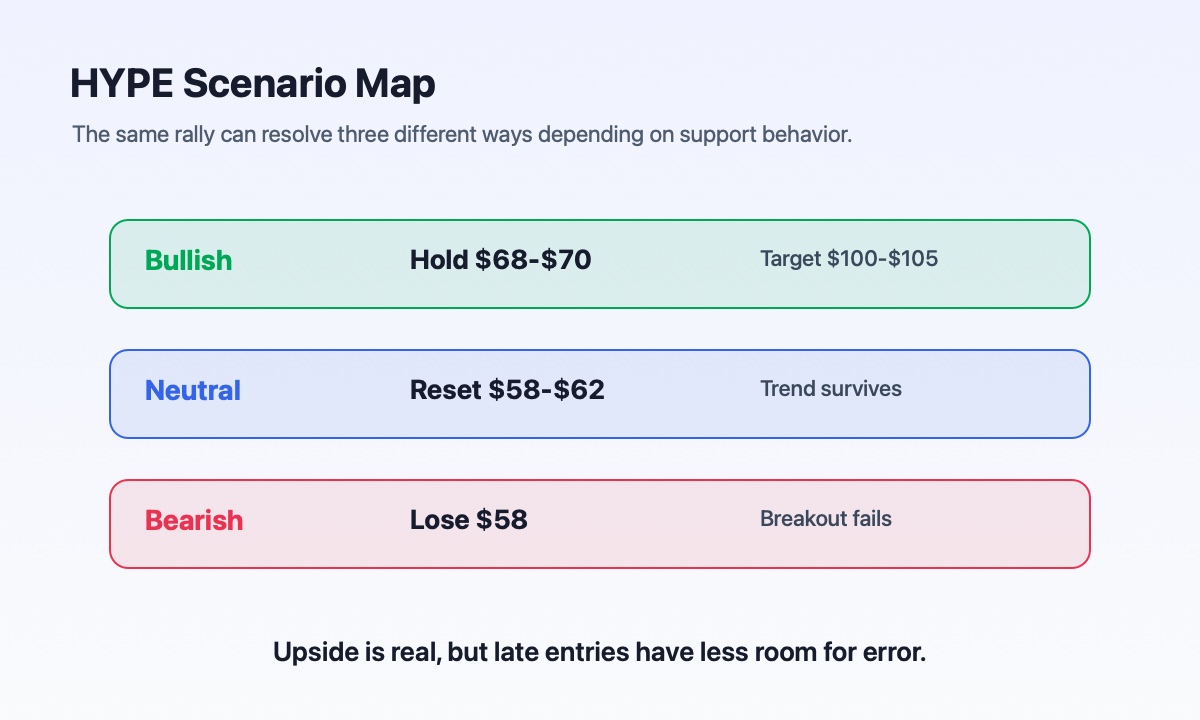
The bullish case is clean. If HYPE holds $68-$70 and then pushes through $76 with volume, the market can keep targeting the measured $100-$105 zone. In that scenario, the chart, open interest, short-squeeze pressure and fee-buyback narrative are still pulling in the same direction.
The neutral case is a reset. HYPE loses $68-$70 but finds buyers in the $58-$62 shelf. That would cool the RSI, shake out weak leverage and keep the broader uptrend alive. It would feel ugly in real time, which is usually how healthy pullbacks prefer to dress.
The bearish case begins below $58. A sustained breakdown there would tell us the breakout is no longer being defended. At that point, the story may still be good, but the market would be saying that the story has become too crowded for the current price.
My base case: HYPE can still work higher, but the trade has shifted from early breakout to high-momentum continuation. That means the upside is real, but the margin for sloppy entries is thinner.
Investment Takeaway
HYPE is not a simple meme-style chase. It has a real market structure behind it: strong price action, rising derivatives demand, protocol revenue and a buyback mechanism that gives traders a reason to treat volume as token-relevant.
But that does not make it safe. It makes it interesting.
The best way to think about HYPE now is as a three-part test. Does price hold $68-$70? Does Hyperliquid keep producing strong revenue? Does leverage stay supportive without becoming a crowded accident waiting politely near the door?
If the answer stays yes, the $100-$105 target is not ridiculous. If the answer turns no, the chart will probably say so before the narrative admits it.
That is usually how these things go. The chart starts clearing its throat first.
Sources
- Cointelegraph: Hyperliquid's HYPE breakout puts $100 price target in play
- TradingView: HYPEUSD chart
- DefiLlama API: Hyperliquid revenue overview
- DefiLlama API: GMX fees summary
- CoinGlass: Crypto futures open interest and liquidation data
- SoSoValue: US Spot HYPE ETF flows cited by Cointelegraph
|
DISCLAIMER:
1. All content on this website (including but not limited to articles, data, charts, and analyses) is for general informational purposes only and does not constitute any form of investment advice, trading recommendation, or financial guidance. 2. Cryptocurrencies and digital assets are subject to extreme price volatility and high investment risk; you may lose part or all of your principal. Past performance does not predict future results. 3. The information on this website is based on sources we believe to be reliable, but we do not guarantee its accuracy, completeness, or timeliness. Any investment decisions made based on this website’s information are at your own risk. 4. We strongly recommend that you conduct your own thorough research and consult an independent, licensed financial advisor before making any investment decisions. |
Recommended reading
Latest News