Key Takeaways
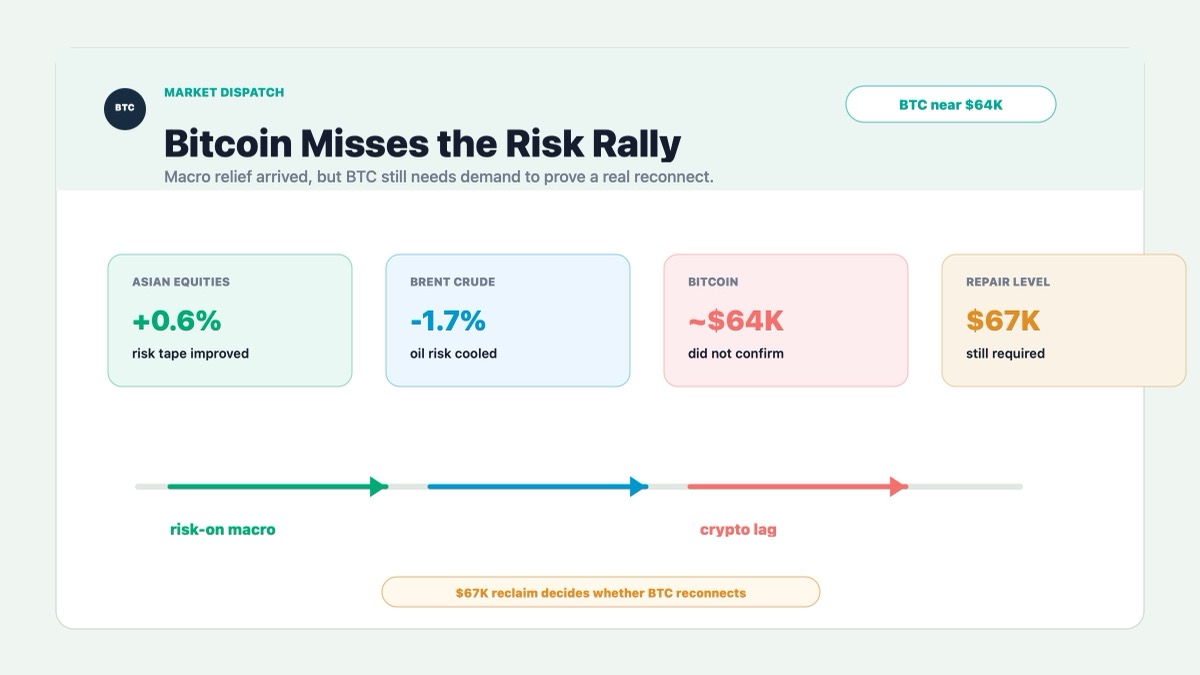
- Bitcoin slipped below $60,000, traded near $59,940 on Sunday, and was down nearly 7% for the week.
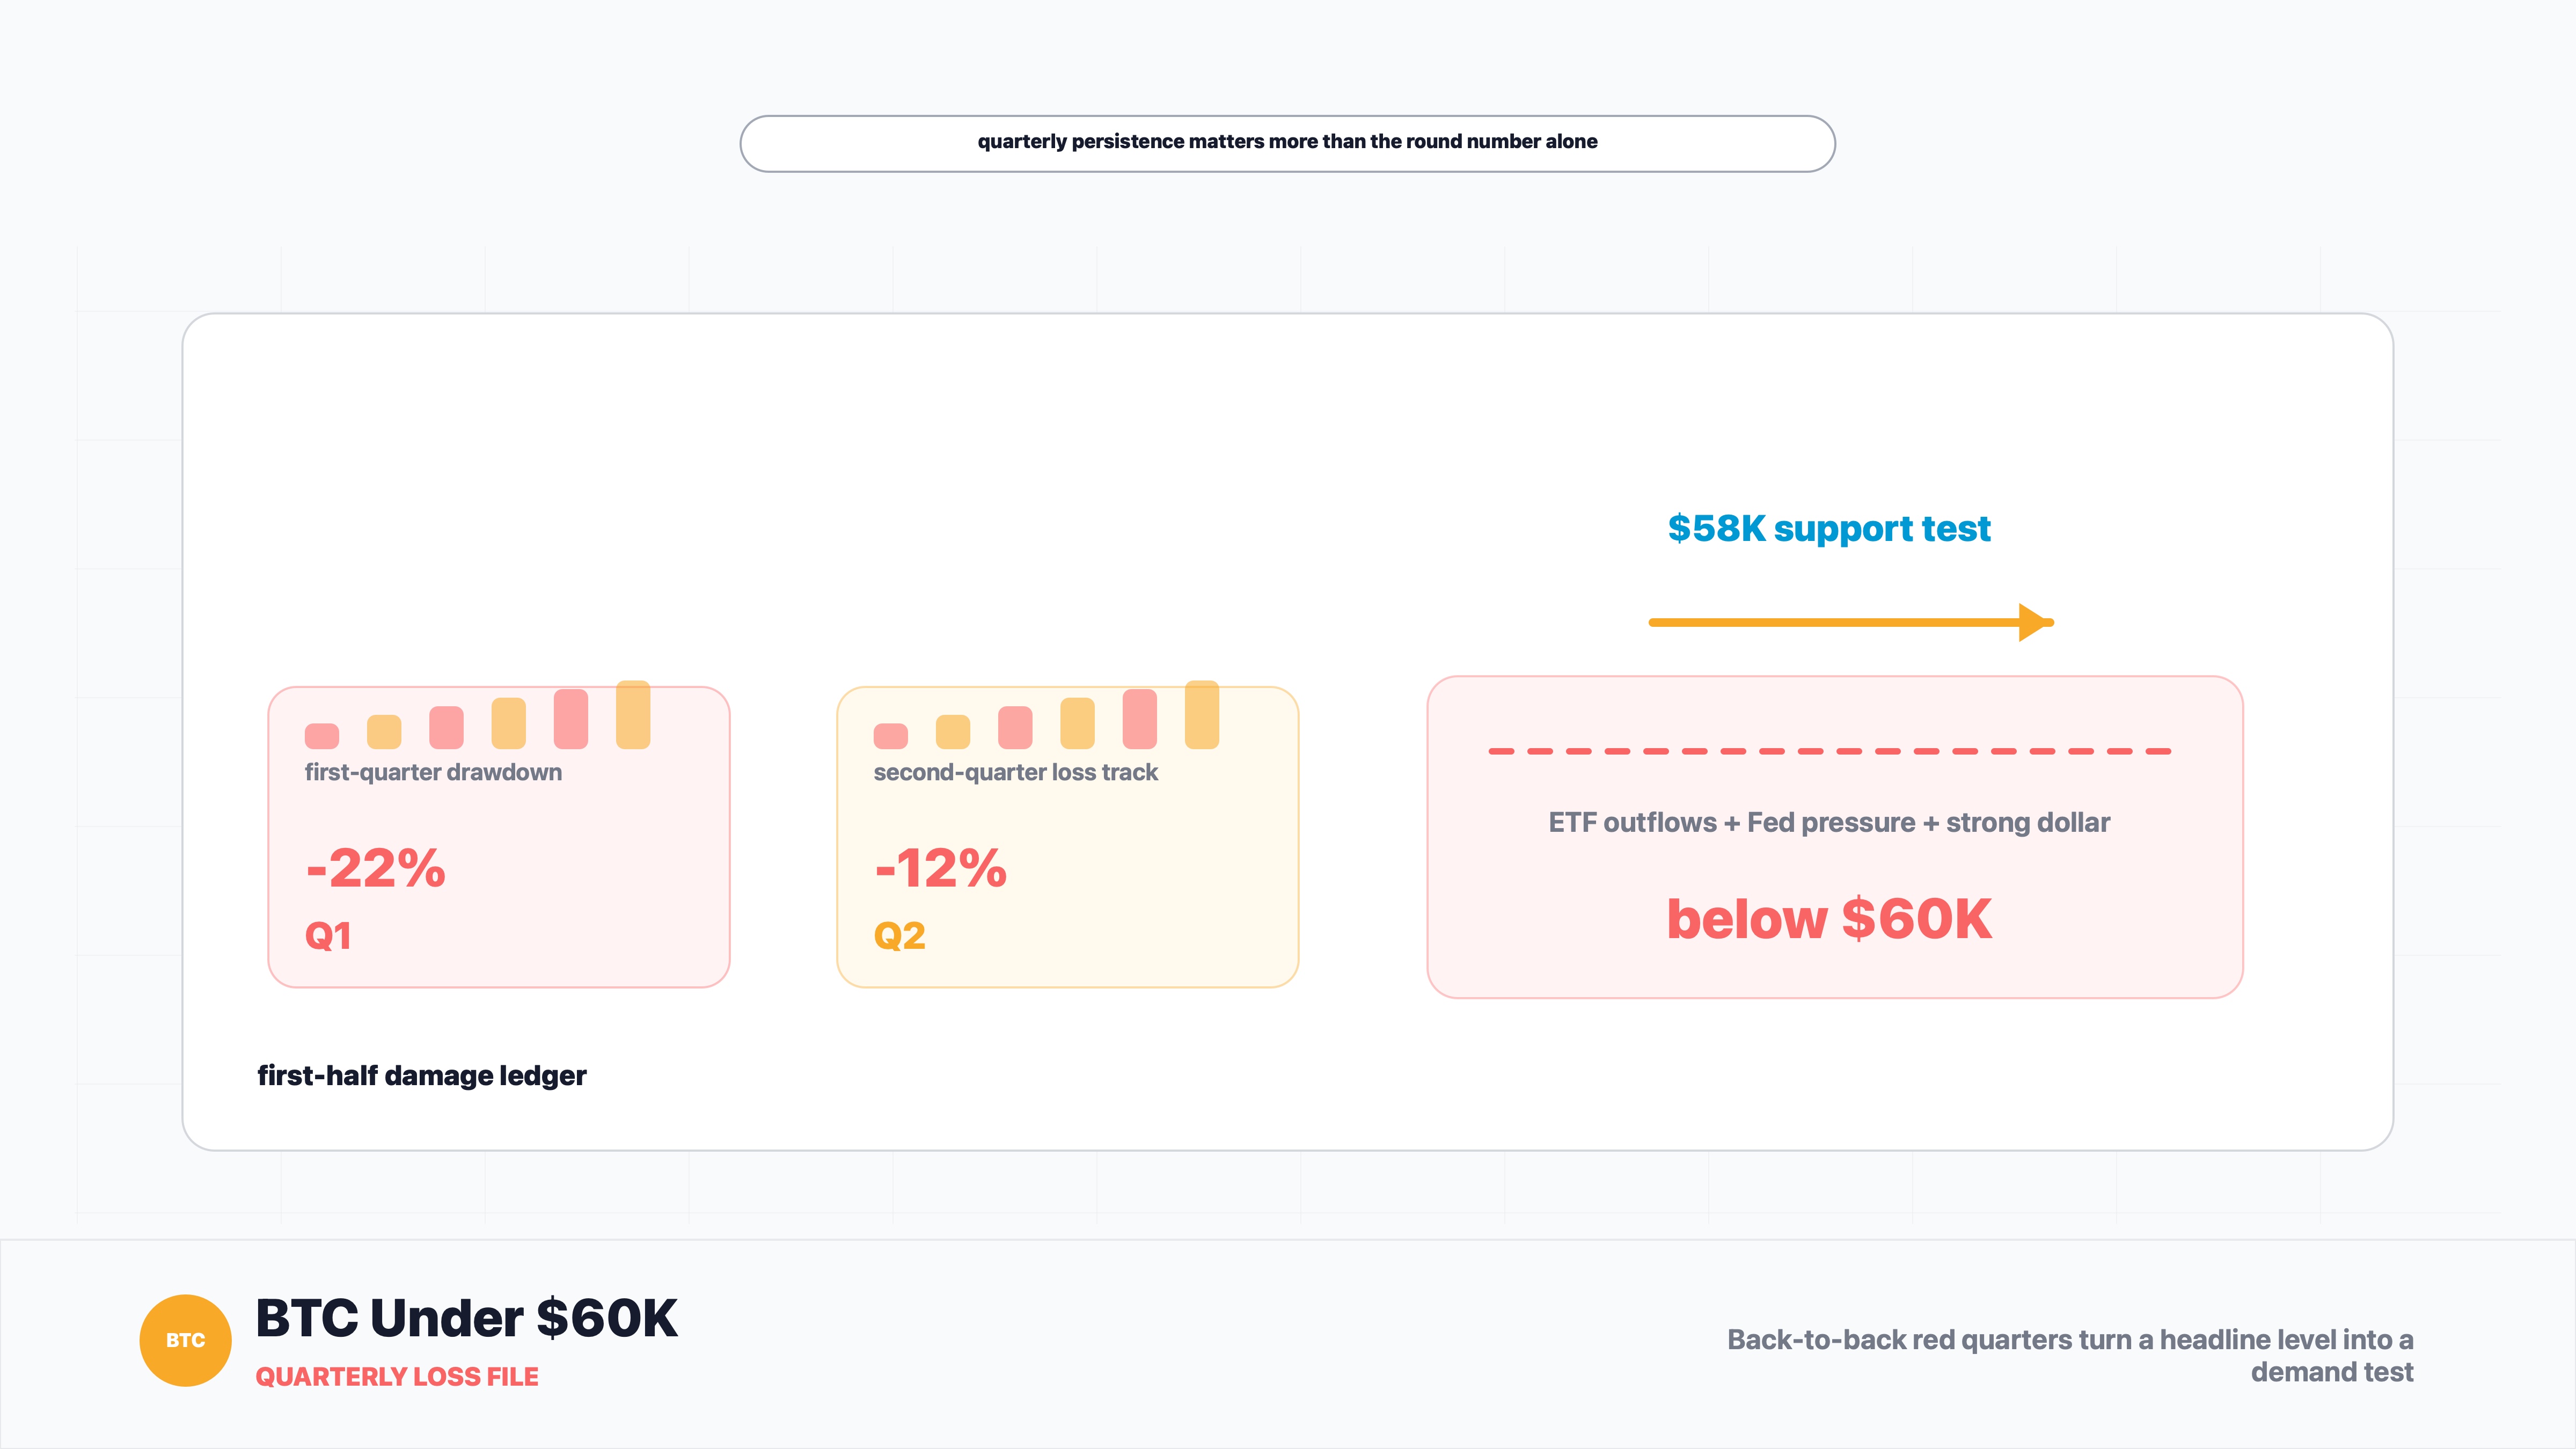
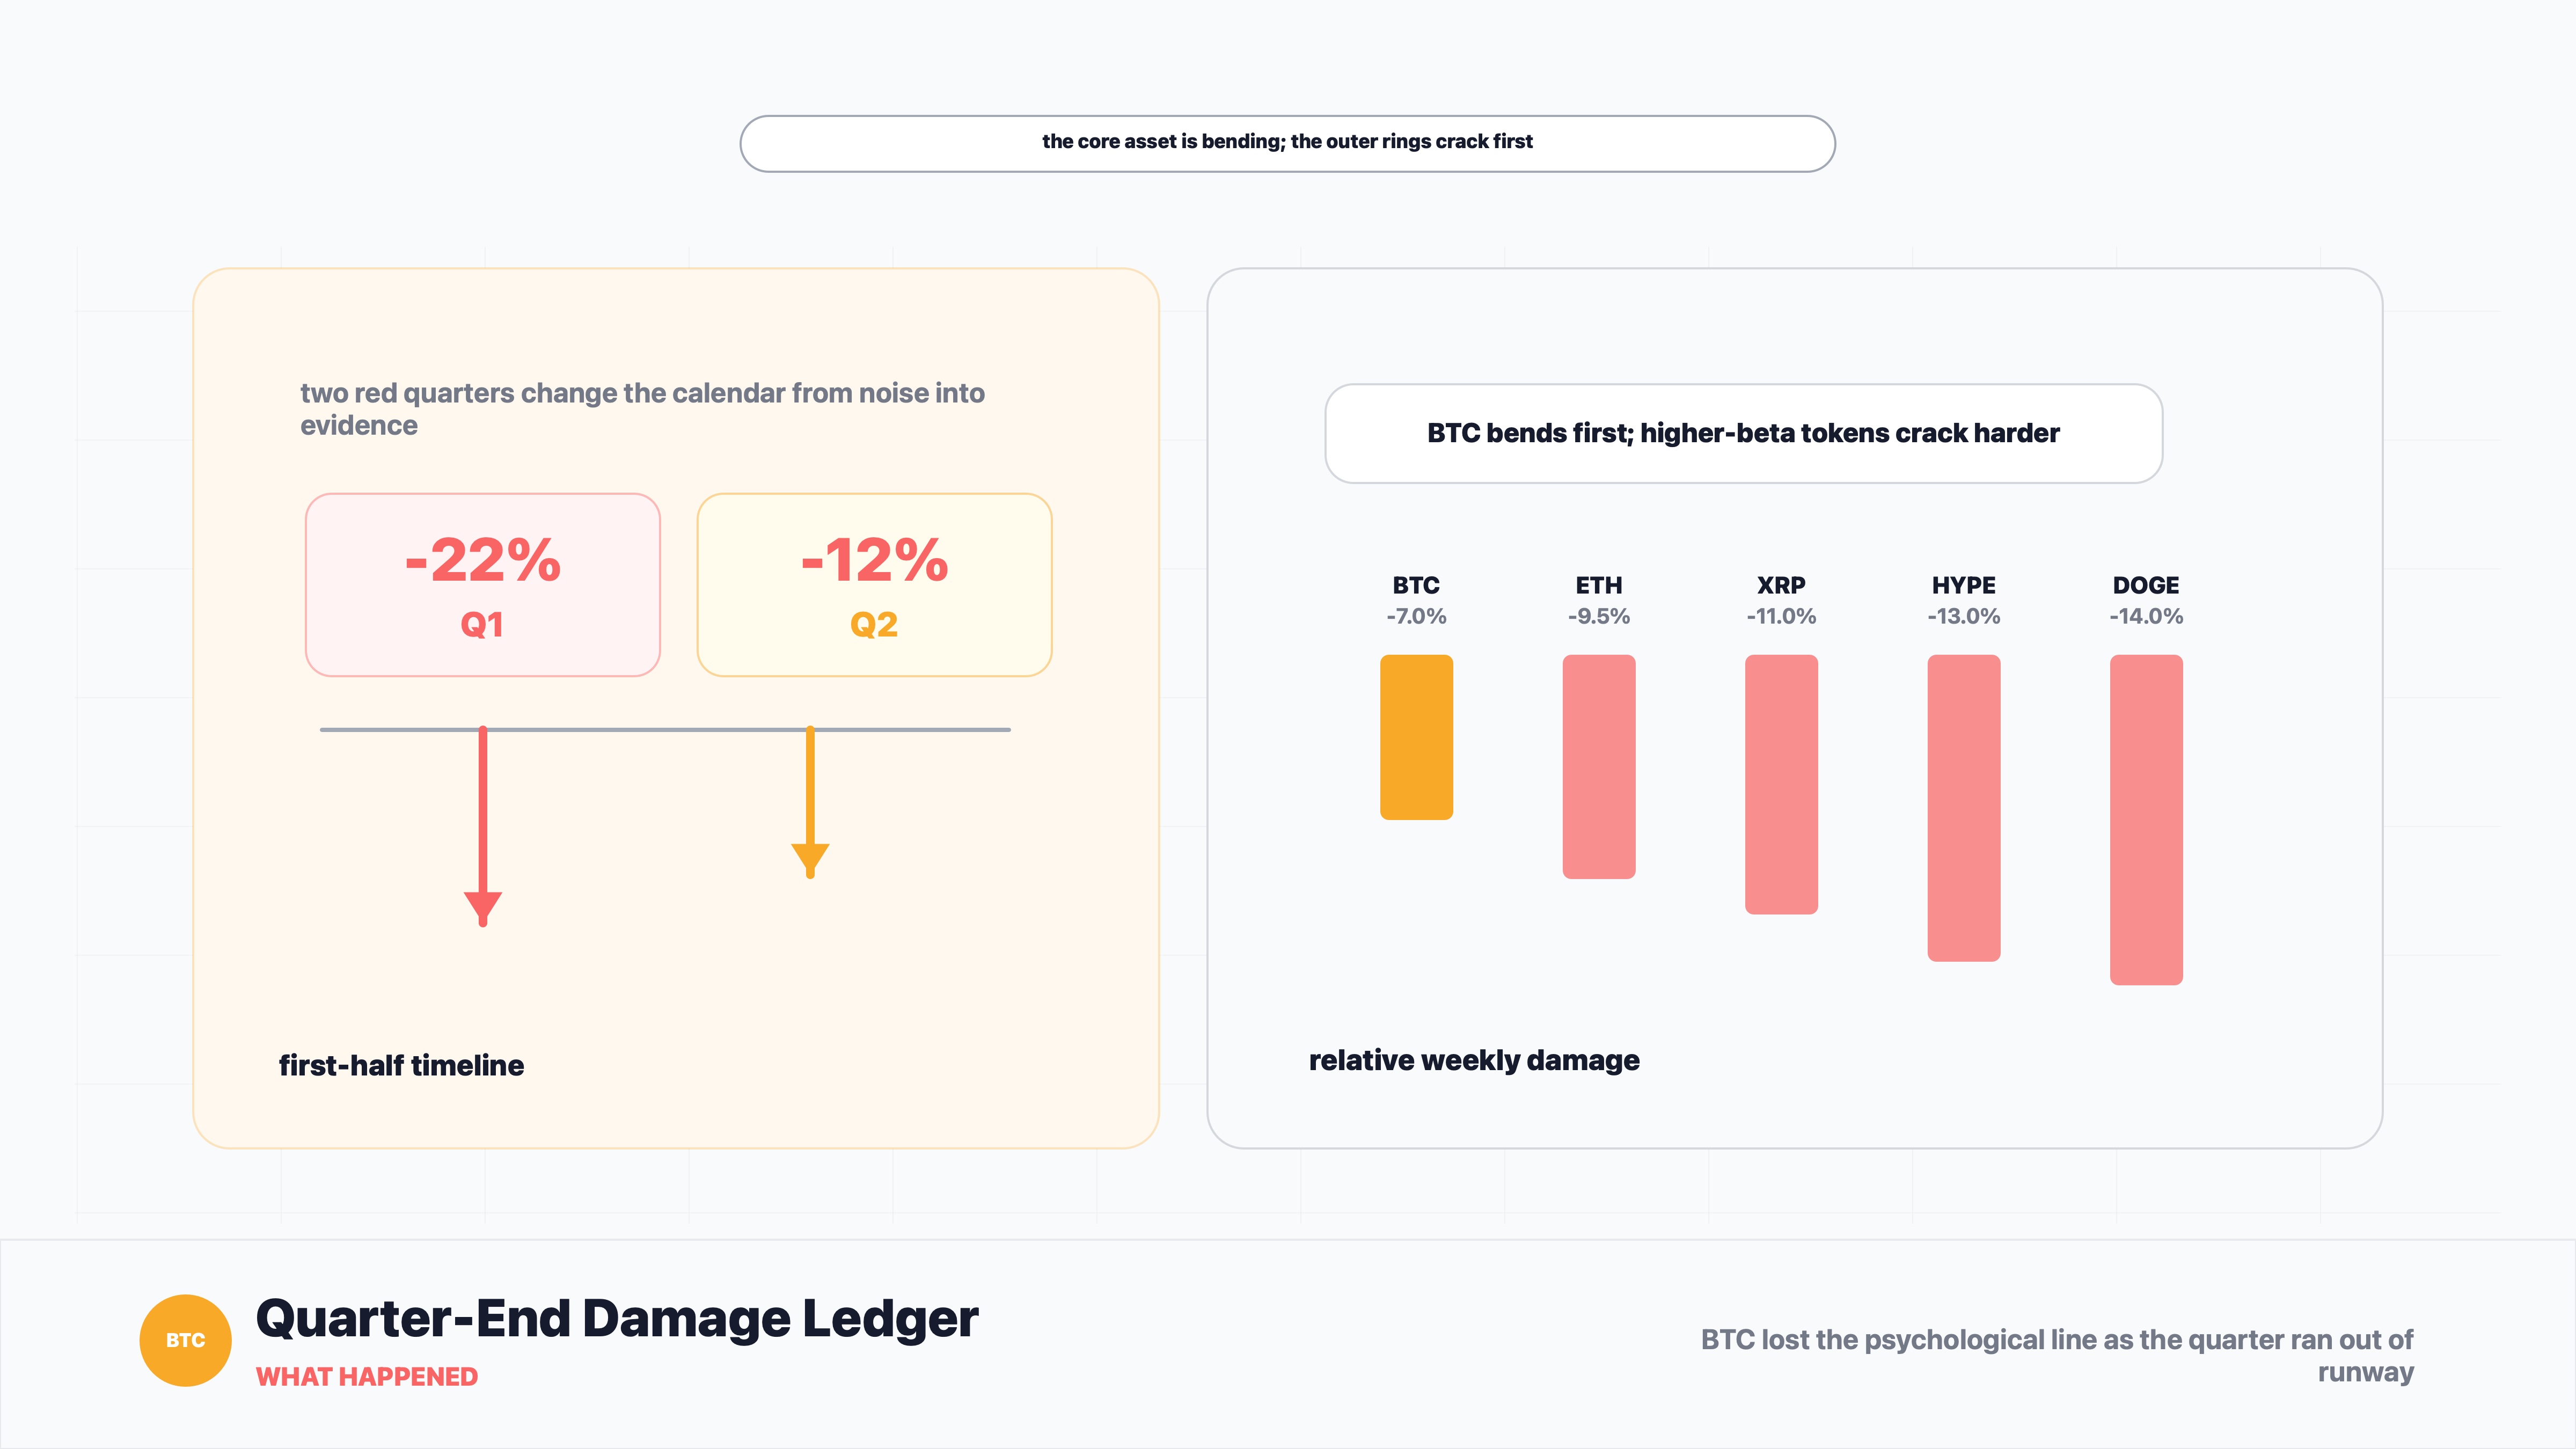
- BTC is on track for a roughly 12% second-quarter loss after falling about 22% in the first quarter.
- Ether and higher-beta tokens are taking the harder hit, while Solana and Tron have held up better.
- The chart now turns on a simple test: reclaim $60K, or risk turning a weak quarter into a deeper trend problem.
What Happened
Bitcoin did not just lose a round number. It lost a round number at the wrong part of the calendar.
BTC slipped below $60,000 over the weekend and traded around $59,940 on Sunday, according to CoinDesk. The move left bitcoin down 0.6% over 24 hours and nearly 7% for the week, with only a couple of trading days left in the second quarter.
The quarter is the part that matters. Bitcoin is now on track to finish Q2 down about 12%, after dropping roughly 22% in Q1. Two red quarters at the start of a year are unusual for bitcoin. The market has had six months to turn the page, and so far it has mostly managed to keep reading the same bad paragraph.
The damage is broader than BTC. Ether fell about 9.5% on the week to roughly $1,567, and is down about 25% for the quarter after a 29% first-quarter drop. Dogecoin, HYPE and XRP suffered heavier weekly losses, while Solana and Tron were relatively more resilient.
That split tells us something useful. This is not a market where risk appetite is quietly rebuilding underneath the surface. Bitcoin is weak, but many altcoins are weaker. The core asset is bending; the outer rings are cracking first.
Why This Matters for Bitcoin and Crypto Markets
At first glance, this looks like a normal crypto selloff with a famous number attached to it. Bitcoin under $60K sounds important because $60K is clean, memorable and easy to put in a headline.
But the cleaner number is not always the deeper number. The deeper number is two.
Two quarters. Two failed attempts to make the first half look like accumulation instead of distribution. Two separate reporting periods in which dip-buyers had time to appear, ETF demand had time to absorb supply, and macro pressure had time to cool. None of that has been enough yet.
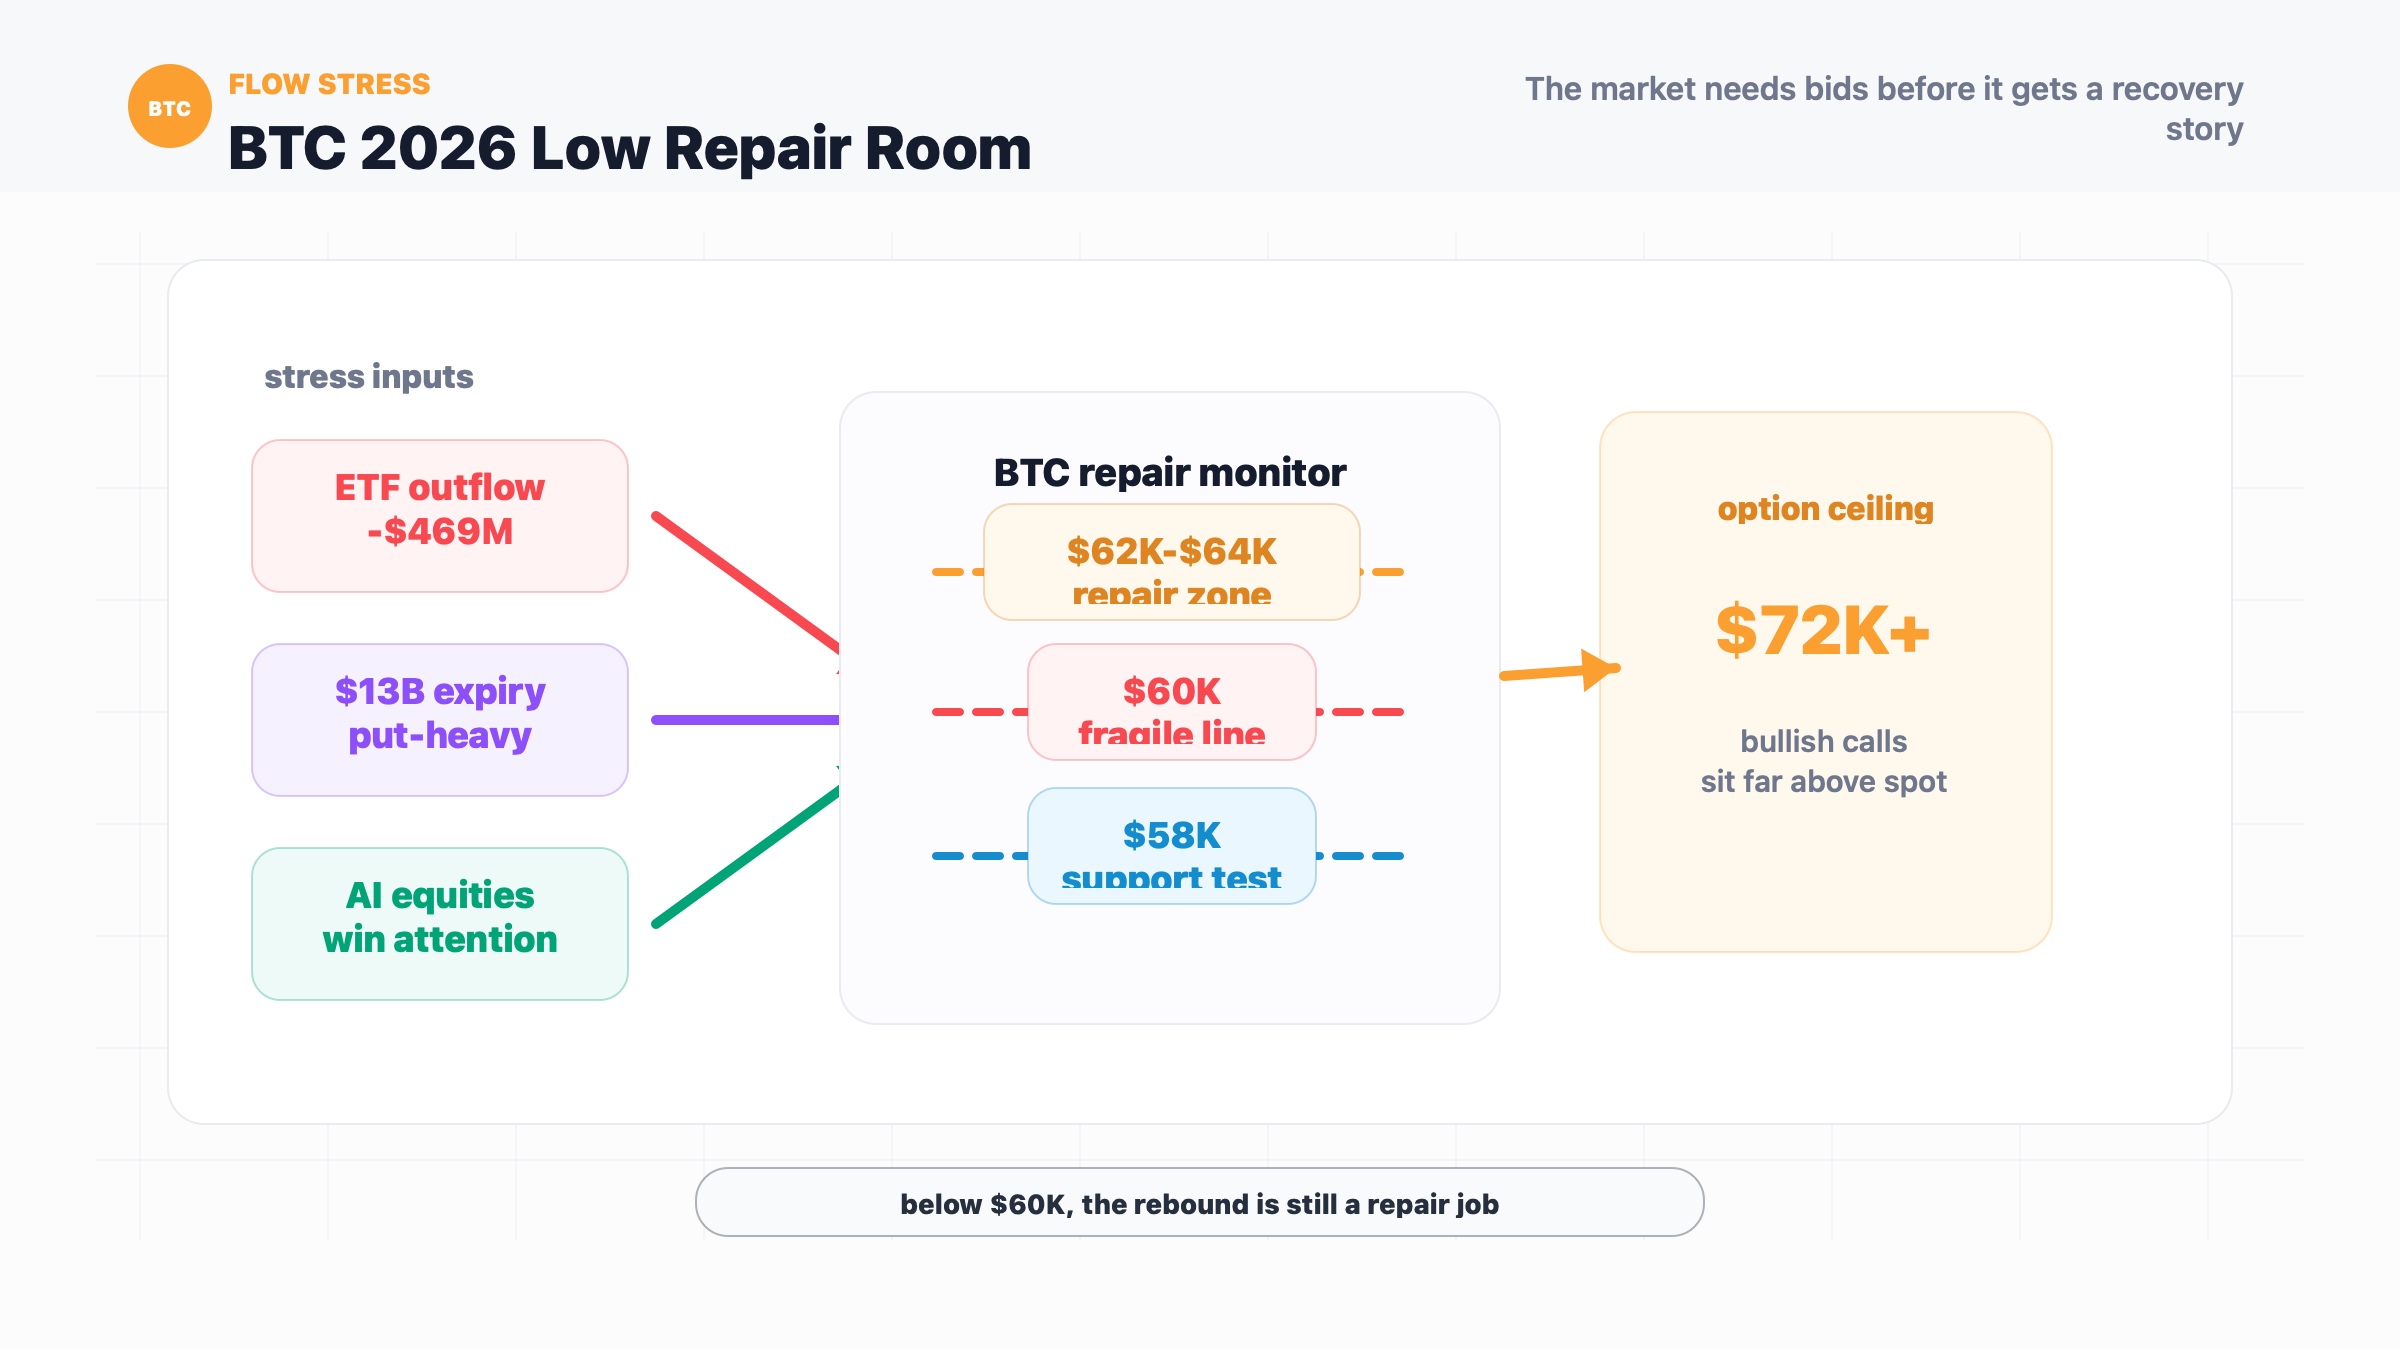
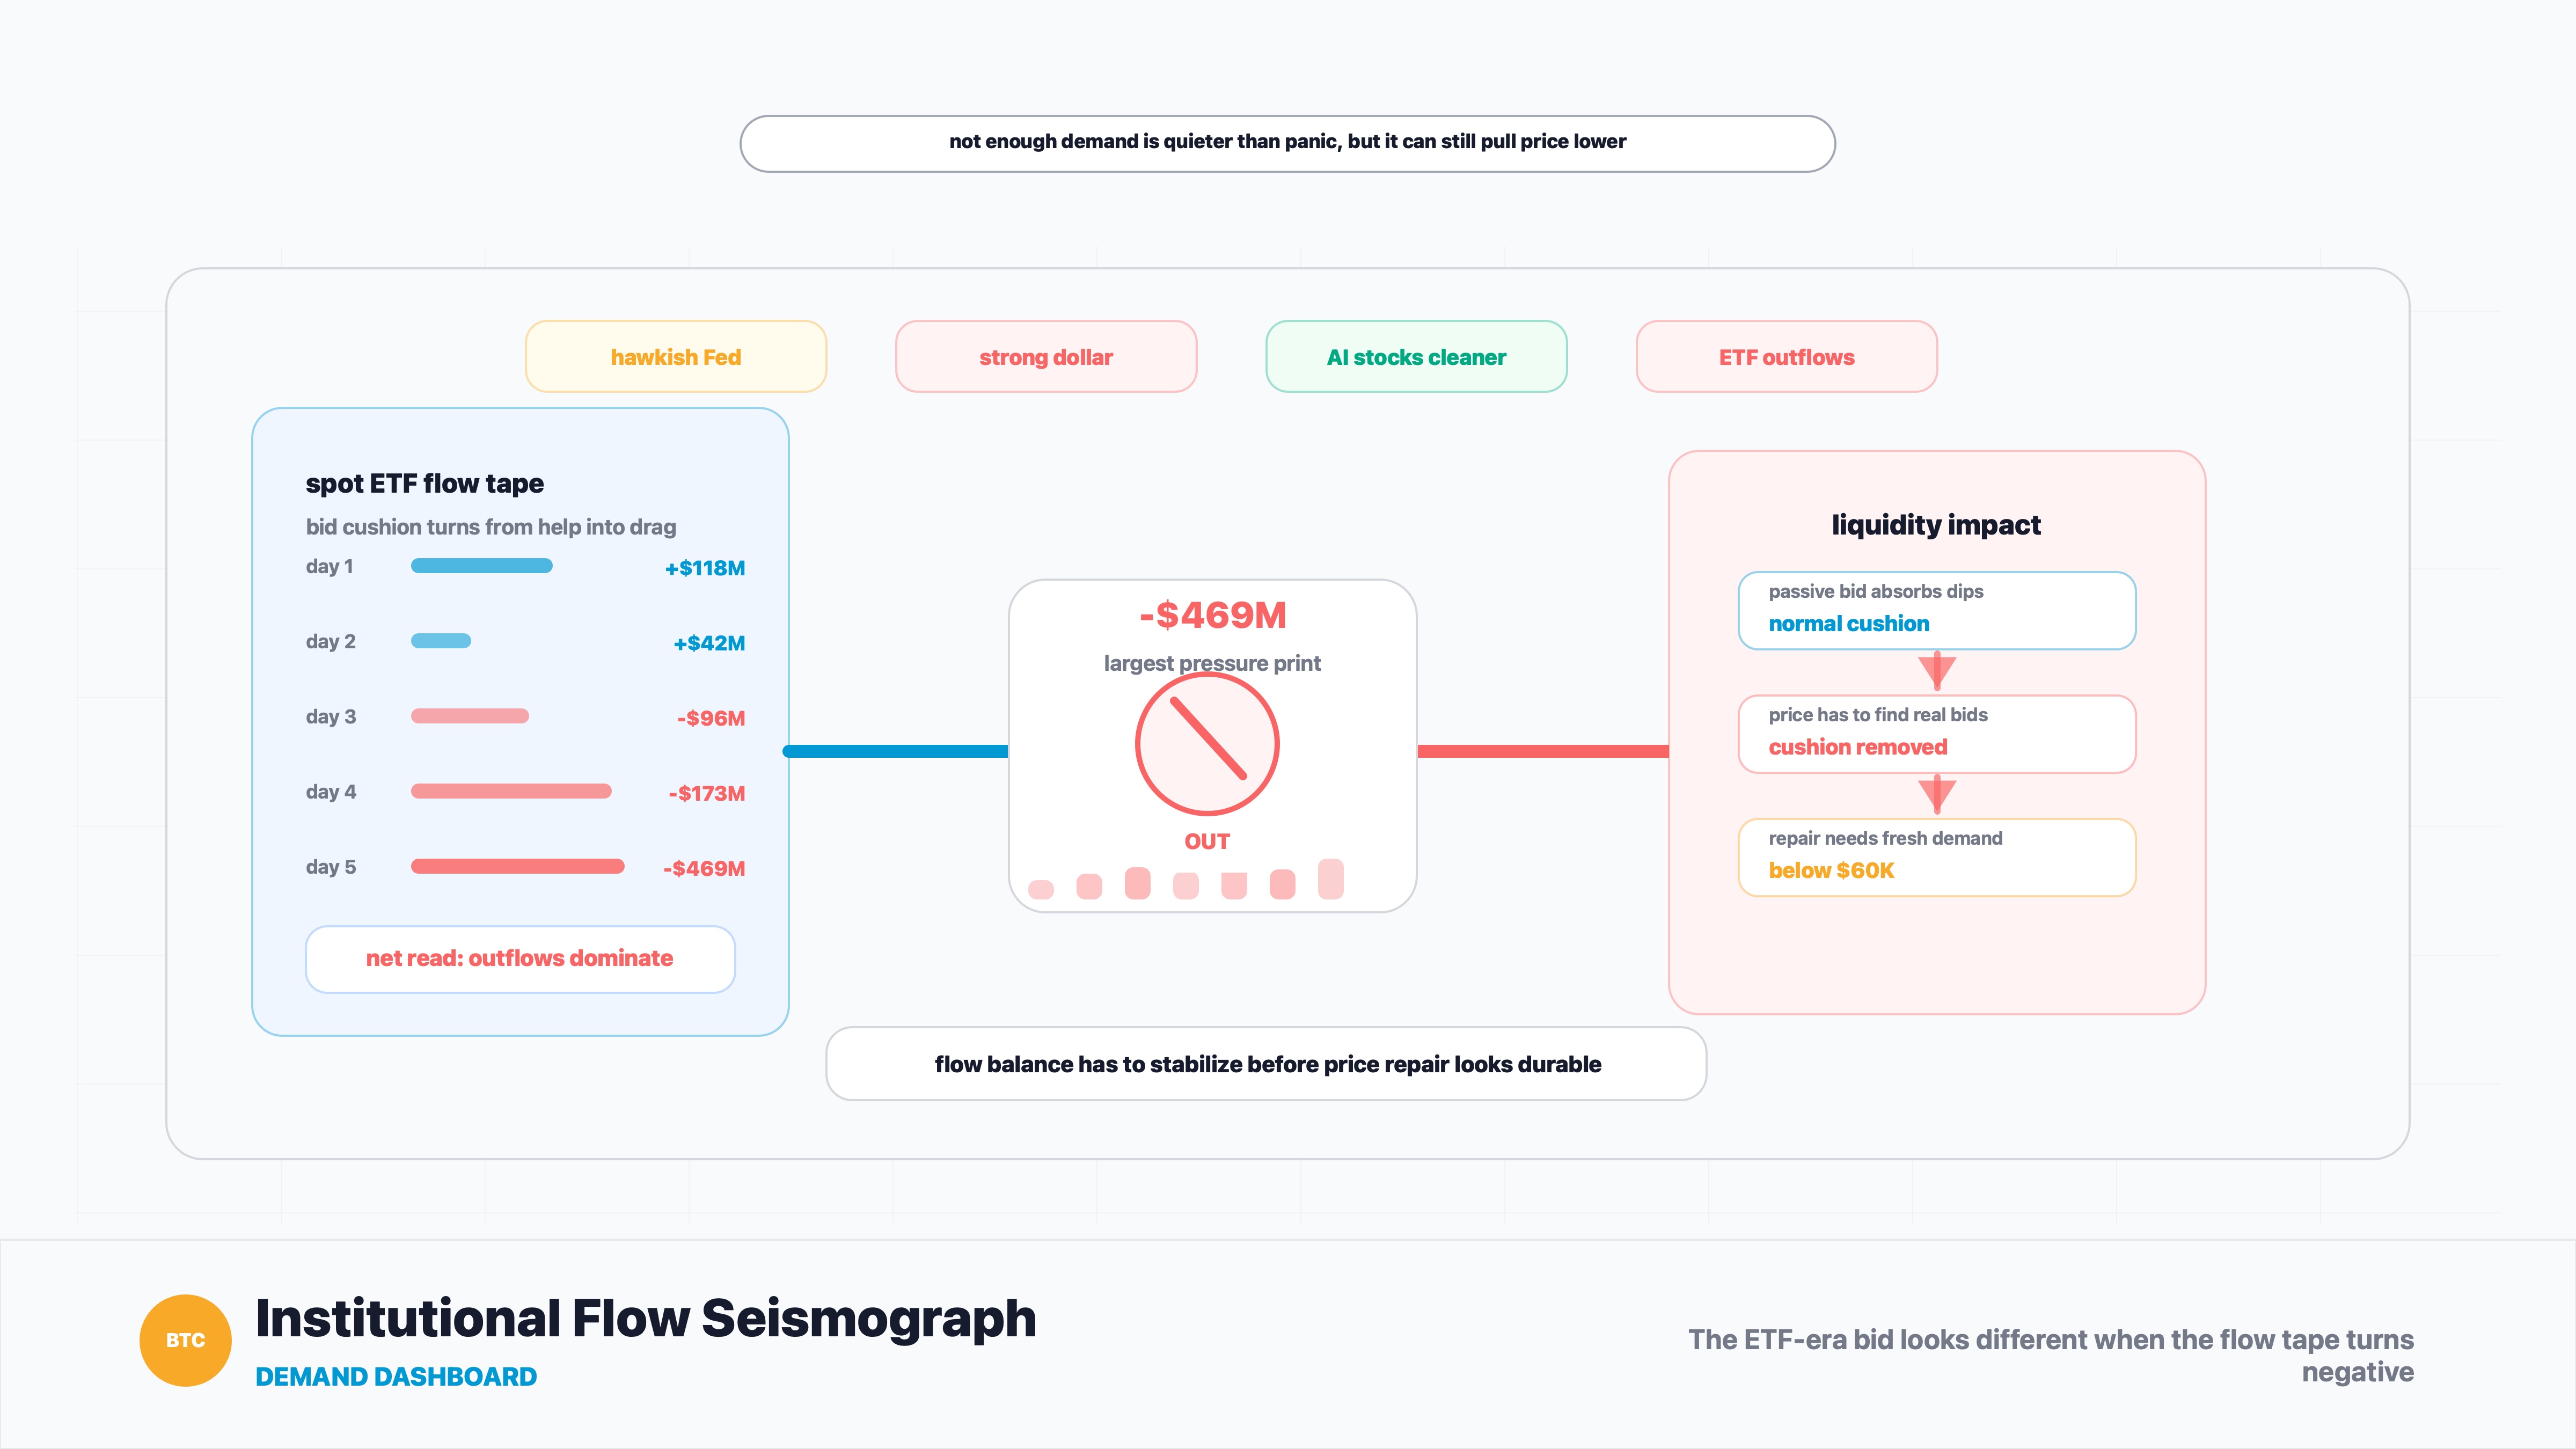
CoinDesk pointed to several overlapping pressures: U.S. spot bitcoin ETF outflows, a hawkish Federal Reserve, a strong dollar, tech-stock weakness and capital moving toward AI-linked semiconductor and memory-chip stocks. Each one is its own little leak. Together, they become the thing the market hates most: a story where nobody has to panic for price to keep sliding.
That matters because bitcoin entered the ETF era with a new promise. The market was supposed to have a steadier institutional bid. Sometimes it does. But ETFs also make weak demand visible. When flows turn negative, the wrapper that once looked like a machine for absorbing supply can start looking like a scoreboard for hesitation.
For altcoins, the message is sharper. If BTC cannot hold the psychological center, traders usually do not pay premium prices for the edges. That is why ETH, DOGE, XRP and HYPE falling harder than bitcoin matters. It is the market saying, in its blunt little way, that liquidity is still choosing safety inside crypto rather than adventure inside crypto.
Historical Parallel
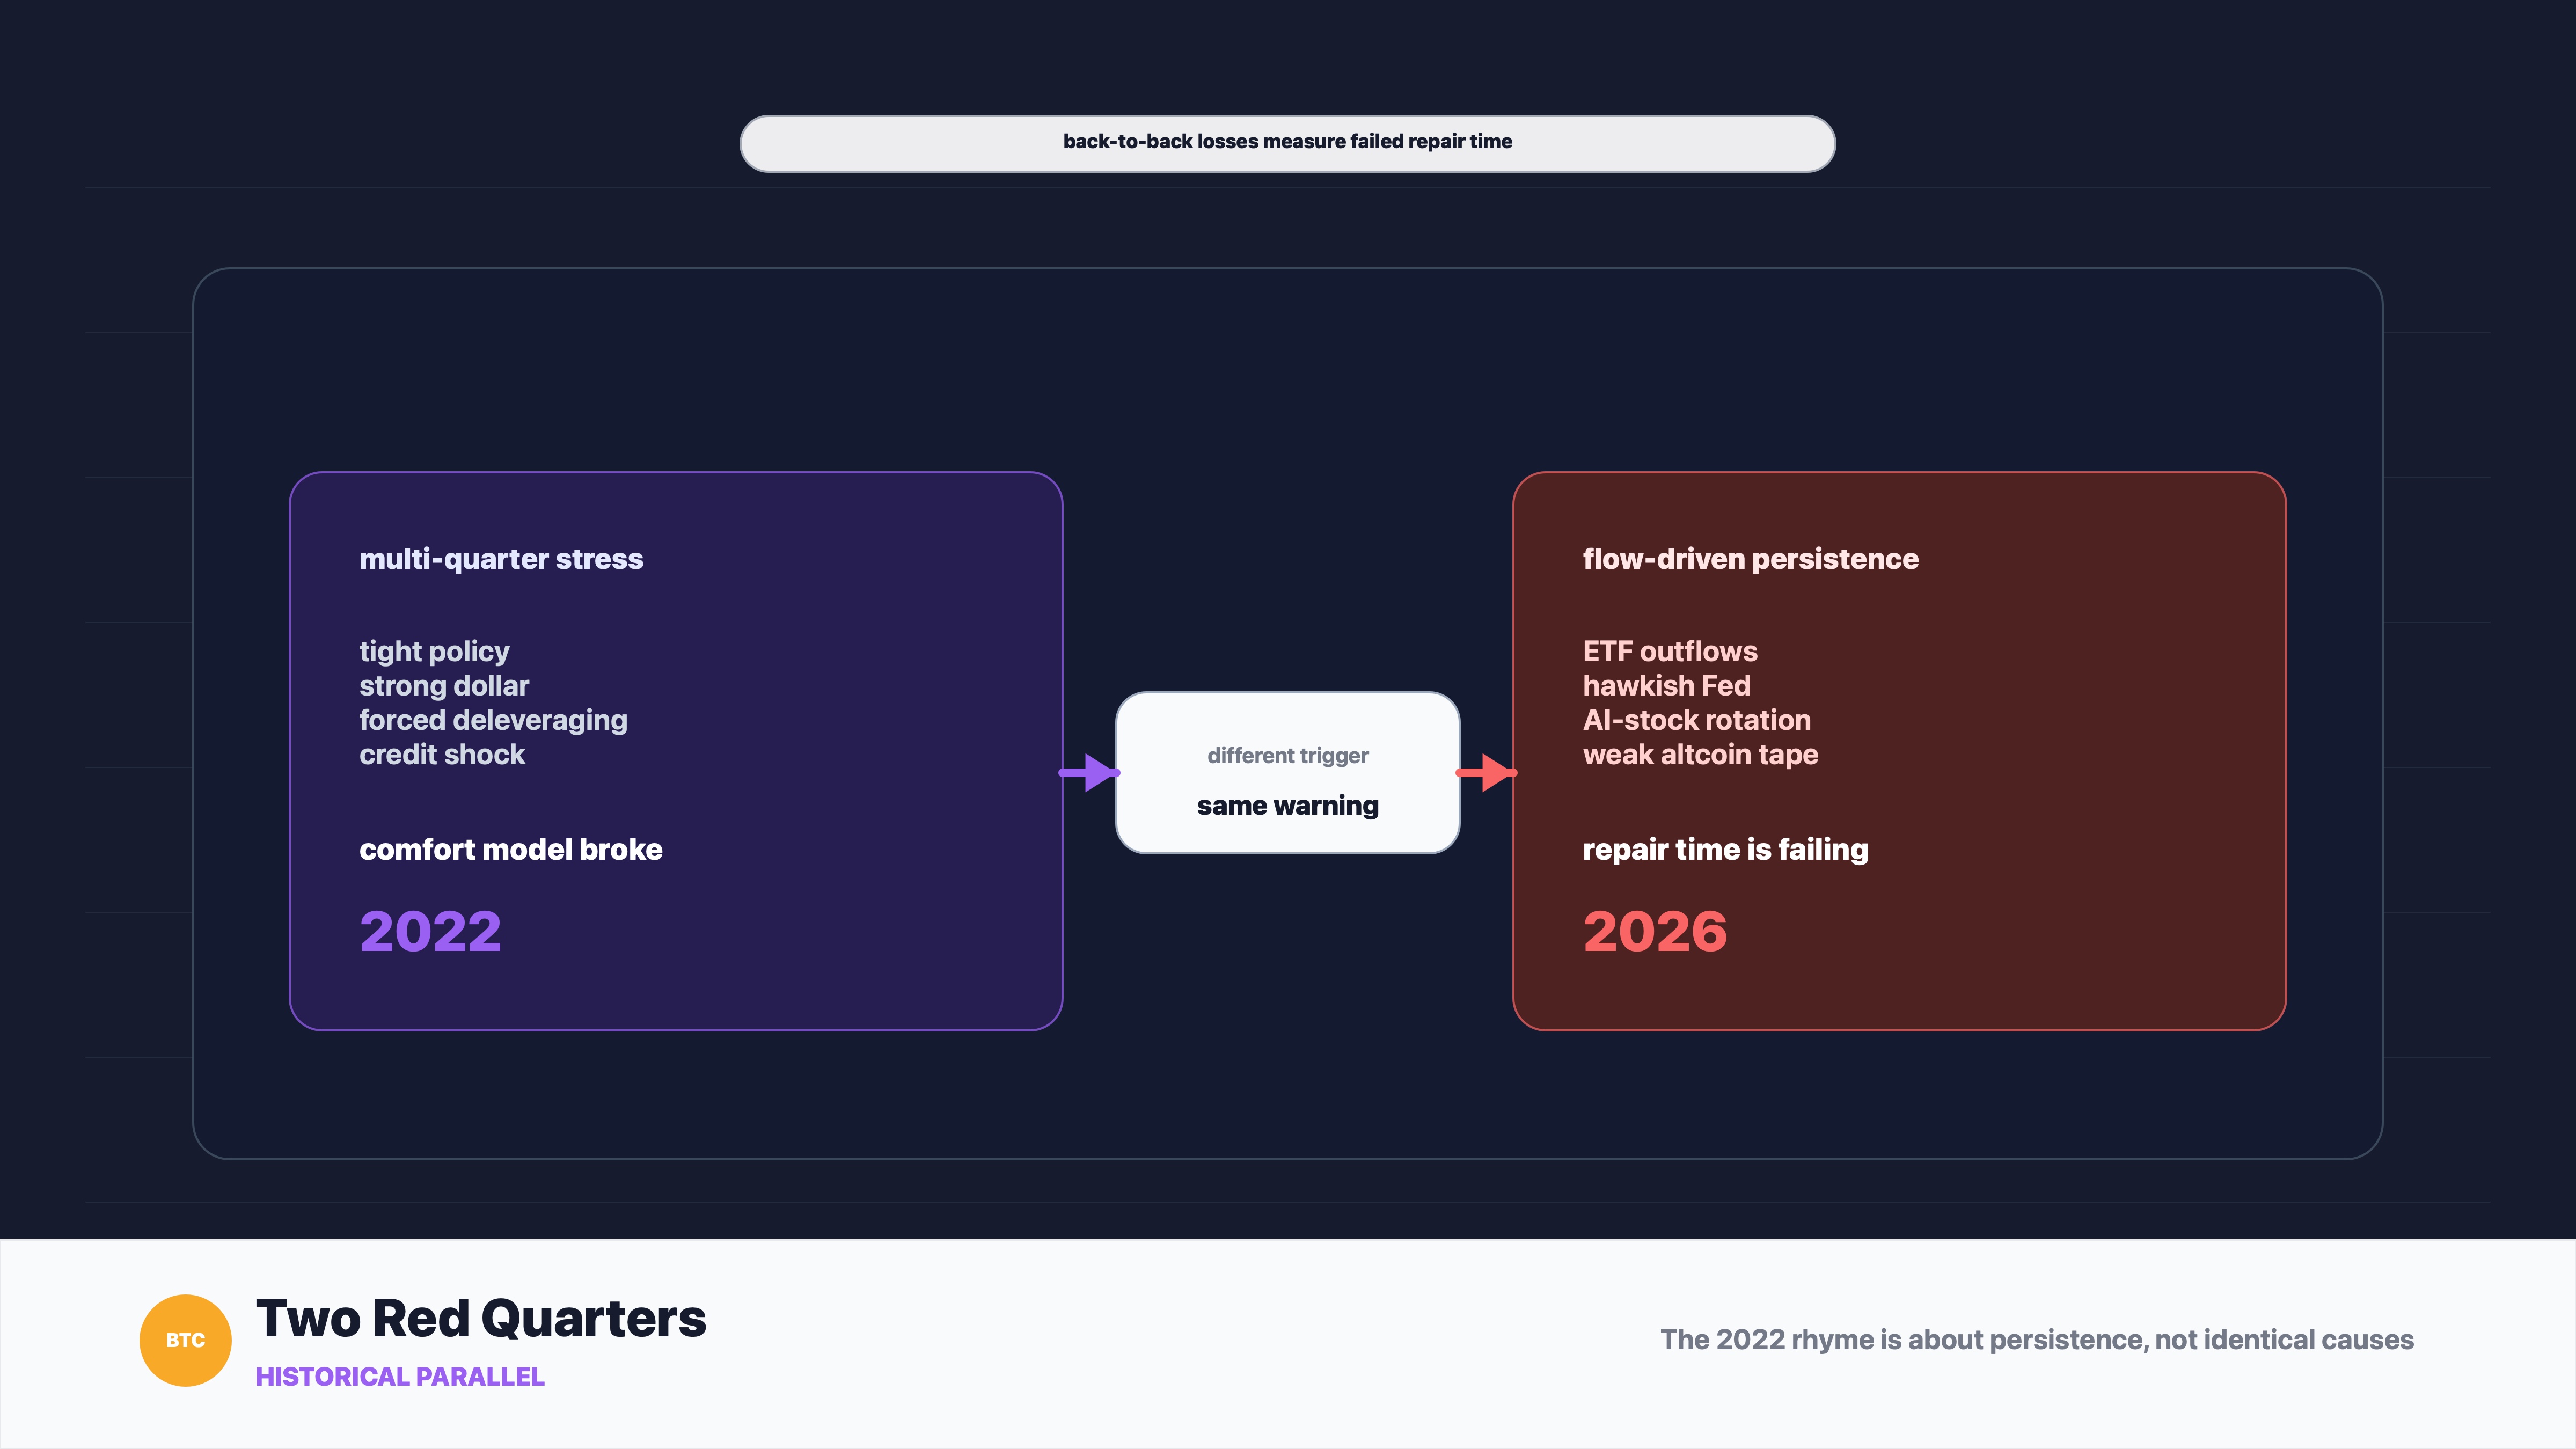
The closest useful parallel is 2022, not because the details are identical, but because the market structure rhymes. In 2022, bitcoin moved from a normal drawdown into a multi-quarter bear market as tighter monetary policy, a stronger dollar and forced crypto deleveraging hit at the same time. The second quarter of 2022 became especially brutal after the Terra/Luna collapse spread stress through lenders, funds and balance sheets. Later, the FTX failure made the credit problem impossible to ignore.
The similarity is the loss of repair time. A single bad month can be explained away. A bad quarter can still be called digestion. Two weak quarters in a row are different. They mean the market had time to find buyers, rebuild confidence and reprice the macro story, but the bid still did not become strong enough. That is the uncomfortable part of the current setup too. Bitcoin has not merely dipped below $60K. It has done so near the end of a second straight losing quarter, while altcoins are behaving like the thinner ice in the same pond.
The difference is just as important. The current story, based on the CoinDesk report, is not a Terra-style insolvency cascade. It is more flow-driven and macro-driven: ETF outflows, a hawkish Fed, a strong dollar, weak tech sentiment and capital rotation toward AI-related equities. That makes the present market less obviously broken, but also harder to fix with one dramatic clearing event. There may not be one villain to remove. There may only be not enough demand.
The lesson is practical. Back-to-back quarterly losses are bearish not because calendars have magic powers, but because calendars measure persistence. If ETF outflows ease and BTC reclaims $60K quickly, the 2022 analogy weakens. If $58K breaks while flows stay soft, the analogy gets louder.
Bitcoin Price Reaction and K-Line Analysis
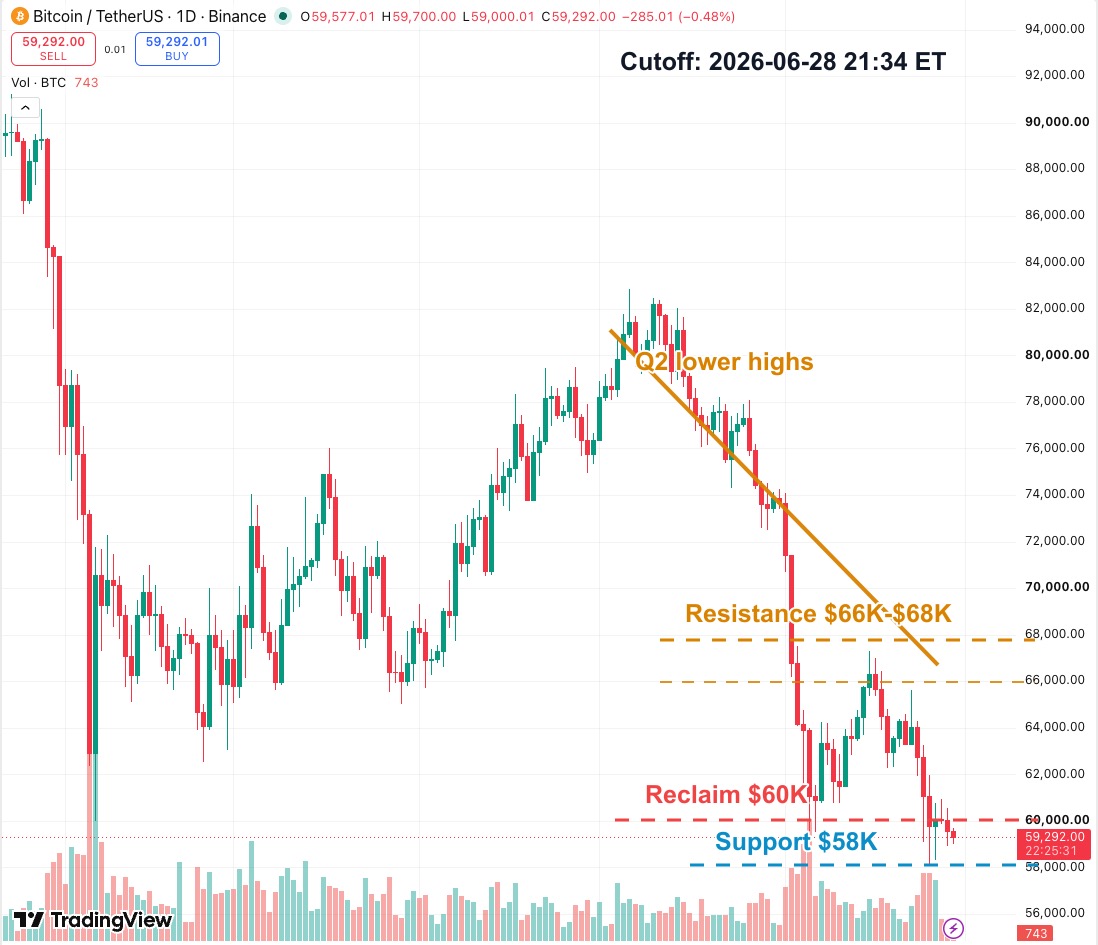
The daily BTCUSDT chart fits the news better than a short intraday chart because the story is not only "bitcoin fell today." The story is that bitcoin is ending the first half with a damaged quarterly structure.
On the chart, the Q2 rebound failed before it could recover the larger Q1 damage. Price formed lower highs, then slid back into the $60K area. That is why the first technical question is not whether BTC can immediately return to a bull trend. It is smaller and more urgent: can buyers reclaim $60K and keep it?
If $60K becomes resistance, the market has a problem. It would mean the old psychological floor has become a ceiling, and traders who waited for a clean bounce may start treating every rally as a chance to reduce risk.
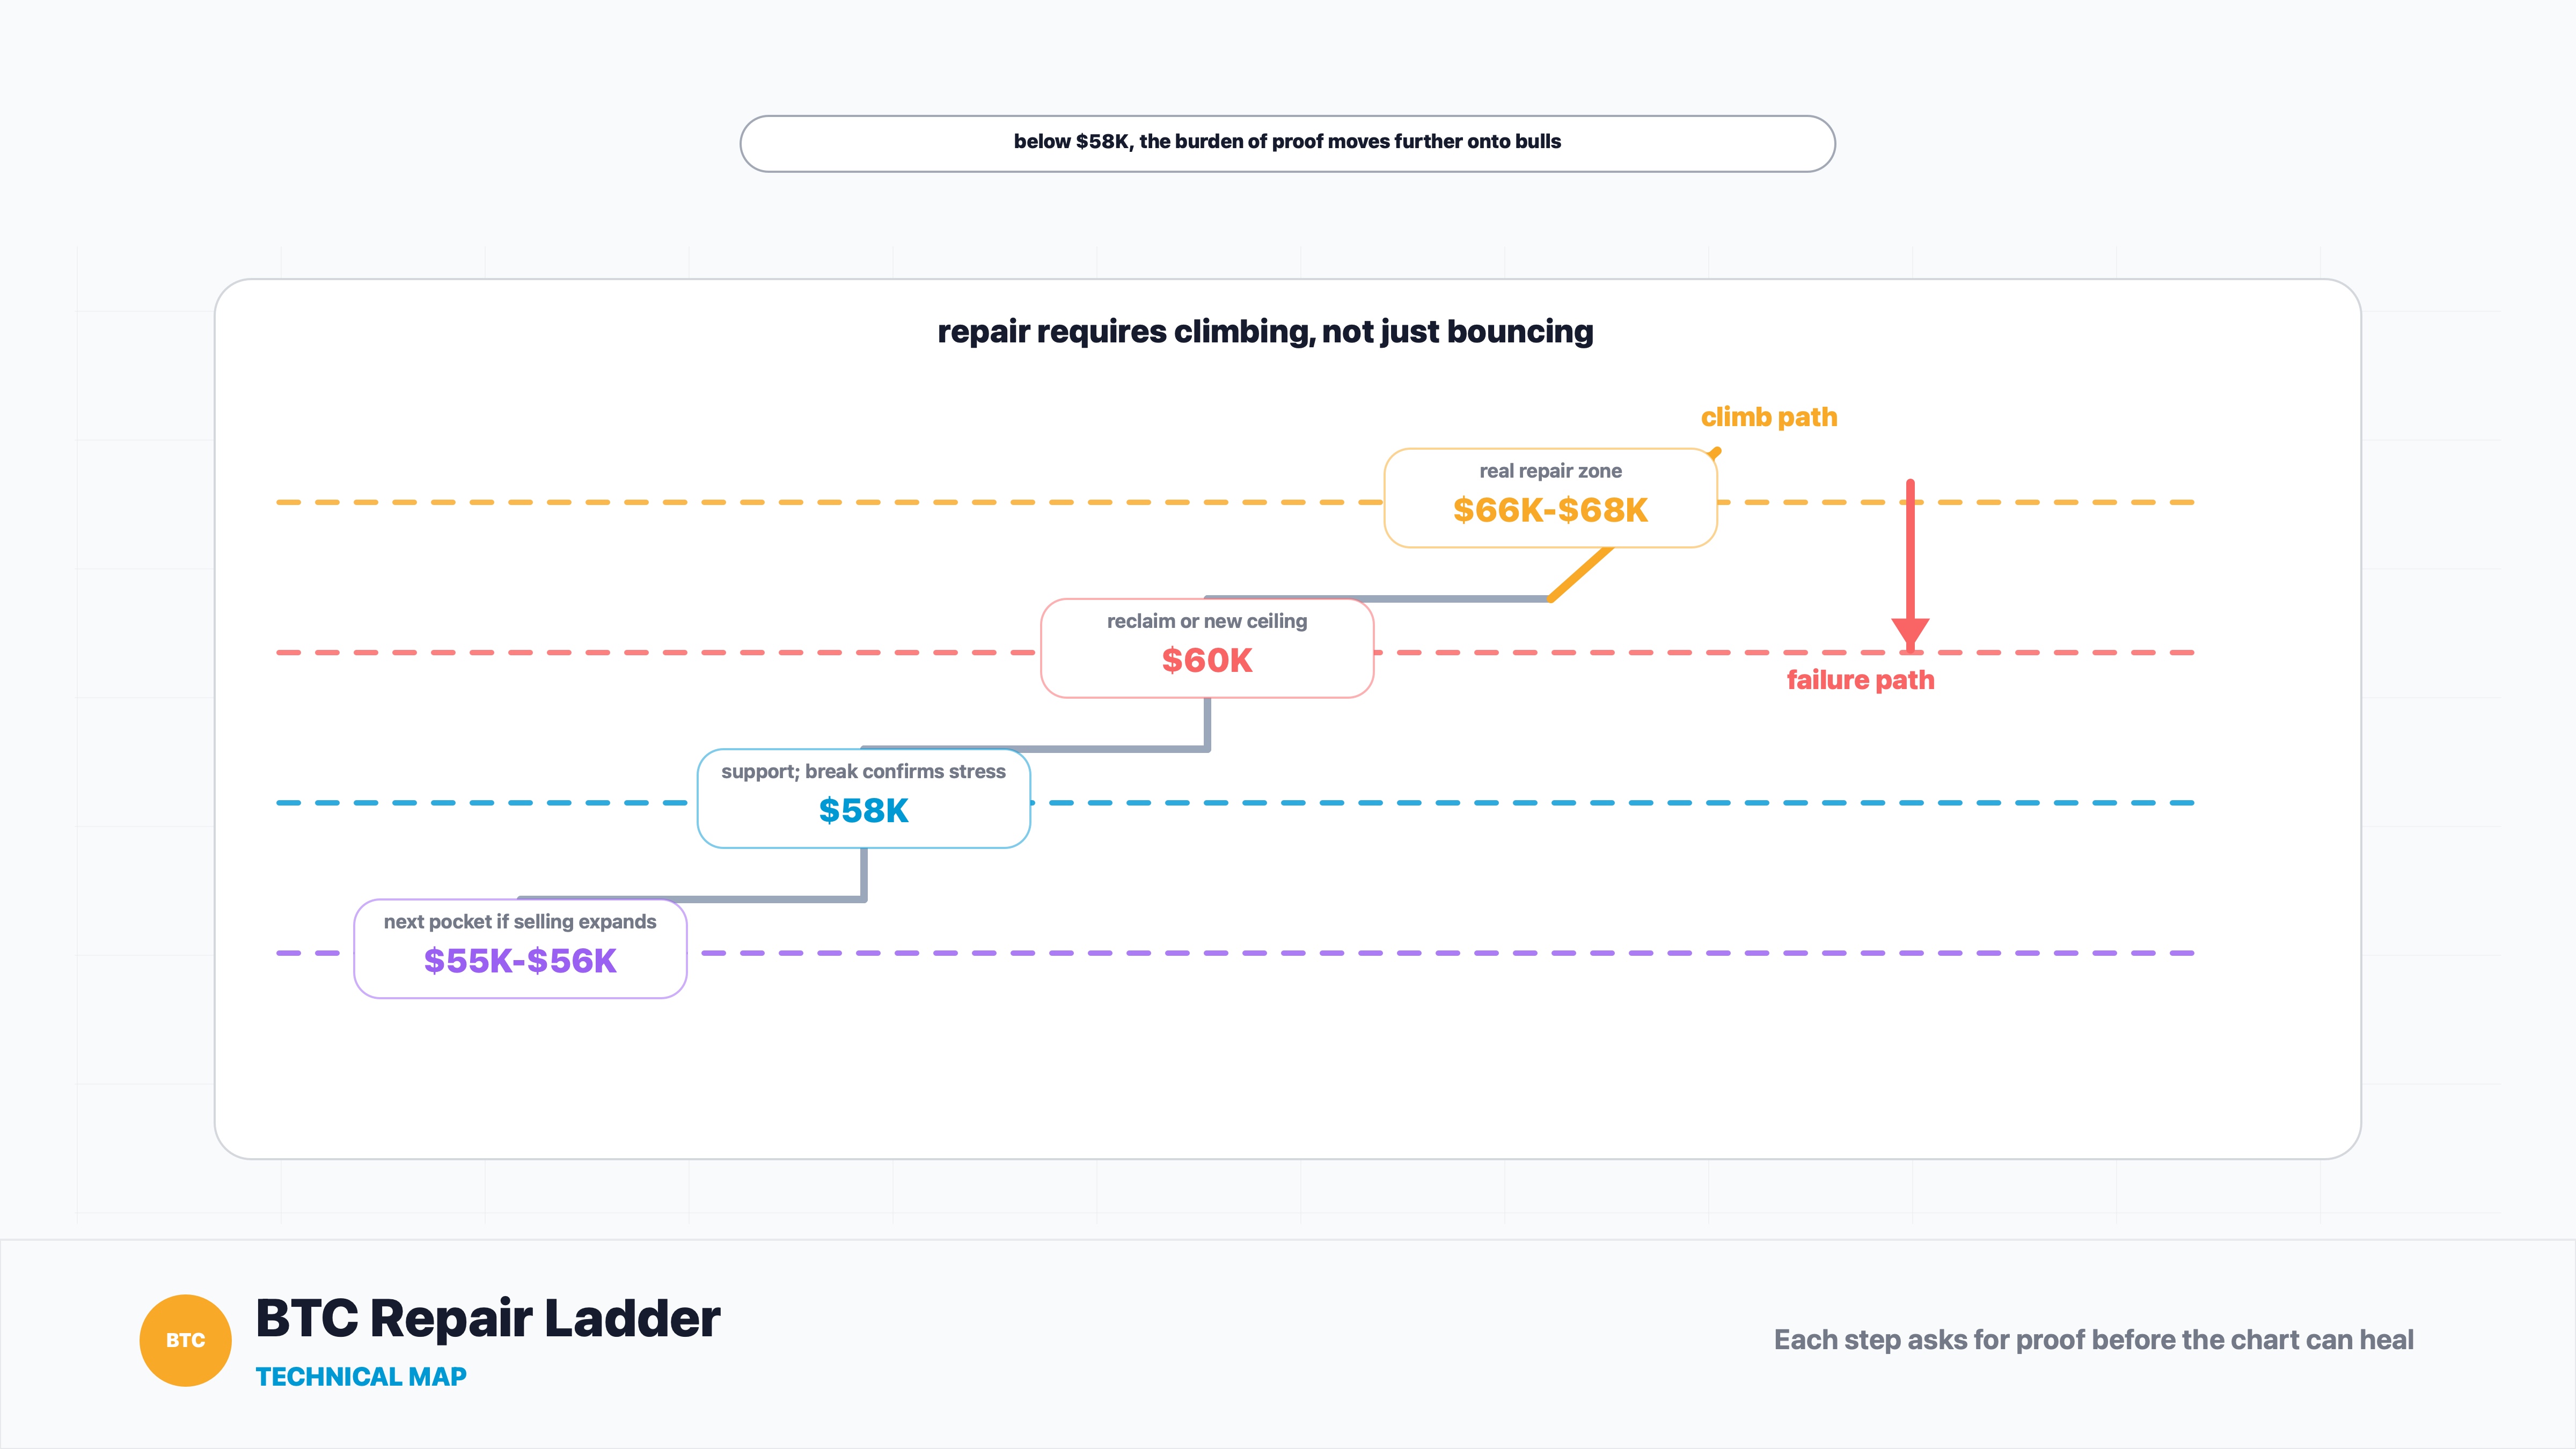
The next repair zone is $66K-$68K. A move into that band would not erase the quarterly loss, but it would show that sellers no longer own every bounce. Below the market, $58K is the support zone that matters most. Losing it would make the break under $60K look less like a headline scare and more like a continuation signal.
Key Levels to Watch
- $66K-$68K: The first real repair zone. BTC needs this area to stop looking like a broken rebound.
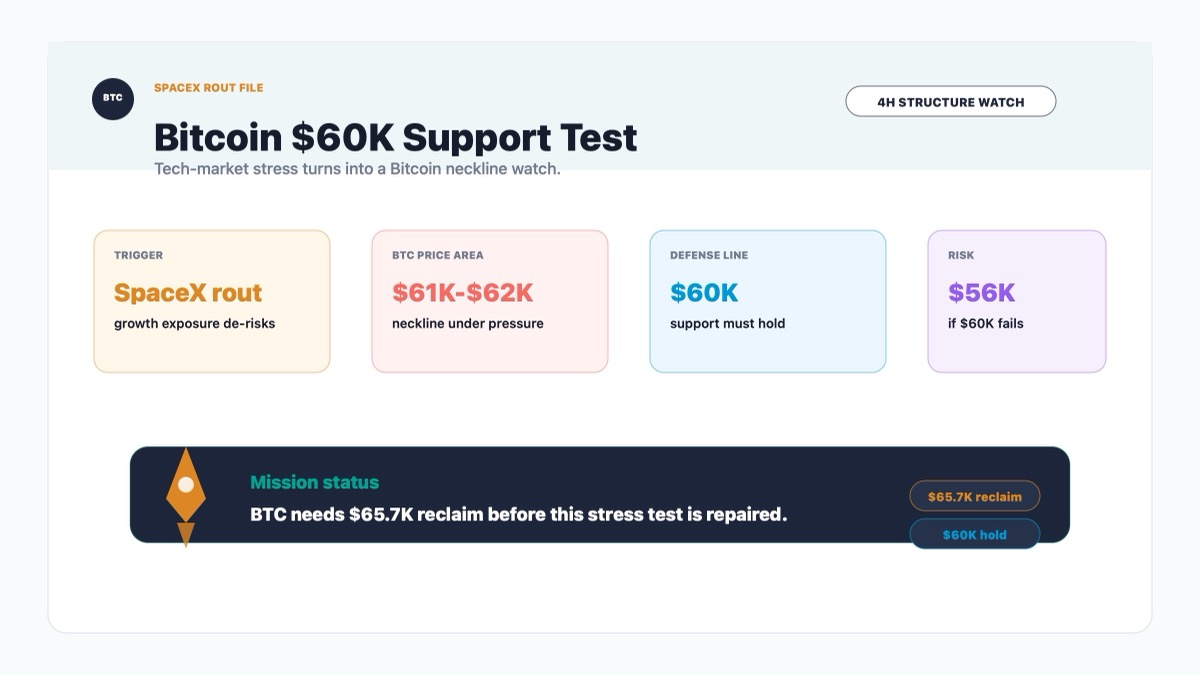
- $60K: The psychological line. Reclaiming it would stabilize sentiment; failing there keeps pressure on buyers.
- $58K: The near-term support zone. A clean break below it would suggest deeper stress.
- $55K-$56K: The next downside area if selling expands after a $58K break.
Conditional Forecast
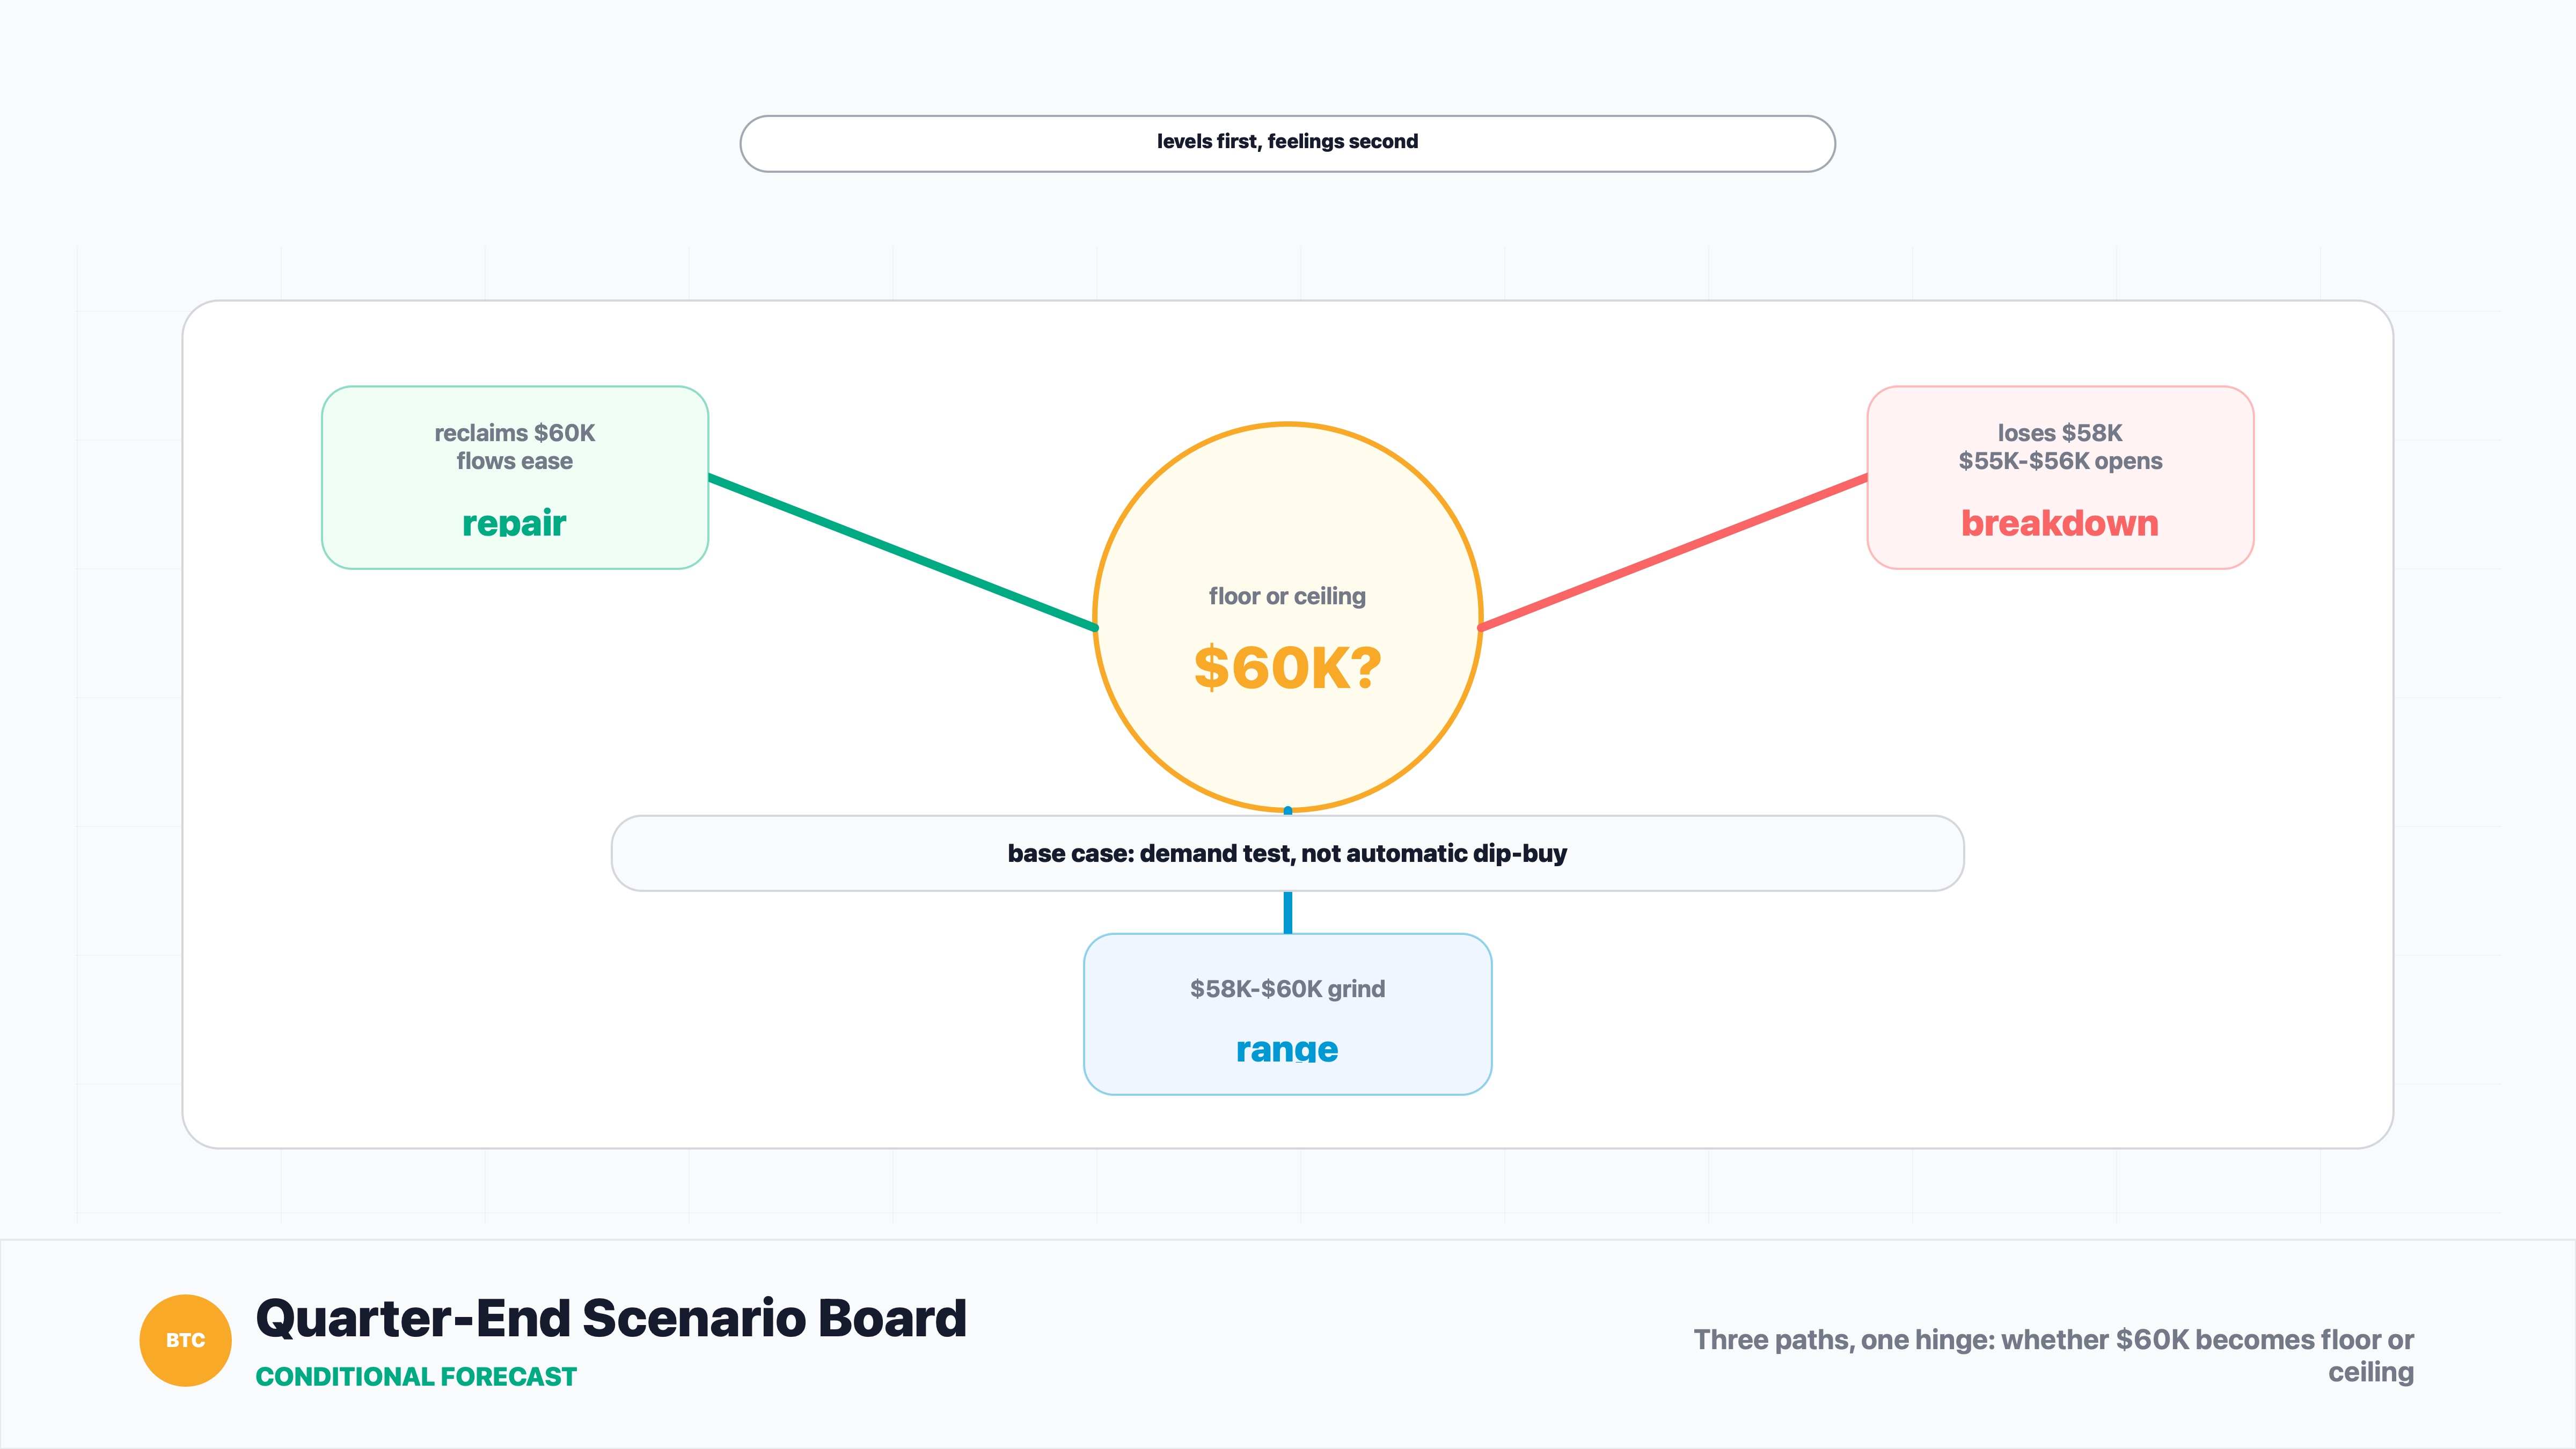
The bullish path is narrow but visible. Bitcoin needs to reclaim $60K, hold it through quarter-end noise, and show that ETF outflows are easing. If that happens, the market can start treating the move under $60K as a failed breakdown rather than a new leg lower.
The neutral path is a grind between $58K and $60K. That would be classic damaged-market behavior: not enough panic for capitulation, not enough demand for recovery. In that case, altcoins would probably stay selective, with stronger names surviving and weaker names leaking.
The bearish path begins with a daily close below $58K. If that happens while the dollar stays firm, ETF flows remain soft and tech risk appetite keeps wobbling, bitcoin could test the $55K-$56K zone. The danger is not only lower price. The danger is that the market starts believing the first half was not an interruption, but the new baseline.
Investment Takeaway
This is not a clean "buy the dip" setup yet. It is a demand test.
Bitcoin under $60K matters because it arrives with weak ETF flows, a strong dollar, pressure from the Fed and a rare back-to-back quarterly loss. That combination makes the chart less forgiving. Bulls do not need a heroic candle. They need proof that buyers are still there after two quarters of disappointment.
For investors, the cleanest approach is to separate levels from feelings. Above $60K, BTC can begin repairing sentiment. Above $66K-$68K, it can begin repairing structure. Below $58K, the burden of proof shifts even more heavily onto bulls.
Until then, the market is saying something simple and unpleasant: bitcoin is still the strongest large crypto asset in this tape, but even the strongest asset is not strong enough to make the tape feel healthy.
Sources
- CoinDesk: Bitcoin falls below $60,000, on track for a rare back-to-back quarterly loss (https://www.coindesk.com/markets/2026/06/28/bitcoin-falls-below-usd60-000-on-track-for-a-rare-back-to-back-quarterly-loss)
- CoinGlass: Bitcoin quarterly returns and market performance (https://www.coinglass.com/pro/i/quarterly-performance-report)
- TradingView: BTCUSDT daily chart (https://www.tradingview.com/chart/?symbol=BINANCE%3ABTCUSDT&interval=1D)
- CoinMarketCap Academy: Bitcoin in 2022, a year to forget (https://coinmarketcap.com/academy/article/bitcoin-in-2022-a-year-to-forget)
|
DISCLAIMER:
1. All content on this website (including but not limited to articles, data, charts, and analyses) is for general informational purposes only and does not constitute any form of investment advice, trading recommendation, or financial guidance. 2. Cryptocurrencies and digital assets are subject to extreme price volatility and high investment risk; you may lose part or all of your principal. Past performance does not predict future results. 3. The information on this website is based on sources we believe to be reliable, but we do not guarantee its accuracy, completeness, or timeliness. Any investment decisions made based on this website’s information are at your own risk. 4. We strongly recommend that you conduct your own thorough research and consult an independent, licensed financial advisor before making any investment decisions. |
Recommended reading
Latest News