Key Takeaways
- Bitcoin is no longer trading like an isolated crypto story. It is trading like a risk asset being pulled into a wider tech sell-off.
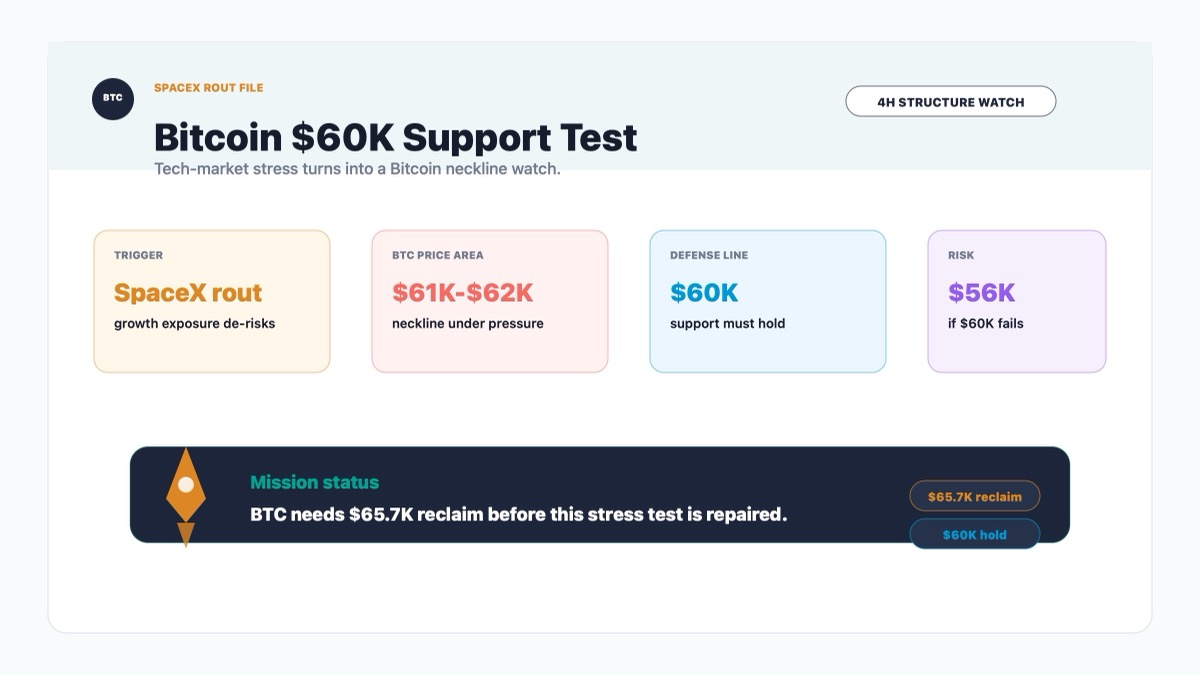
- Cointelegraph reports that SpaceX's post-IPO drop erased more than $600 billion in market value, helping push BTC back toward the $60,000 support area.
- The short-term BTC chart is focused on a $61,000-$62,000 neckline, with $65,700 acting as the cleaner reclaim level.
- A decisive break below $60,000 would shift attention toward the $55,000-$56,000 downside zone cited by the article's technical setup.
What Happened
Bitcoin is wobbling near the one number that always makes the room quieter: $60,000.
According to the Cointelegraph article, BTC has fallen more than 8% from its June high near $67,255, bringing the market back toward a major support area. The immediate trigger is not a crypto-native failure, an exchange blowup, or a sudden regulatory hit. The pressure is coming from the risk-asset side of the room.
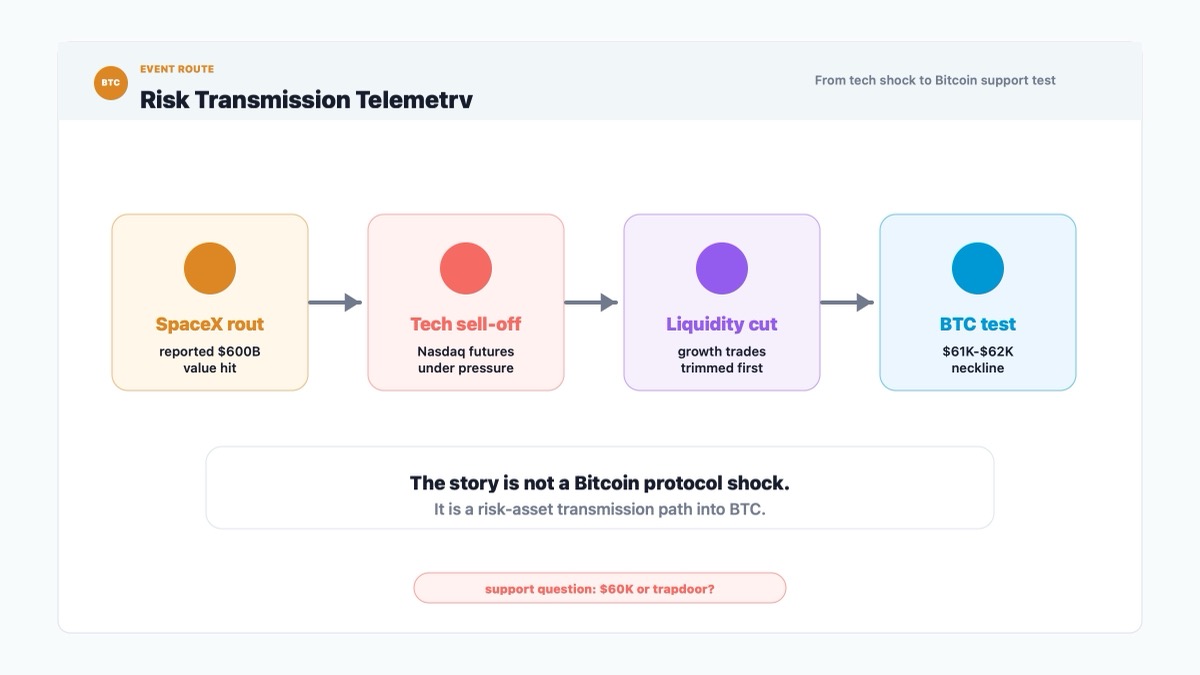
Cointelegraph reports that SpaceX's post-IPO rout erased more than $600 billion in market value after the company had priced its IPO at $135 per share earlier in June, raising $75 billion at an implied valuation of about $1.77 trillion. The stock later climbed to a post-IPO peak near $211.39 on June 16 before falling roughly 27% from that high.
That matters for Bitcoin because the report frames the SpaceX decline as part of a broader tech sell-off. Nasdaq 100 futures fell more than 3% on Tuesday, while chip names such as Intel, AMD, Micron and SanDisk were also under pressure.
The simple version is that investors are doing the thing investors do when expensive growth assets start falling: they reduce risk first and ask more elegant questions later.
Bitcoin gets caught in that because, during market stress, it often trades less like "digital gold" and more like a high-beta liquidity asset. When traders sell speculative tech, they often sell crypto too. Not always. But often enough that pretending the connection does not exist is a good way to be surprised by a red candle.
The article also cites analyst Nehal, who argued that Bitcoin could fall below $60,000 if it breaks below $62,200, while noting that stronger breakout signals would come above $65,700 or below $59,000.
Why This Matters for Bitcoin and Crypto Markets
This news matters because it forces Bitcoin investors to separate two different questions that often get lazily mixed together.
The first question is: "Is Bitcoin's long-term story broken?" The answer from this article is no. Nothing in the report changes Bitcoin's supply schedule, settlement model, or institutional custody structure.
The second question is more immediate and much less comforting: "Can BTC hold up when speculative tech is being sold?" That answer is still being tested.
Markets do not need a perfect causal chain to move together. They need a shared holder base, shared leverage, shared risk models, and a shared reason to cut exposure. If a portfolio manager owns tech stocks, crypto, AI-adjacent names, and other growth trades, a drawdown in one pocket can force risk reduction elsewhere. Bitcoin does not have to be SpaceX. It only has to sit in the same risk bucket for a while.
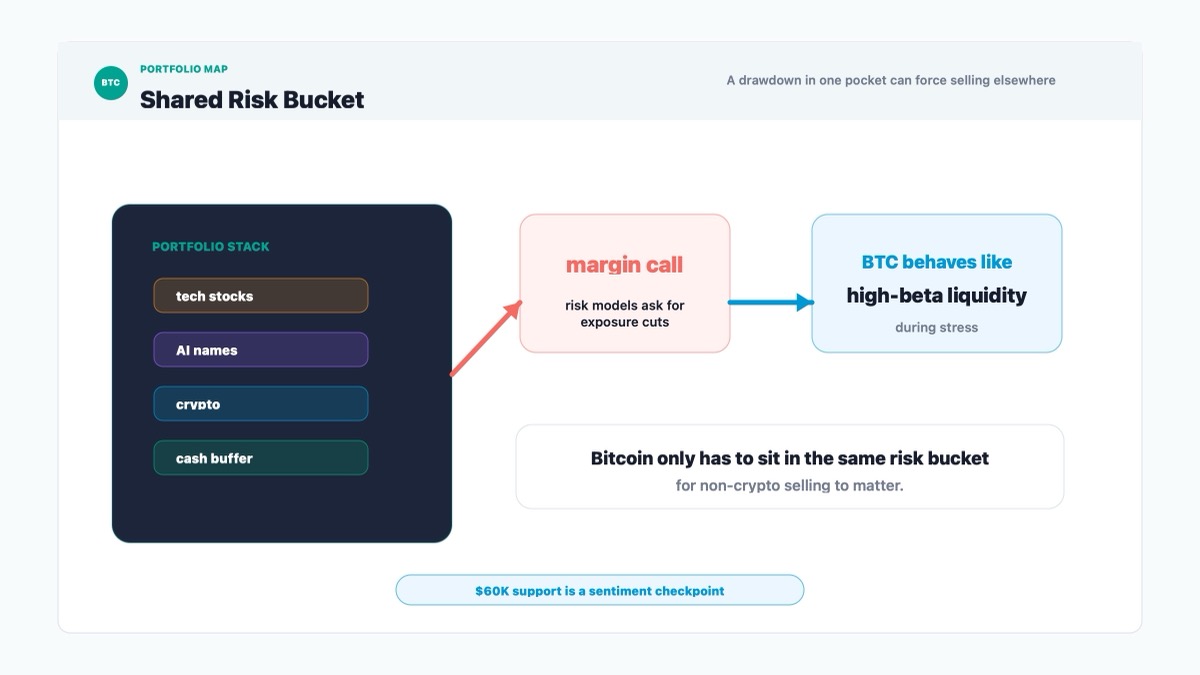
That is the mechanism here. The SpaceX story becomes important not because rockets determine Bitcoin's value. They do not. It matters because the reported rout pressures the broader "growth and speculation" trade, and Bitcoin still spends a lot of time being priced inside that trade.
For the wider crypto market, the risk is even simpler. If BTC breaks below $60,000, altcoins usually do not respond by becoming philosophical. They tend to lose liquidity, lose bids, and discover that "rotation" was partly just another name for confidence.
So the market is watching whether $60,000 behaves like support or like a trapdoor. That is a narrow technical question, but it carries a broad sentiment answer.
Historical Parallel
A useful historical comparison is the 2022 risk-off phase, when Bitcoin repeatedly traded with the same basic mood as high-growth technology stocks. The exact causes were different: inflation pressure, aggressive central-bank tightening, expensive equity valuations, and a broad unwind of speculative positioning. But the market behavior had a familiar shape. Investors did not need to decide that Bitcoin and software stocks were the same thing. They only needed to decide that both belonged in the "reduce risk now" pile.
What happened then was not one clean event. It was a repricing process. As financial conditions tightened, assets that depended on abundant liquidity and aggressive risk appetite were marked down together. Bitcoin's own crypto-specific problems later made the decline worse, but the early pressure came from a broader macro and tech-market reset. The important part is that correlation can appear exactly when investors most want diversification to save them. Very considerate of markets, as usual.
The similarity with the current setup is the transmission channel. In both cases, the pressure does not start with a Bitcoin protocol issue. It starts with risk appetite. If traders are selling high-valuation technology exposure, Bitcoin can become part of the same liquidation logic even when the Bitcoin-specific news is quiet.
The difference is scale and system stress. The 2022 episode became a deep, multi-month deleveraging cycle with major crypto-native failures layered on top. The current article describes a sharper tech-led sentiment shock and a specific BTC technical test, not a confirmed system-wide crypto credit crisis.
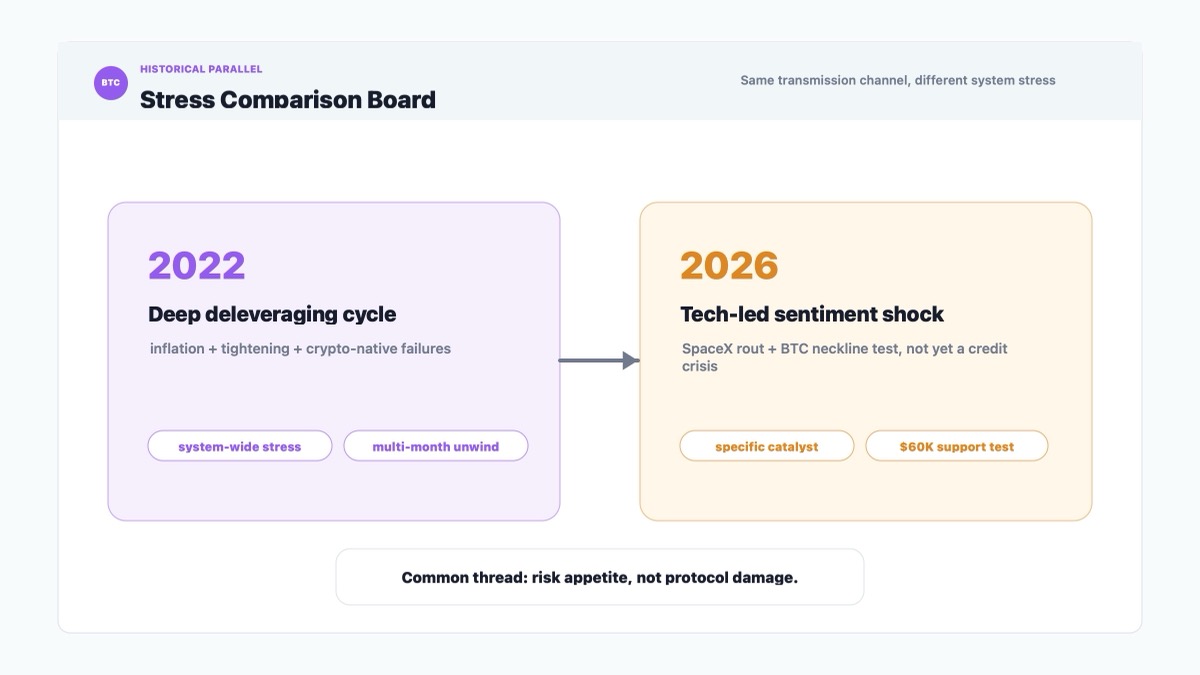
The lesson is not that Bitcoin must replay 2022. The lesson is that when BTC trades like a liquidity asset, support levels deserve more respect than narratives. If $60,000 holds and BTC reclaims the upper range, the market can treat this as a stress test. If $60,000 breaks cleanly, the comparison becomes less cute and more useful.
Bitcoin Price Reaction and K-Line Analysis
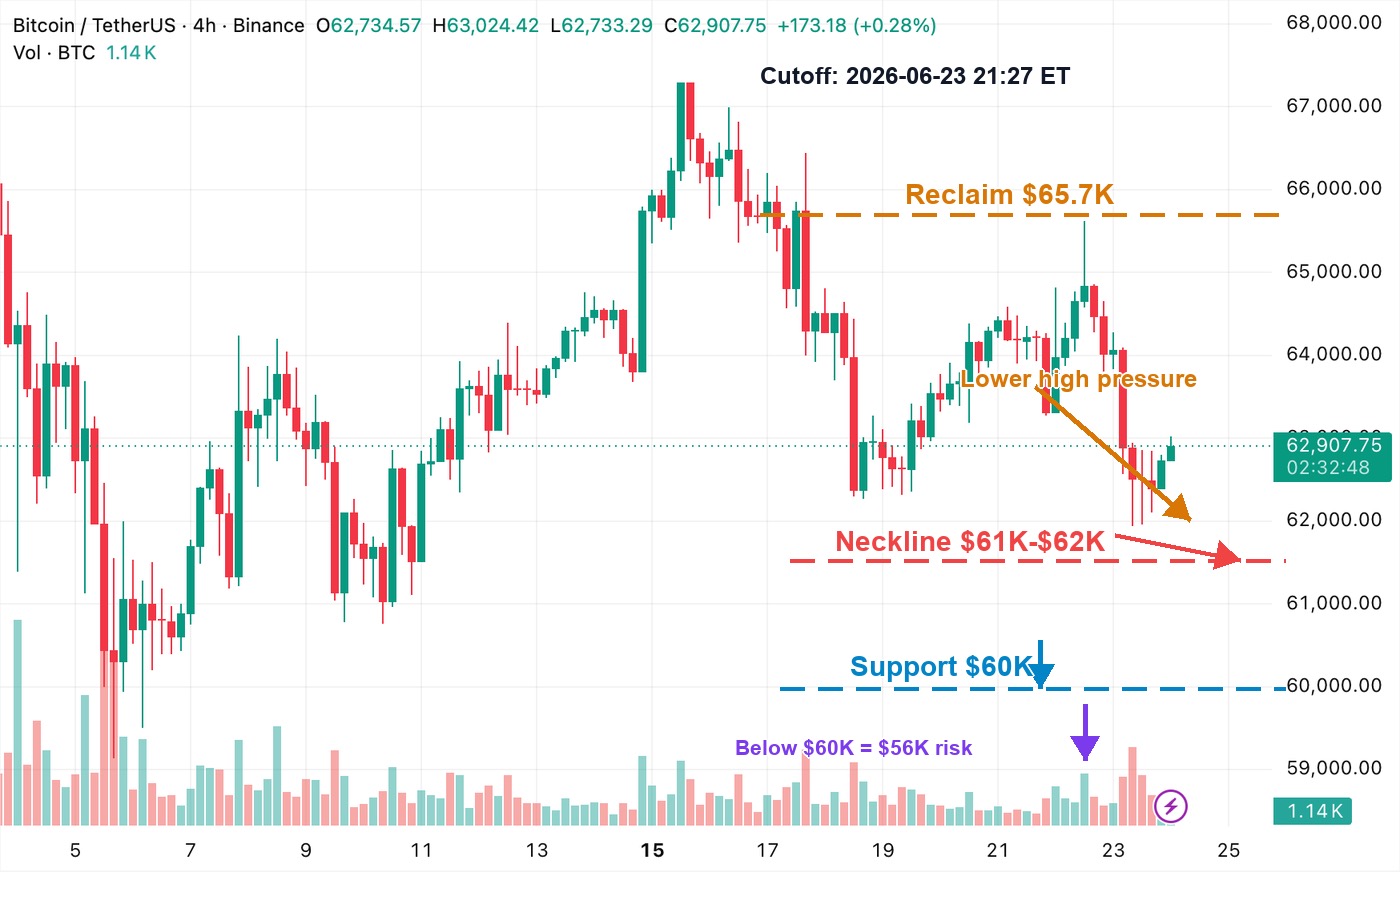
The 4-hour chart is the right window for this story because the article itself is built around short-term market structure: a possible head-and-shoulders pattern, a neckline near $61,000-$62,000, a $60,000 support test, and a reclaim level near $65,700.
The chart shows Bitcoin failing to extend after the mid-June push above $67,000. That high becomes the head of the pattern described in the article. The right side of the chart then shows a lower high around the $65,000 area, followed by a fast drop toward the low-$62,000 range.
That is the market's way of saying: "The bounce exists. The conviction does not yet."
The $61,000-$62,000 area is the important short-term neckline. If BTC keeps holding above it, the bearish pattern remains a warning rather than a completed breakdown. If BTC closes decisively below it on the 4-hour chart, the pattern becomes more dangerous because the market has moved from testing support to accepting lower prices.
The $60,000 level is the bigger psychological and technical line. It is not magic, but it is where traders cluster attention. When a round number also lines up with prior support and a bearish pattern target, it becomes a coordination point. Buyers know other buyers are watching it. Sellers know buyers are watching it. Everyone gets to make the same trade crowded. Delightful.
The reclaim level is $65,700. A move back above that area would weaken the bearish read because it would show BTC recovering the upper part of the range instead of merely bouncing from a fragile support zone.
Key Levels to Watch
$65,700 reclaim level: This is the level that would make the current sell-off look less threatening. A clean move above it would suggest the market is rejecting the bearish structure.
$61,000-$62,000 neckline: This is the immediate battleground. Holding it keeps BTC in a range. Losing it gives the head-and-shoulders setup more weight.
$60,000 support: This is the line that matters psychologically. A brief wick below it would be less important than whether BTC can close and stabilize above it.
$59,000 breakdown trigger: The article cites this as the lower range signal. A move below it would suggest that the market is no longer just testing support.
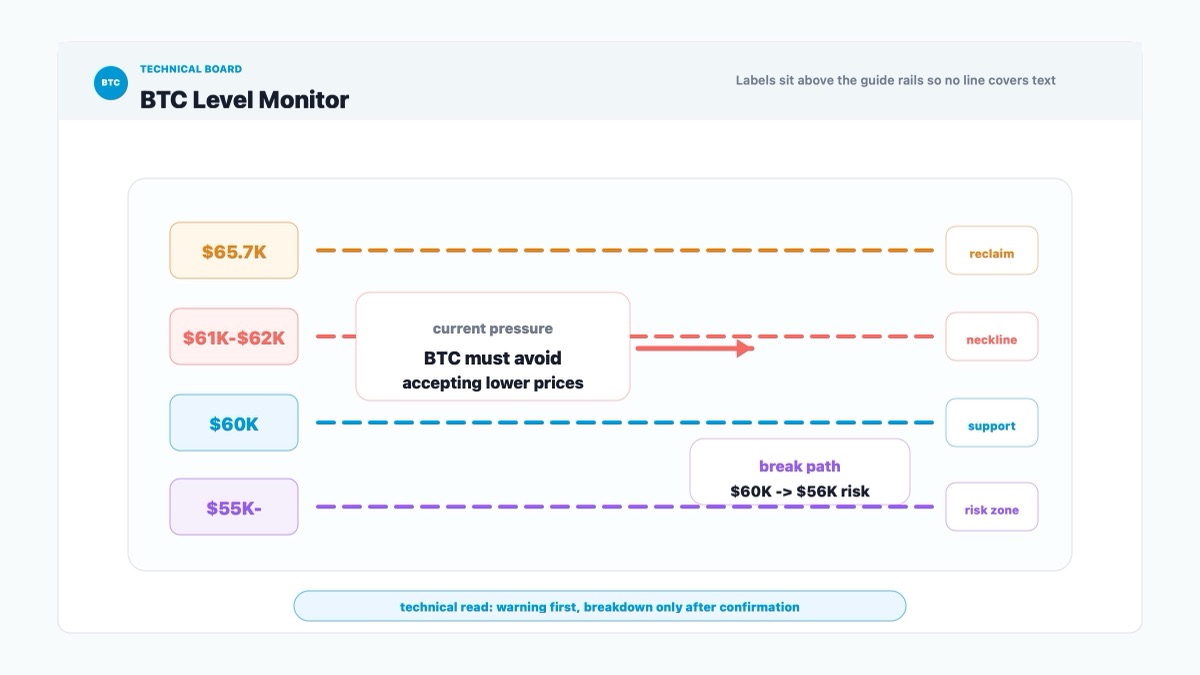
$55,000-$56,000 downside zone: This is the measured downside area from the reported head-and-shoulders structure. It should be treated as a risk zone, not a guaranteed destination.
Conditional Forecast
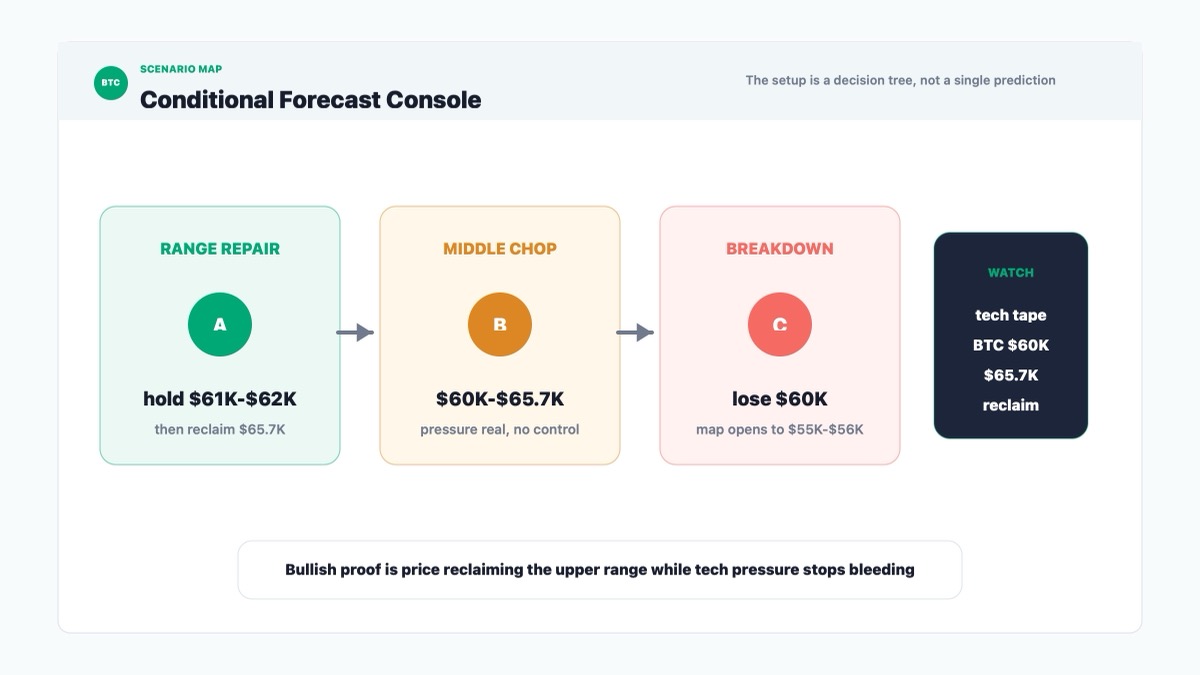
If Bitcoin holds above $61,000-$62,000 and then reclaims $65,700, the market can treat the SpaceX-driven tech shock as a stress test that failed to break BTC's range. In that case, the more constructive interpretation is that sellers tried to force a breakdown and did not get enough follow-through.
If BTC chops between $60,000 and $65,700, the market stays in the annoying middle. The news matters, the pressure is real, but neither side has control. Investors should read that as a range market, not as a clean trend signal.
If BTC loses $60,000 and especially $59,000 on a decisive 4-hour close, the bearish setup becomes much harder to dismiss. The market would likely start pricing the $55,000-$56,000 area as the next serious downside zone.
The cleanest bullish signal is not a clever narrative. It is price reclaiming the upper range while tech-market pressure stops bleeding into crypto. The cleanest bearish signal is the opposite: tech remains weak, BTC loses $60,000, and buyers stop showing up where they are supposed to.
Investment Takeaway
This is a market where Bitcoin's story and Bitcoin's trading behavior are temporarily different things.
The long-term Bitcoin thesis may be unchanged, but the short-term chart is being governed by risk appetite, tech-market stress, and a very visible support test. That means investors should avoid treating $60,000 as a sacred floor. It is a level to watch, not a promise from the market.
The practical stance is conditional. Above $65,700, BTC starts repairing the damage. Between $60,000 and $65,700, it is still negotiating. Below $59,000, the downside map opens toward $55,000-$56,000.
Bitcoin can survive a tech sell-off. It has survived worse things than a bad day for expensive growth assets. But survival is not the same as immediate upside. For now, BTC needs to prove that $60,000 is support, not just a nice round number everyone agreed to stare at.
Sources
- Cointelegraph: Bitcoin slump worsens amid SpaceX rout: Can BTC price hold $60K any longer? (https://cointelegraph.com/markets/bitcoin-slump-worsens-amid-spacex-rout-can-btc-price-hold-60k-any-longer)
- TradingView: BINANCE:BTCUSDT 4-hour chart (https://www.tradingview.com/chart/?symbol=BINANCE%3ABTCUSDT&interval=240)
- Binance market data: BTCUSDT 4-hour klines (https://api.binance.com/api/v3/klines?symbol=BTCUSDT&interval=4h)
|
DISCLAIMER:
1. All content on this website (including but not limited to articles, data, charts, and analyses) is for general informational purposes only and does not constitute any form of investment advice, trading recommendation, or financial guidance. 2. Cryptocurrencies and digital assets are subject to extreme price volatility and high investment risk; you may lose part or all of your principal. Past performance does not predict future results. 3. The information on this website is based on sources we believe to be reliable, but we do not guarantee its accuracy, completeness, or timeliness. Any investment decisions made based on this website’s information are at your own risk. 4. We strongly recommend that you conduct your own thorough research and consult an independent, licensed financial advisor before making any investment decisions. |
Recommended reading
Latest News