
Key Takeaways
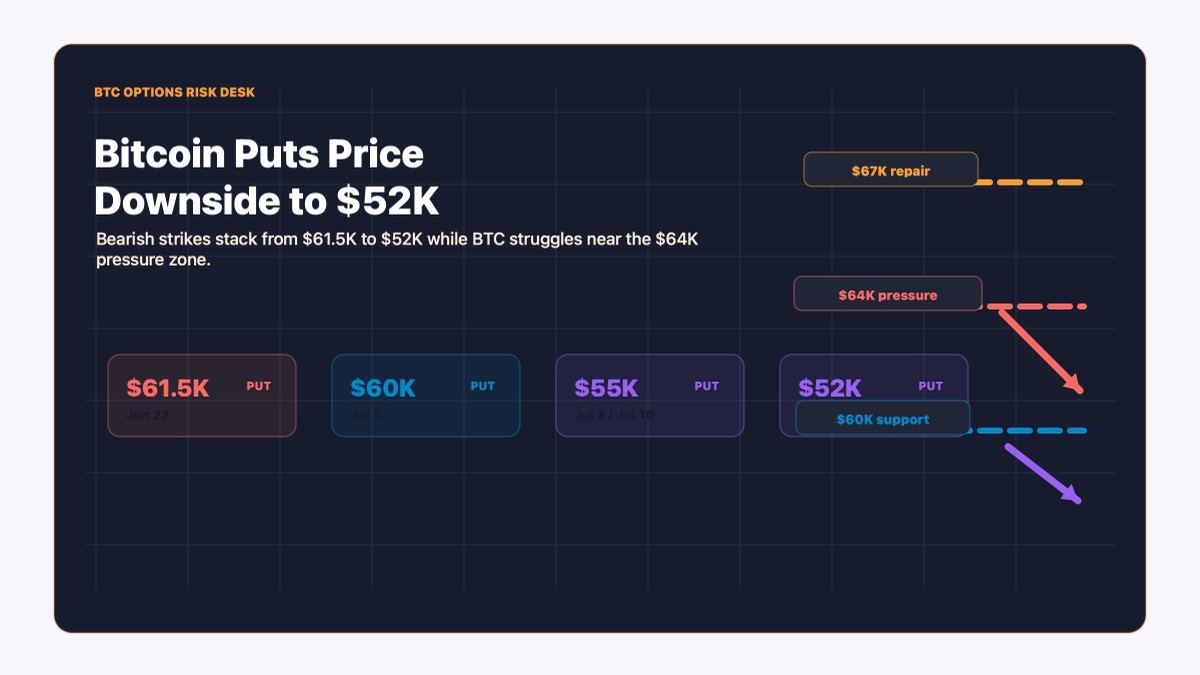
- Bitcoin traders are buying near-dated put options on Deribit, with bearish strikes ranging from $61.5K down to $52K.
- The options flow does not prove BTC must fall to $52K, but it shows traders are paying for protection against a deeper selloff.
- BTC needs to reclaim the $67K area to weaken the bearish setup; failure near $64K keeps $60K-$61.5K and then $55K-$52K in focus.
What Happened
Bitcoin traders are not just watching the selloff anymore. They are buying insurance against it getting worse.
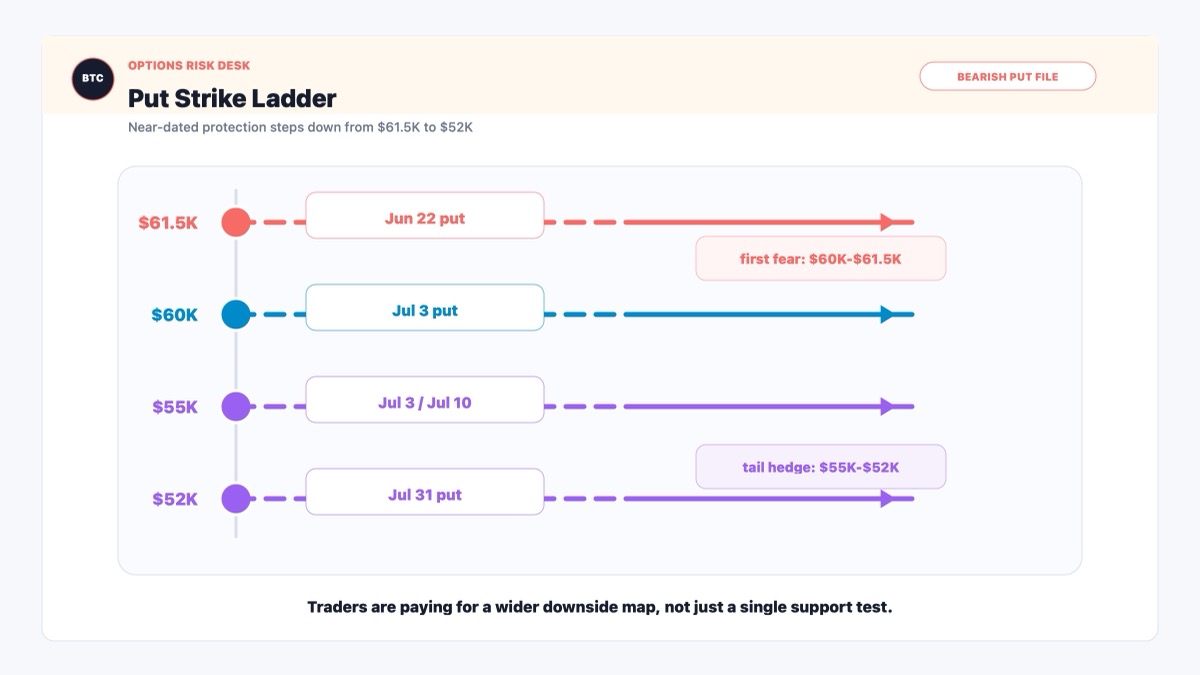
According to CoinDesk, Deribit saw heavy demand over the past 24 to 48 hours for short- and near-dated BTC put options. The flows tracked by Laevitas included June 22 $61,500 puts, July 3 $60,000 and $55,000 puts, July 10 $55,000 puts and July 31 $52,000 puts.
That is a neat little staircase of fear.
A put option gives the buyer the right to sell Bitcoin at a specific strike price in the future. If BTC falls below that strike, the put becomes more valuable. So when traders buy out-of-the-money puts, especially near-dated ones, they are usually doing one of two things: hedging spot exposure or betting that downside volatility is underpriced.
The context makes the flow easier to understand. BTC was trading near $62,400 in the CoinDesk report, down from highs near $67,000 earlier in the week. The market was also facing several pressure points at once: a hawkish Federal Reserve, a stronger U.S. dollar, persistent Bitcoin ETF outflows and fresh concern around Strategy.
Strategy matters here because it is the largest publicly listed Bitcoin holder. Its preferred stock, STRC, had fallen well below its $100 par value, raising questions about the company’s capital structure and its ability to continue its aggressive BTC accumulation strategy without creating more stress elsewhere.
None of this means Bitcoin is automatically going to $52K. Options markets are not crystal balls. They are more like weather maps: useful, noisy and occasionally dramatic in a way that makes everyone check the roof.
But the message is clear enough. Traders are no longer only debating whether $60K holds. Some are paying up for protection in case it does not.
Why This Matters for Bitcoin and Crypto Markets
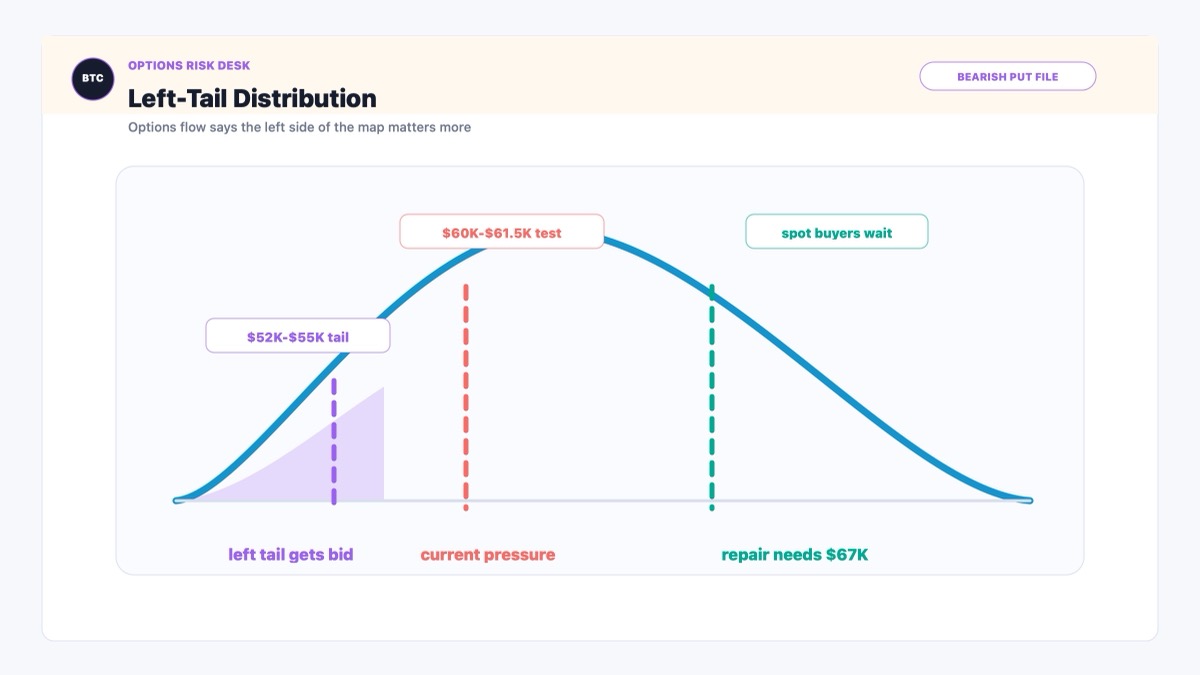
The important thing about this story is not the $52K number by itself. Round targets get attention because they are easy to screenshot. The deeper signal is that traders are preparing for a wider downside distribution.
In normal human language: the market thinks the left tail has become more interesting.
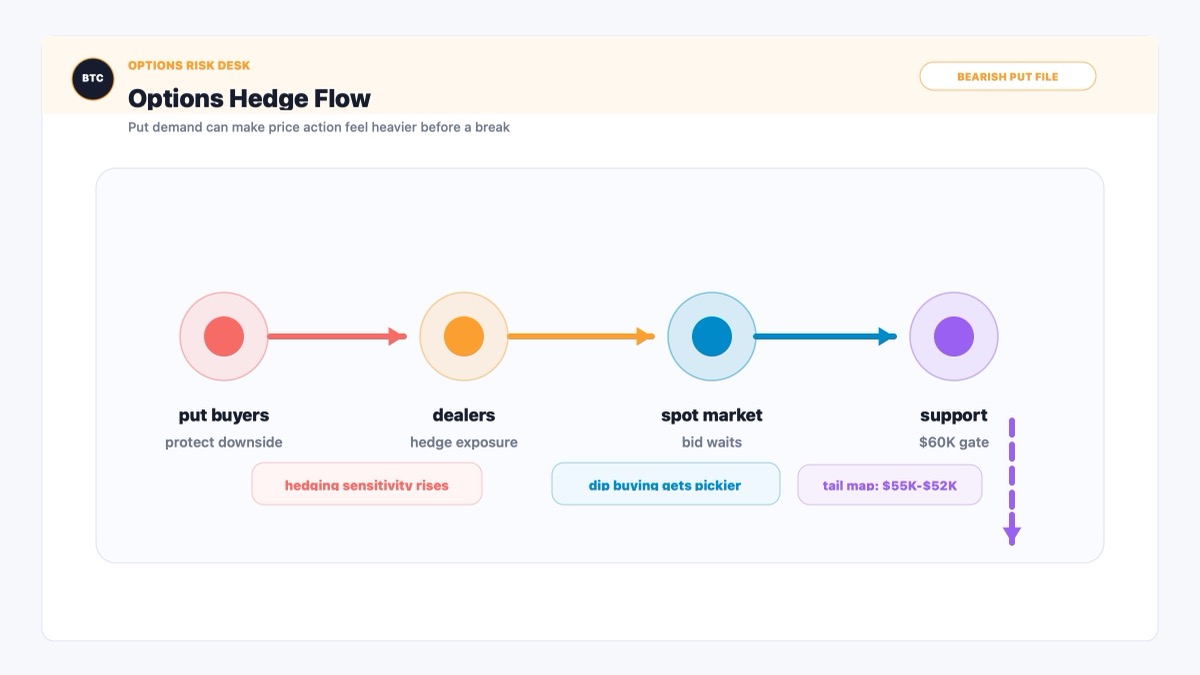
That matters because options demand can shape behavior even when the target is never reached. If traders own downside puts, they may be less willing to buy dips aggressively. If dealers are short those puts, hedging flows can become more sensitive as price moves lower. If spot buyers see large put demand building, they may wait for lower levels instead of stepping in early.
This is how a market can start to feel heavy without immediately collapsing. Everyone is still standing in the room, but more people are quietly checking the exits.
For Bitcoin, the first question is whether this is defensive hedging or outright bearish positioning. If large holders are buying puts to protect existing exposure, the flow may reflect risk management rather than a fresh directional bet. That is less alarming. If traders are buying puts because they expect a break below $60K, the flow becomes a cleaner sentiment warning.
For the broader crypto market, BTC put demand can also tighten risk appetite across altcoins. Bitcoin is the asset with the deepest liquidity and the strongest institutional bid. If even BTC traders are paying for downside protection, smaller crypto assets usually do not get treated with extra kindness.
The market does not need a catastrophe for this to matter. It only needs enough uncertainty to make capital slower, pickier and more expensive. That is often what bearish options flow is really saying: not “panic now,” but “the easy bid is gone for the moment.”
Historical Parallel
A useful historical parallel is the 2021-2022 transition, when Bitcoin moved from euphoric upside positioning into a more defensive options regime as macro conditions tightened and crypto leverage began to unwind.
The historical event was not one clean moment. It was a process. Bitcoin had enjoyed a powerful cycle, but as liquidity conditions shifted, traders began caring less about upside chase and more about downside protection. Options demand became a way to express a new market psychology: not necessarily “Bitcoin is dead,” but “the drawdown can still get uglier than spot traders want to admit.”
That is the similarity with the current setup. In both cases, puts became a tool for dealing with uncertainty after a meaningful price decline. The market was not simply reacting to one chart level. It was absorbing a cluster of pressures: macro policy, dollar strength, leverage concerns and the behavior of large crypto-linked balance sheets.
The difference is scale and structure. The 2021-2022 unwind became a broad deleveraging cycle across lenders, funds and exchanges. The current report is narrower. It points to near-dated Deribit demand for downside protection while BTC trades near the low-$60K area, not to a confirmed systemwide liquidation event.
That distinction matters. The lesson is not that Bitcoin must repeat the old bear-market path. Markets do not run sequels just because traders like familiar scripts. The lesson is that bearish options demand deserves attention when it lines up with a vulnerable spot chart.
For today’s BTC setup, the historical parallel says this: do not treat puts down to $52K as a guaranteed destination, but do not ignore them as noise either. They show where traders are willing to pay for protection. If price loses $60K and spot demand does not appear quickly, those far-lower strikes stop looking theatrical and start looking like the market’s next stress map.
Bitcoin Price Reaction and K-Line Analysis
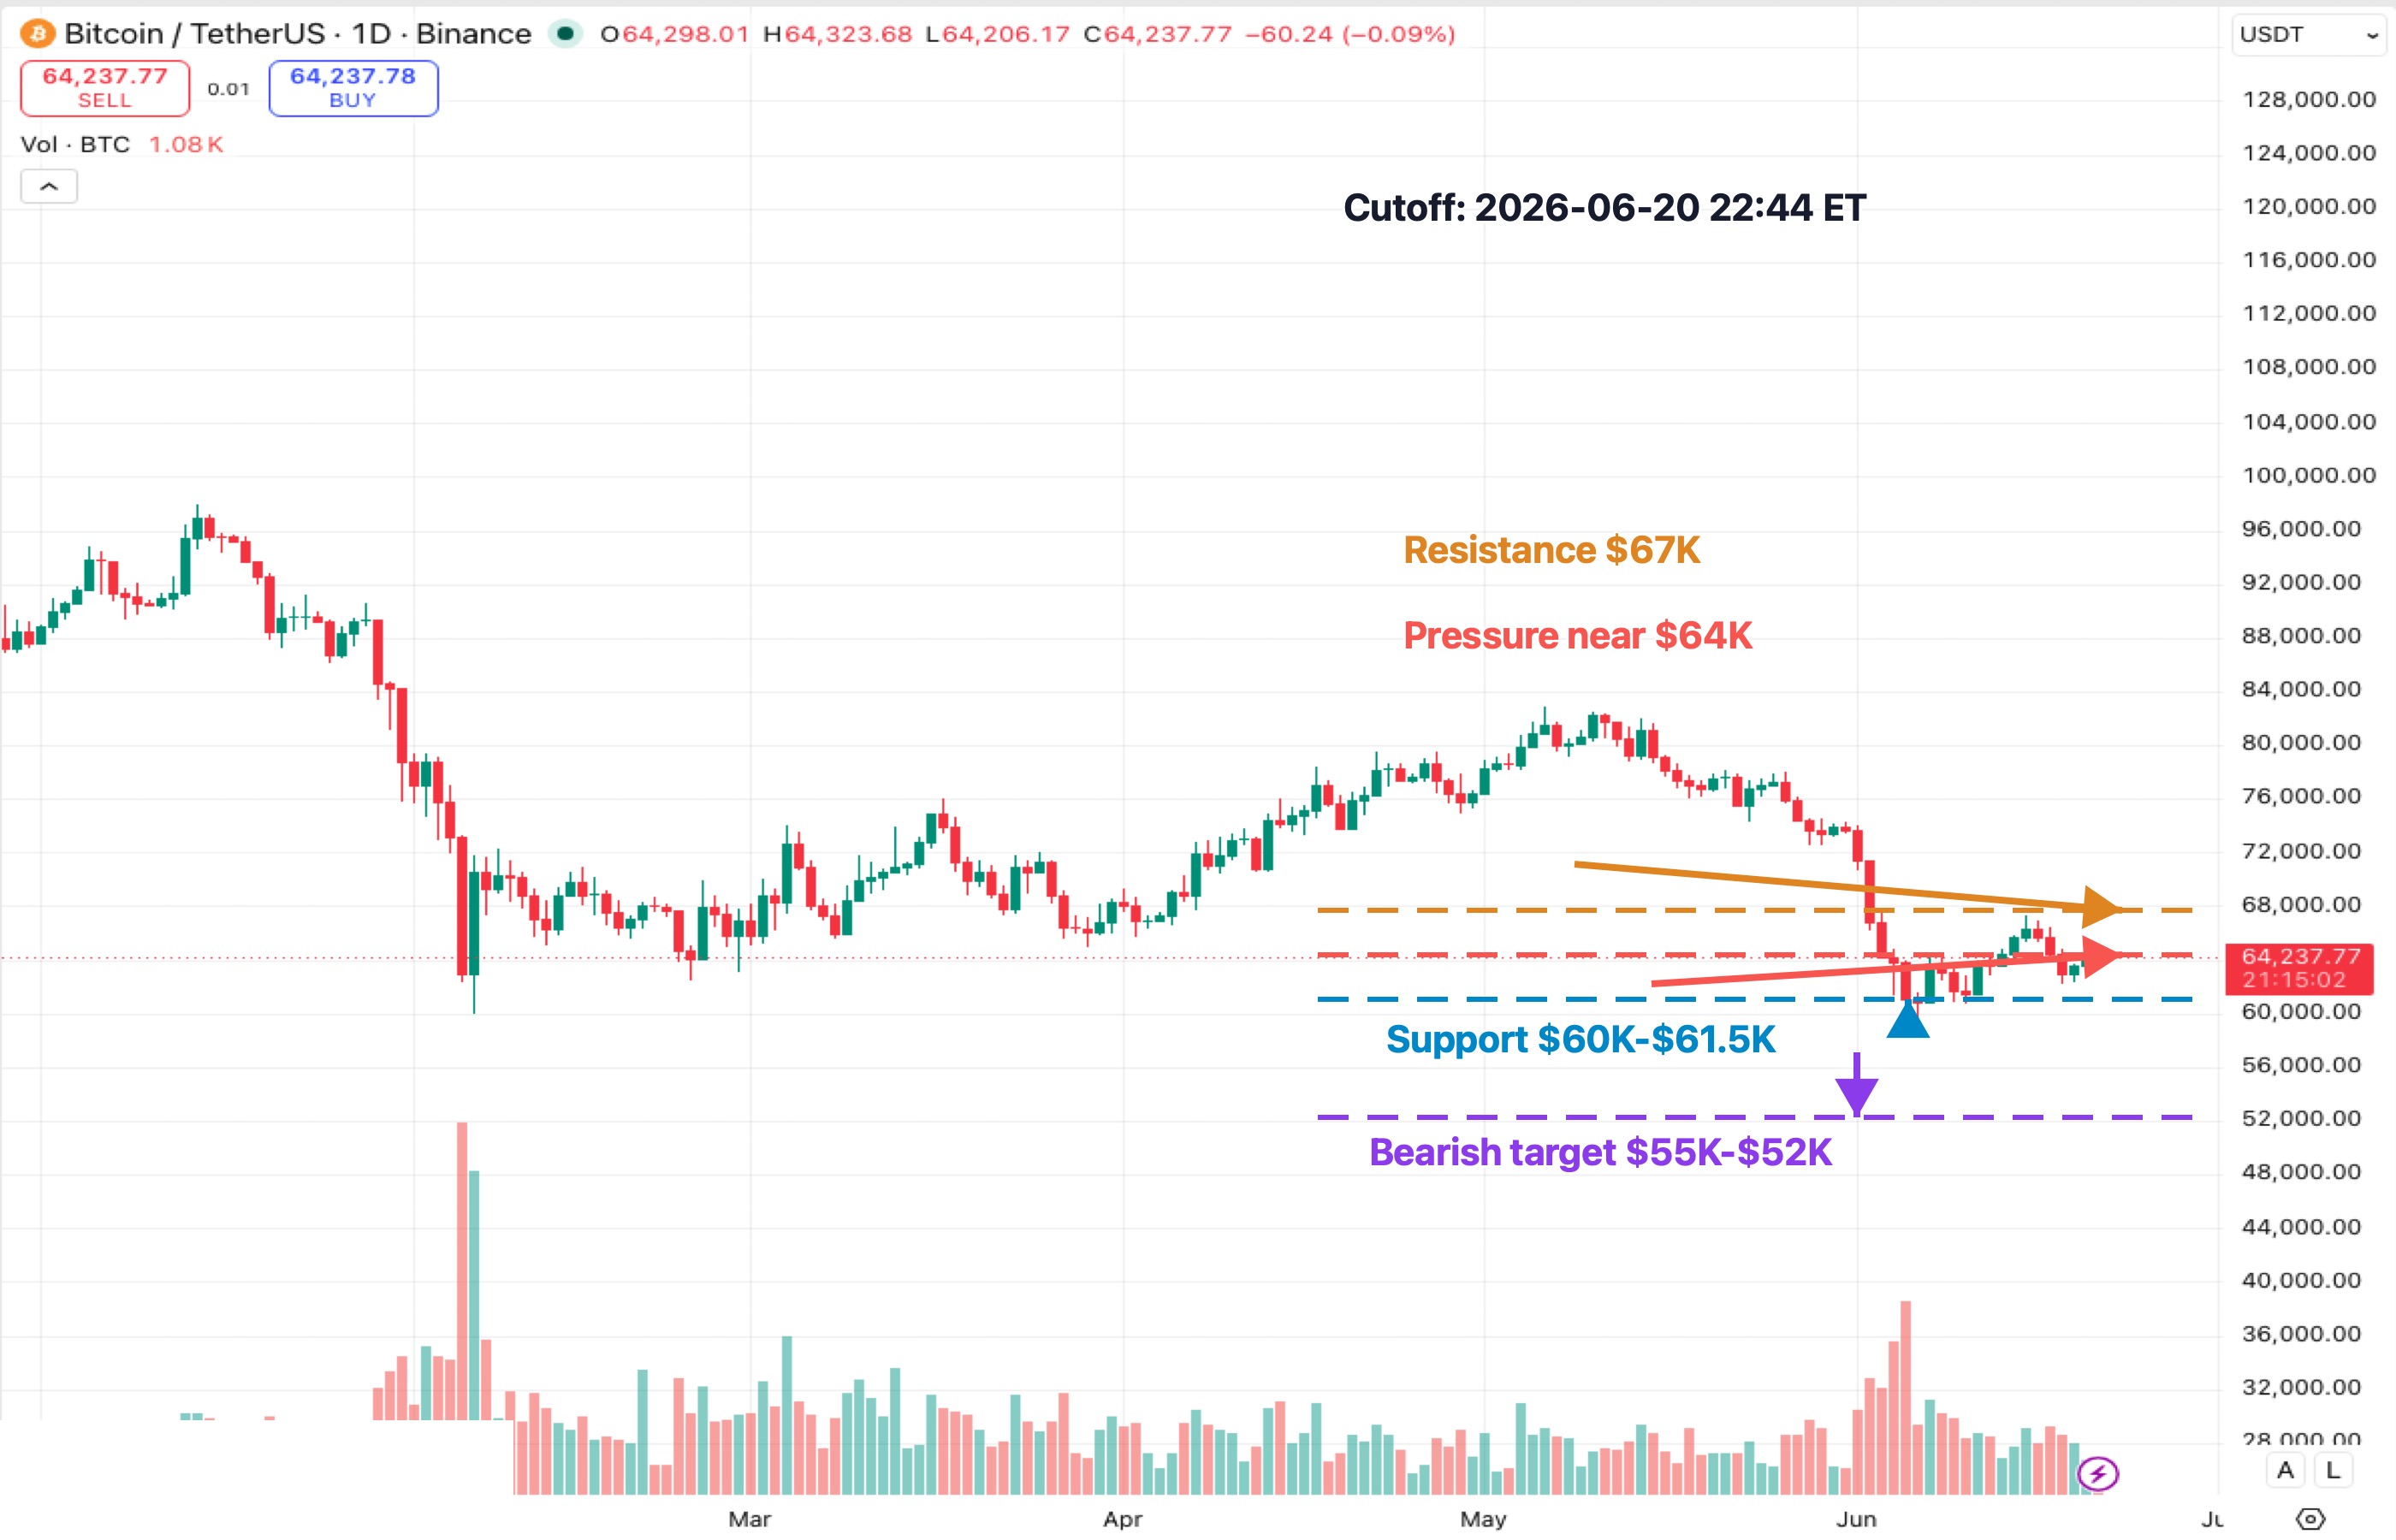
The BTCUSDT daily chart shows why the options market is getting nervous.
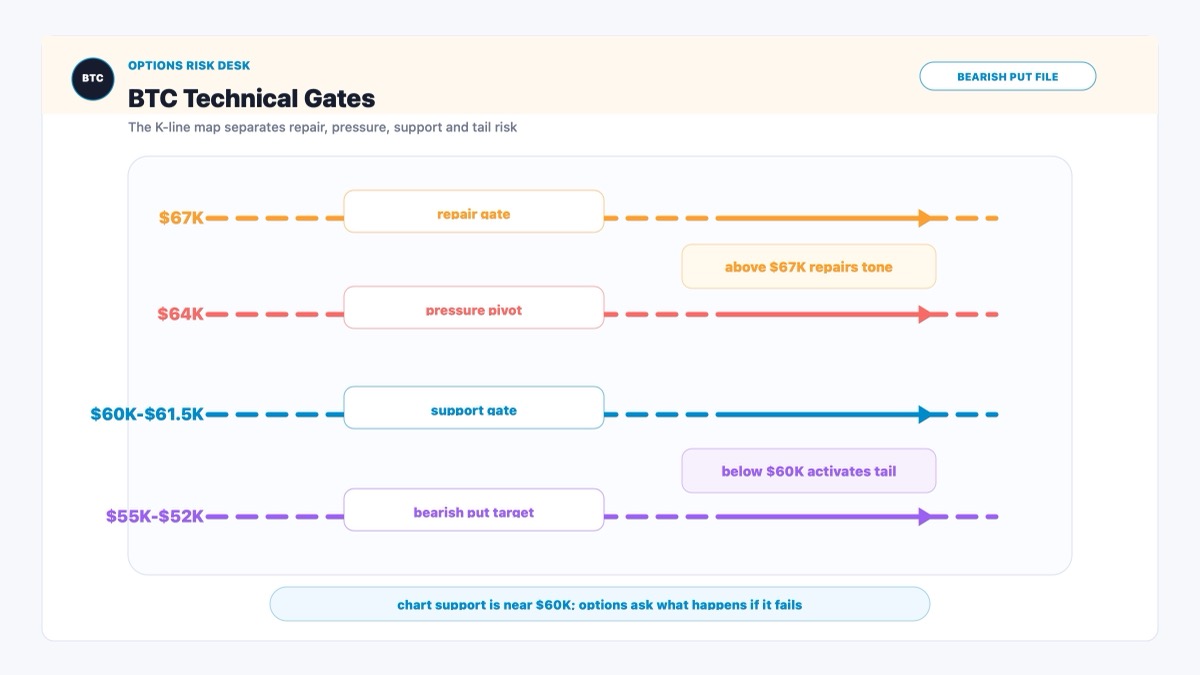
Bitcoin fell sharply from the high-$70K to low-$80K area, bounced from the low-$60K zone, then failed to hold the recovery above $67K. That failure matters because $67K now acts like the first serious repair level. If BTC cannot reclaim it, the bounce looks less like a recovery and more like a pause inside a broader downtrend.
The current pressure area is near $64K. That is where BTC is trying to decide whether it can stabilize or whether the latest rebound is already running out of buyers. A clean move above $64K is helpful, but not enough by itself. The bigger test is whether BTC can push back toward $67K and hold there.
Below spot, the first important support zone is $60K-$61.5K. That lines up with the near-dated put strikes highlighted in the report and with the lower part of the current trading structure. If that zone fails, the chart begins to match the logic of the deeper put buying.
The $55K-$52K area is not the base case from the chart alone. It is the tail-risk zone. But once traders start paying for that tail, the level becomes part of the market’s mental map.
That is how options can change the story. The chart says support is near $60K. The options flow says traders are already asking what happens if support is not enough.
Key Levels to Watch
$67K resistance: BTC needs to reclaim this area to weaken the immediate bearish setup. Until then, rallies can keep looking like failed repairs.
$64K pressure area: This is the short-term pivot around current price. Staying below or chopping around this zone keeps the market vulnerable.
$60K-$61.5K support: This is the first major test if selling resumes. It also lines up with the higher strike put demand.
$55K-$52K downside target zone: This is the deeper hedge zone reflected in the July put activity. A move into this area would likely mean the $60K defense failed.
Conditional Forecast
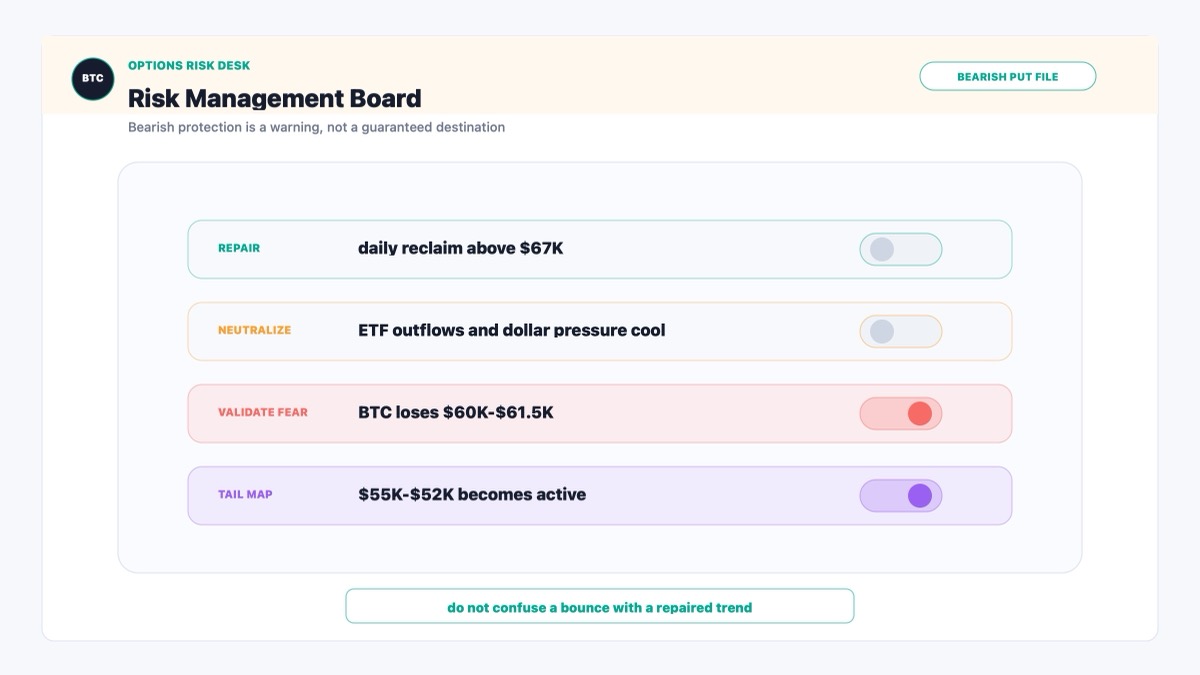
If BTC reclaims $67K and holds it on daily closes, the bearish put flow may begin to look more like defensive hedging than a directional warning. In that case, the market can rebuild toward a more balanced range.
If BTC stays trapped near $64K and fails to generate follow-through, the $60K-$61.5K zone becomes the next serious test. That is where traders will find out whether spot buyers are still willing to defend the market.
If BTC breaks below $60K with rising volume, the options market’s deeper strikes become much more relevant. The $55K-$52K area would no longer be just a distant hedge. It would become the next visible downside map.
If ETF outflows slow, the dollar cools and Strategy-related pressure fades, BTC could stabilize before the lower put strikes come into play. The bearish setup depends on pressure staying clustered. If those pressures separate, the market gets room to breathe.
Investment Takeaway
The investment takeaway is not that Bitcoin is doomed to $52K. That would be too neat, and markets enjoy humiliating neatness.
The better takeaway is that Bitcoin is in a risk-management zone. The chart is weak enough that traders are paying for downside protection, but not broken enough to say the tail target is inevitable.
For short-term traders, $67K and $60K are the big gates. Reclaiming the first one reduces bearish pressure. Losing the second one validates the put-heavy fear.
For investors, the message is simpler: this is not the moment to confuse a bounce with a repaired trend. If Bitcoin can stabilize while bearish protection is crowded, that would be constructive. If it cannot, the market has already told us where the next anxiety levels sit.
Sources
- CoinDesk: Bitcoin traders load up on bearish bets all the way down to $52,000
- Laevitas options flow data cited by CoinDesk, including near-dated Deribit BTC put activity.
- TradingView: BINANCE:BTCUSDT daily chart
|
DISCLAIMER:
1. All content on this website (including but not limited to articles, data, charts, and analyses) is for general informational purposes only and does not constitute any form of investment advice, trading recommendation, or financial guidance. 2. Cryptocurrencies and digital assets are subject to extreme price volatility and high investment risk; you may lose part or all of your principal. Past performance does not predict future results. 3. The information on this website is based on sources we believe to be reliable, but we do not guarantee its accuracy, completeness, or timeliness. Any investment decisions made based on this website’s information are at your own risk. 4. We strongly recommend that you conduct your own thorough research and consult an independent, licensed financial advisor before making any investment decisions. |
Recommended reading
Latest News