Key Takeaways
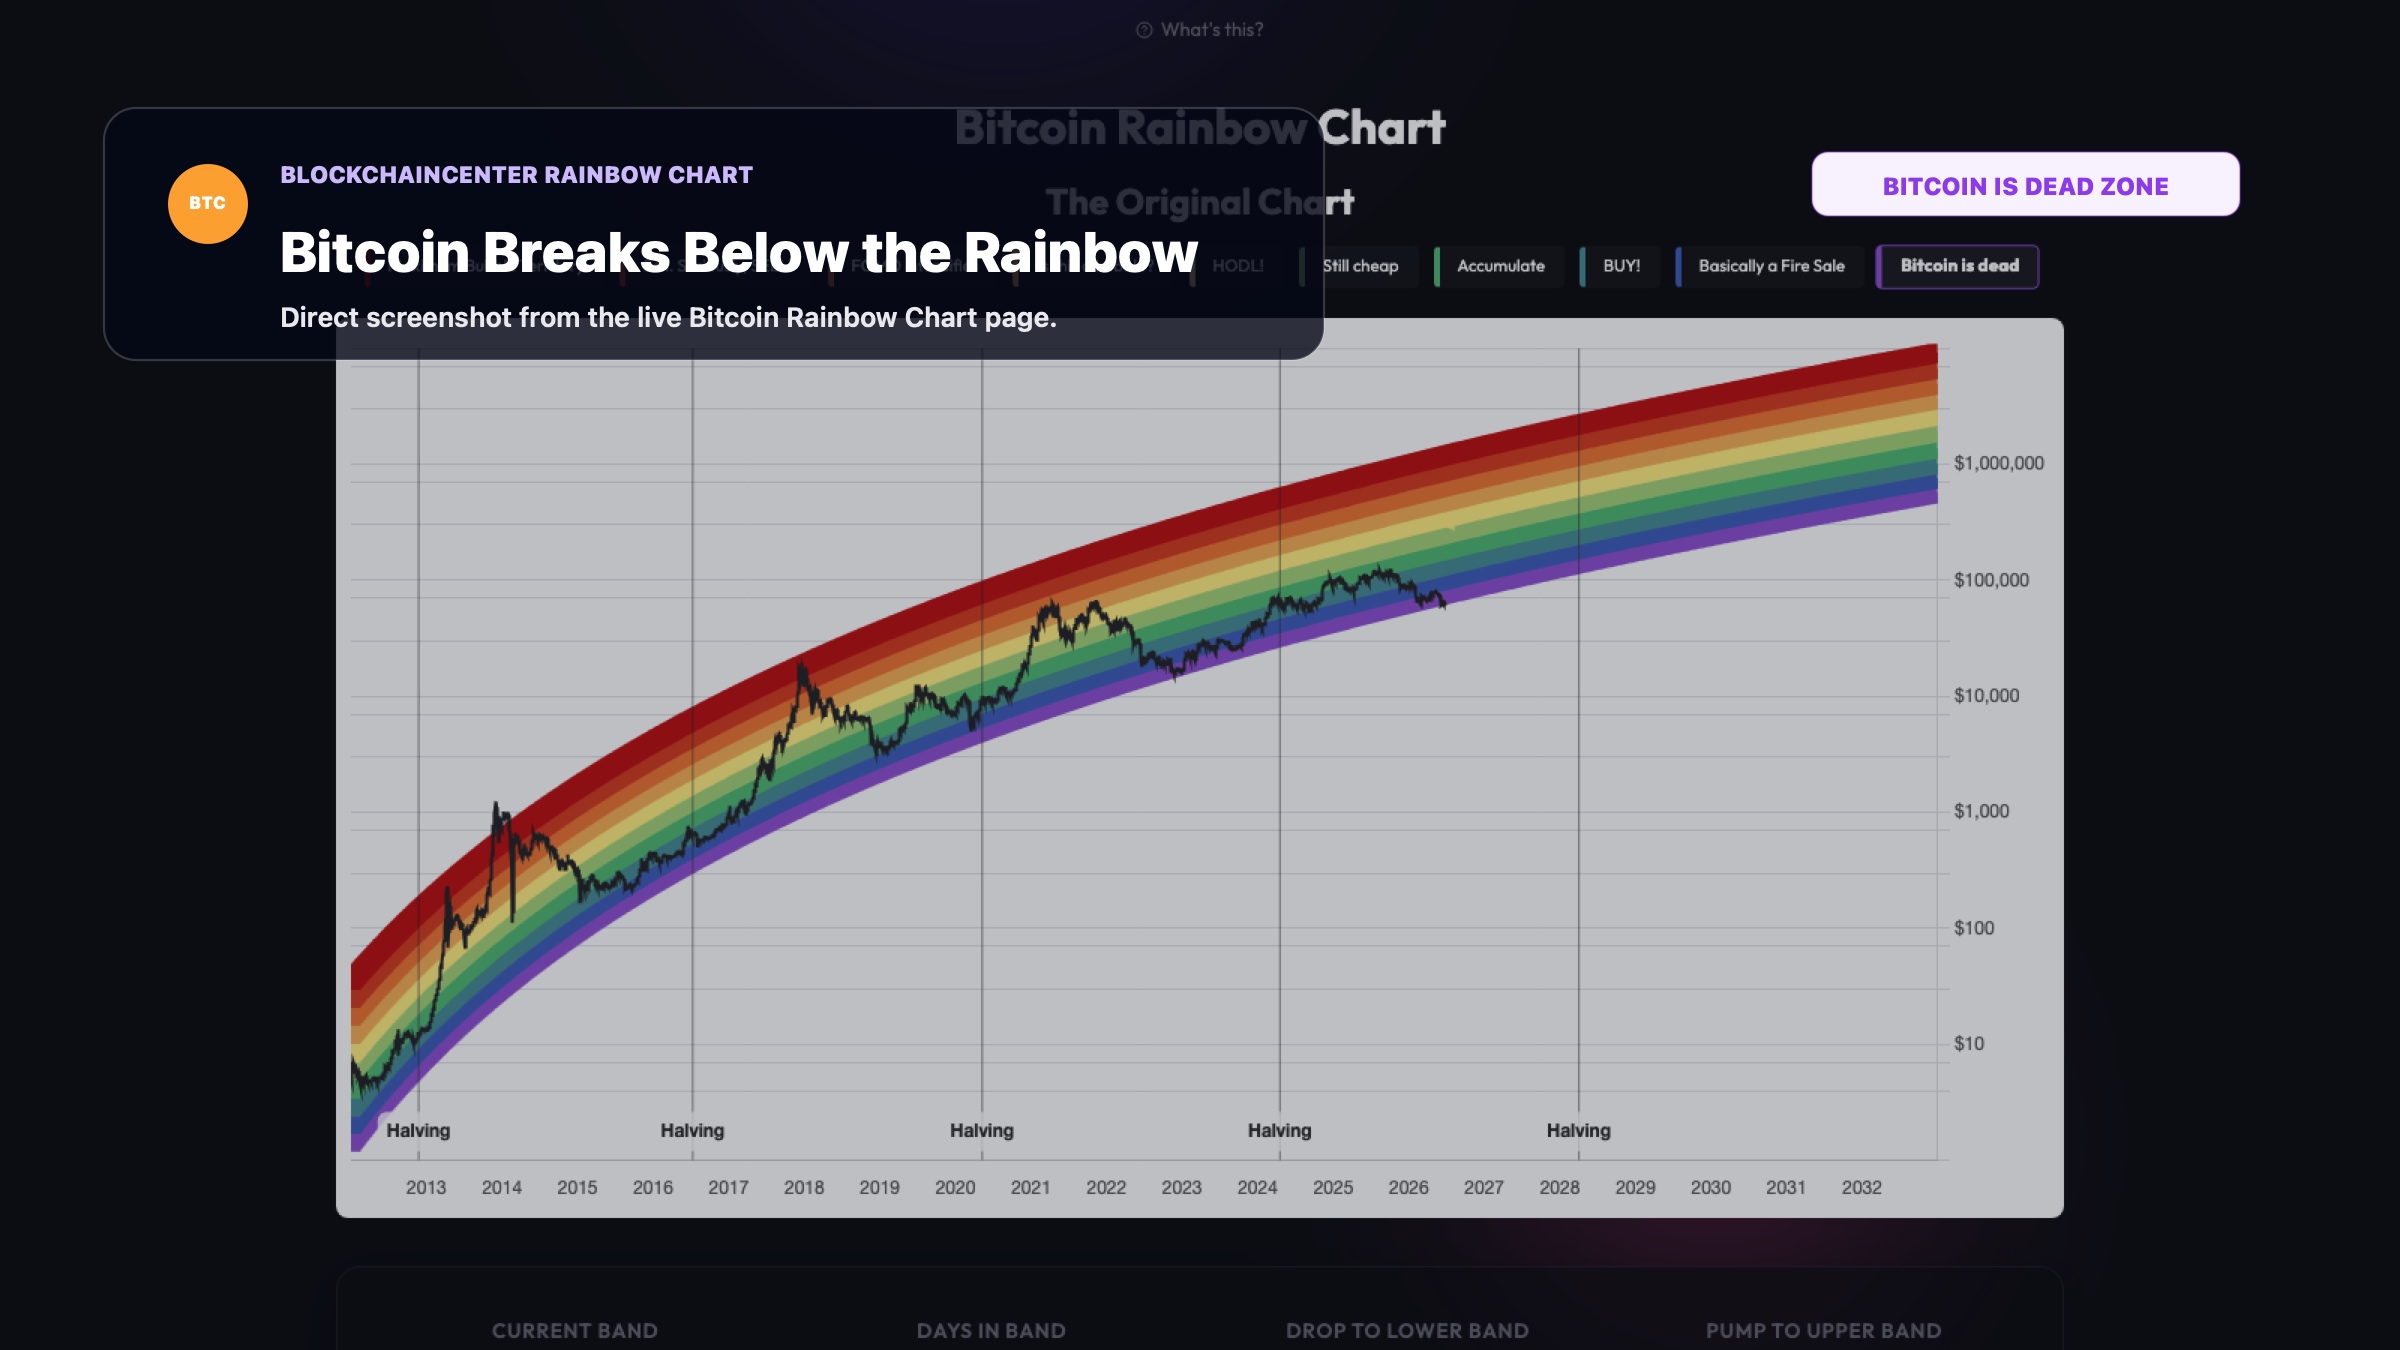
- Bitcoin has fallen below the lowest band of the Rainbow Chart near $62,500, entering the model's old "Bitcoin Is Dead" zone.
- The move says less about Bitcoin being dead and more about old retail-era valuation models losing precision in an ETF and institution-driven market.
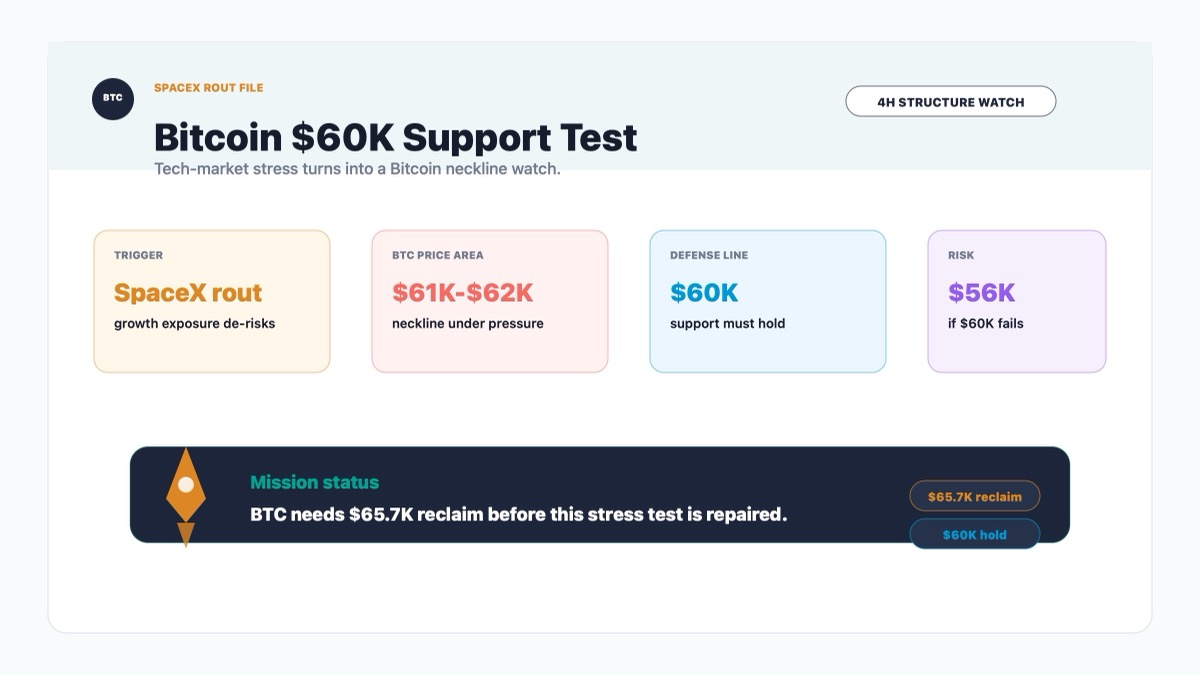
- The key repair zone is $65,000-$70,000. Below that, the chart remains a warning about weak structure, not a clean bottom signal.
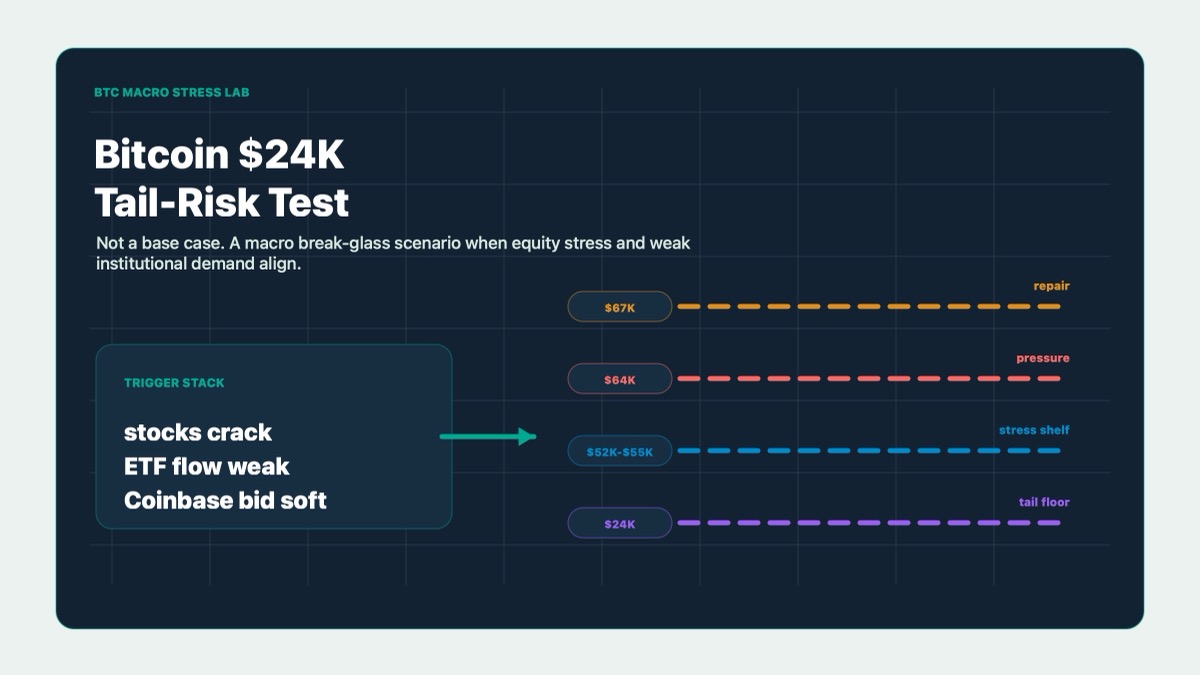
- A deeper slide toward the low-$50,000s cannot be ruled out if risk sentiment keeps draining and buyers fail to defend the $60,000 area.
What Happened
Bitcoin just did something that looks dramatic because the model around it was built to be dramatic.
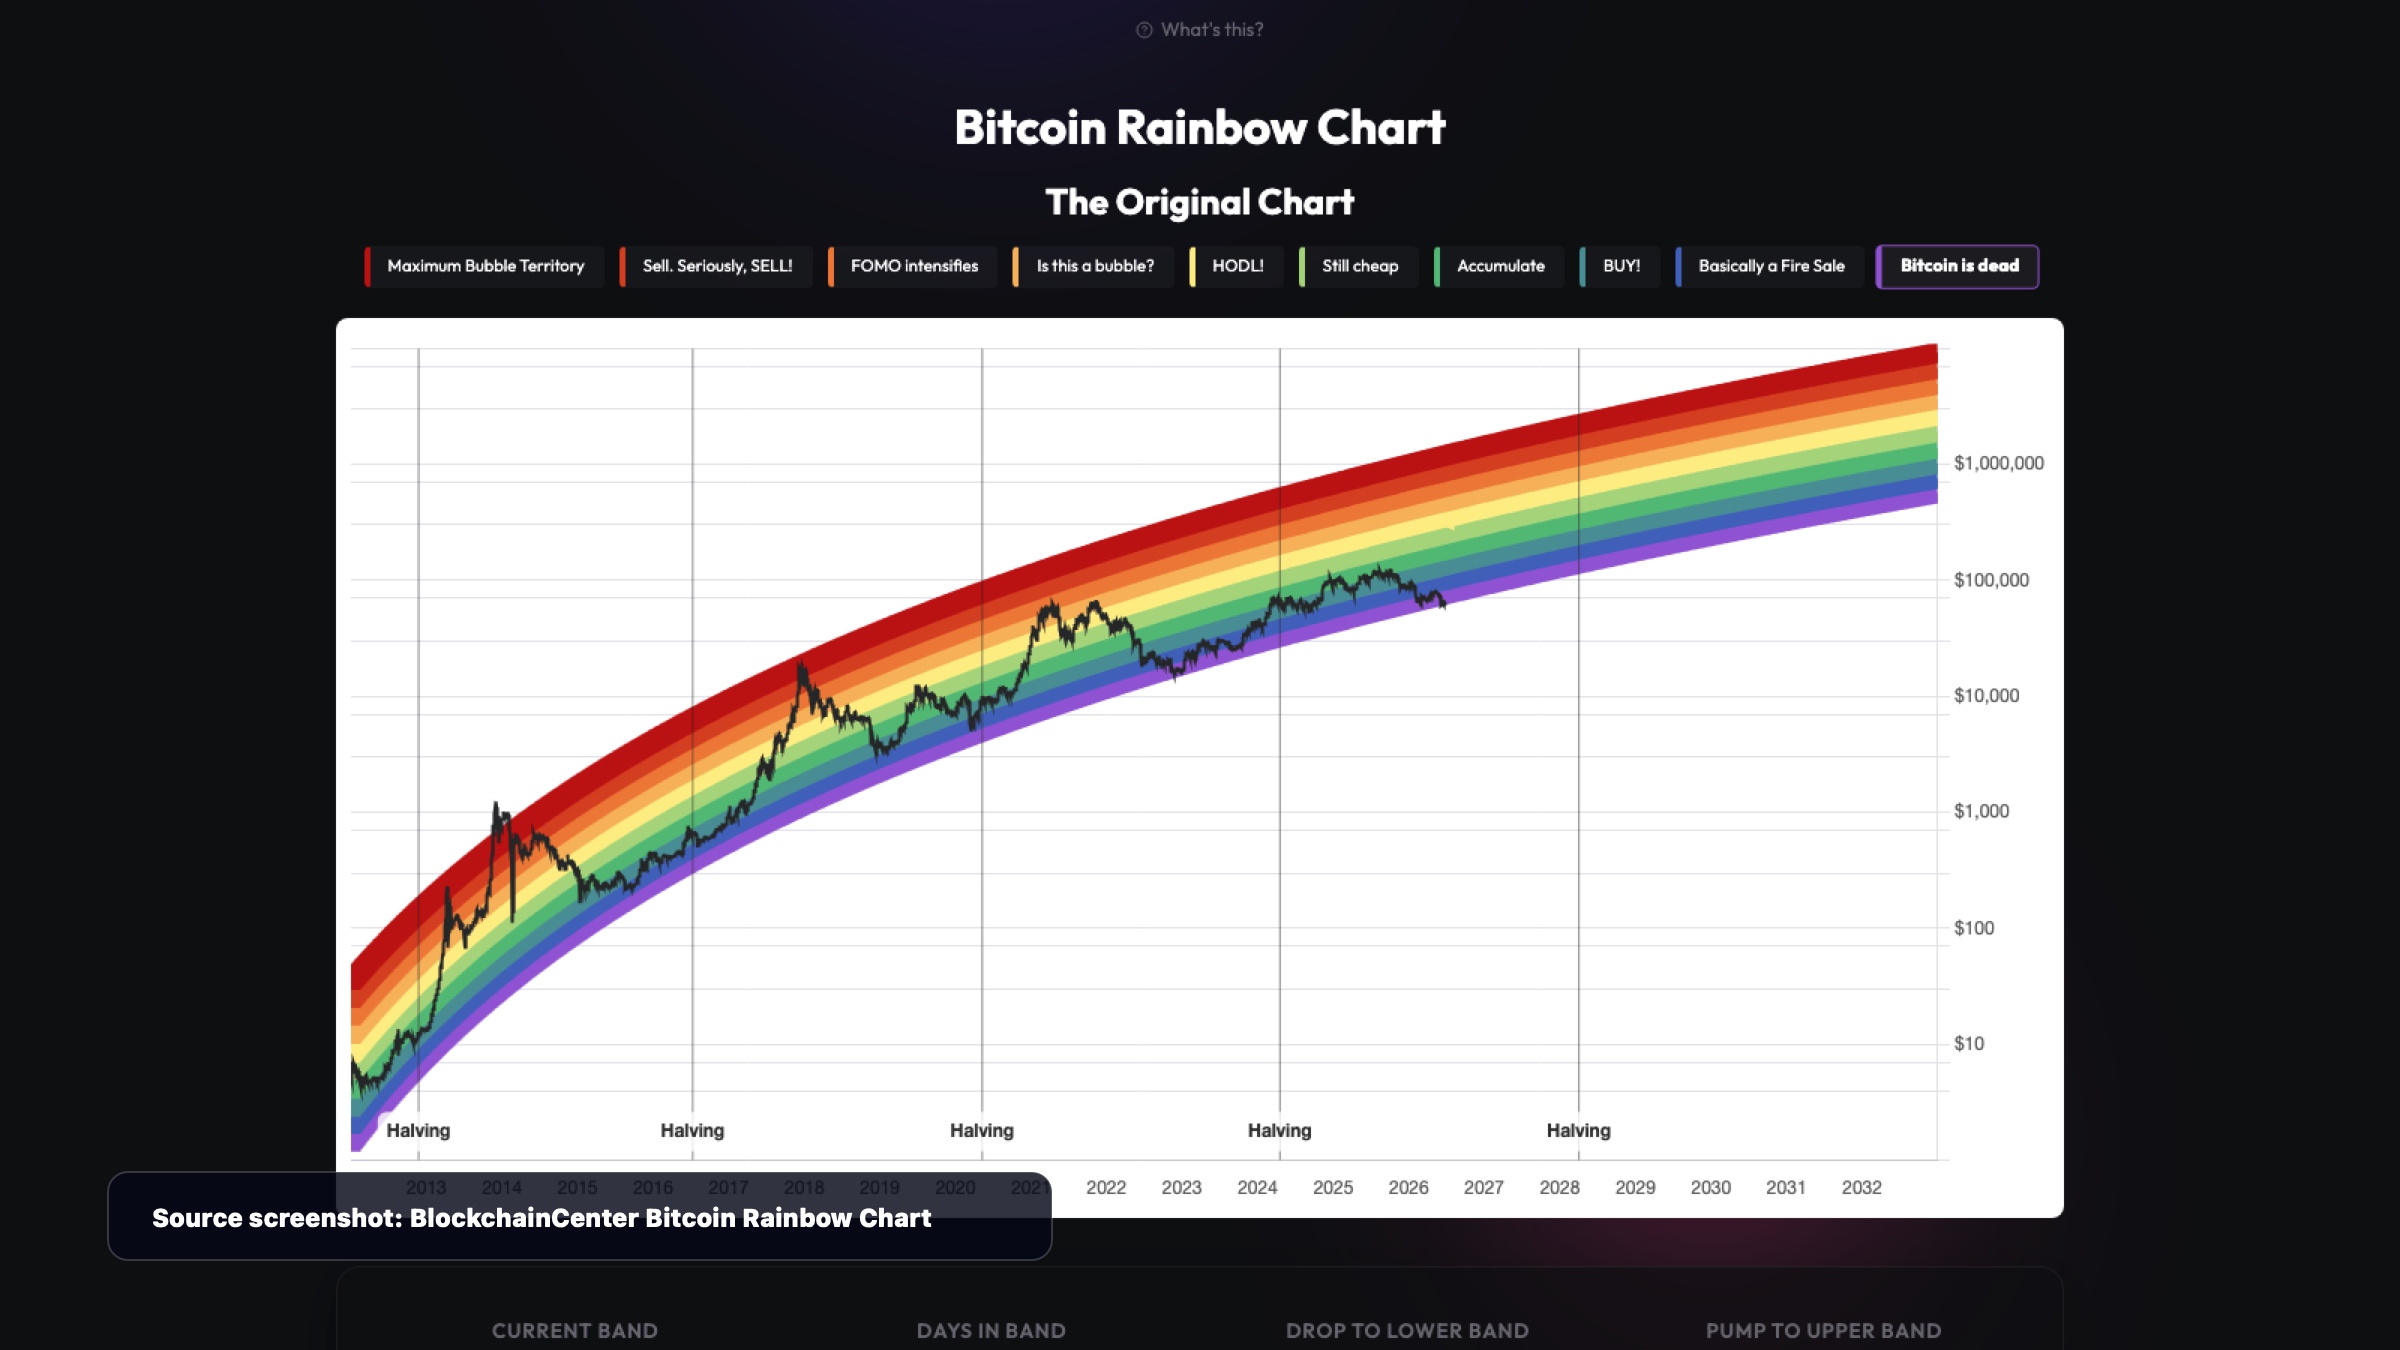
According to CoinDesk, BTC fell below the lowest band of the long-running Bitcoin Rainbow Chart for only the second time, dropping near $62,500 after a roughly 50% decline from its October 2025 all-time high around $126,000. That pushed Bitcoin into the original model's purple "Bitcoin Is Dead" zone.
That phrase is doing a lot of work. It sounds like an obituary. In practice, it is more like a market cartoon that became famous enough for people to confuse the cartoon with the map. The Rainbow Chart uses a logarithmic growth curve and colored sentiment bands to frame Bitcoin's long-term cycle. It was never a magic machine. It was a way to say, with a smile, "this part of the cycle looks cheap" or "this part looks overheated."
The problem is that the model is now under stress from both sides. Bitcoin did not reach the upper red euphoria bands near its October 2025 peak, even though price hit a new high. Now, on the downside, BTC has slipped below the floor. That creates an uncomfortable question: is Bitcoin deeply undervalued, or is the Rainbow Chart simply no longer calibrated for this market?
The answer is probably closer to the second one.
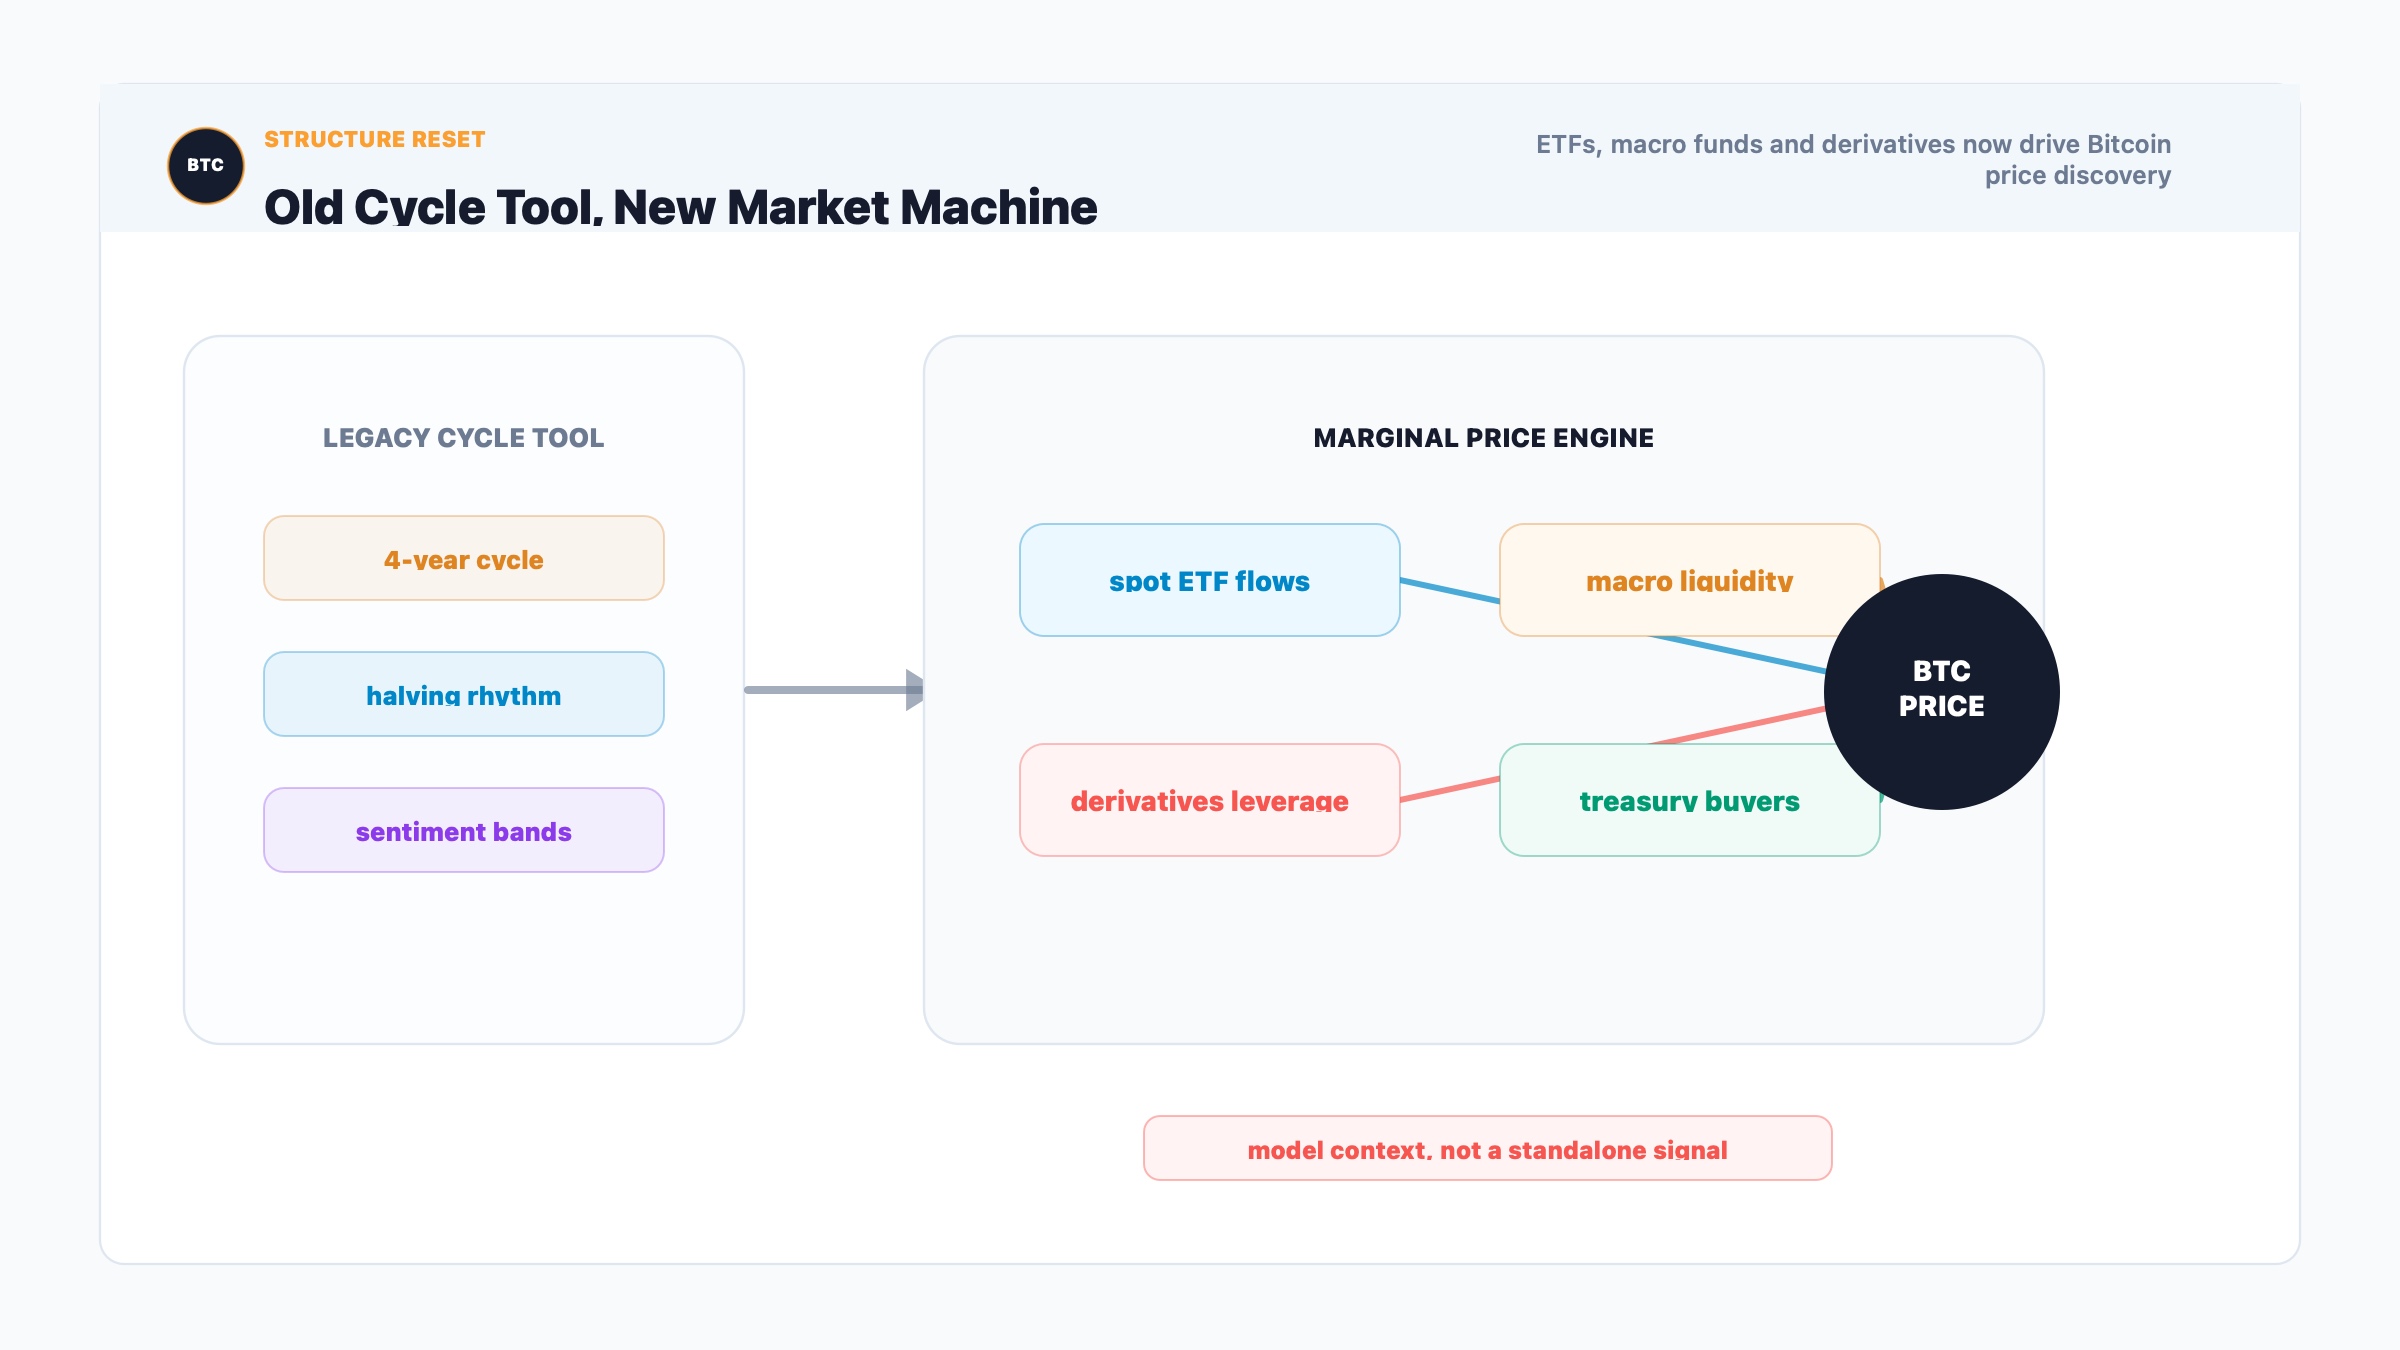
Bitcoin is no longer the same asset that early-cycle charts were designed around. Spot ETFs, corporate treasuries, macro funds, derivatives, and cross-asset risk models now sit inside the price discovery machine. The old cycle tools still tell us something about sentiment. They just should not be treated like a courtroom verdict.
Why This Matters for Bitcoin and Crypto Markets
This matters because Bitcoin investors often want a single line to do too much.
The Rainbow Chart break is not a liquidation cascade by itself. It is not a protocol failure. It is not proof that the network is weaker. Blocks are still coming. The supply schedule is still boring in the best possible way. What broke is the comfort of an old visual framework.
That is still important.
When a famous model fails at the edges, it changes how people talk about risk. Some traders will say the break is a generational value signal because previous "death" zones appeared near emotional lows. Others will say the model has finally been outgrown because ETF flows and institutional balance sheets have changed the rhythm of Bitcoin cycles. Both arguments can sound smart. The market does not owe either camp a quick answer.
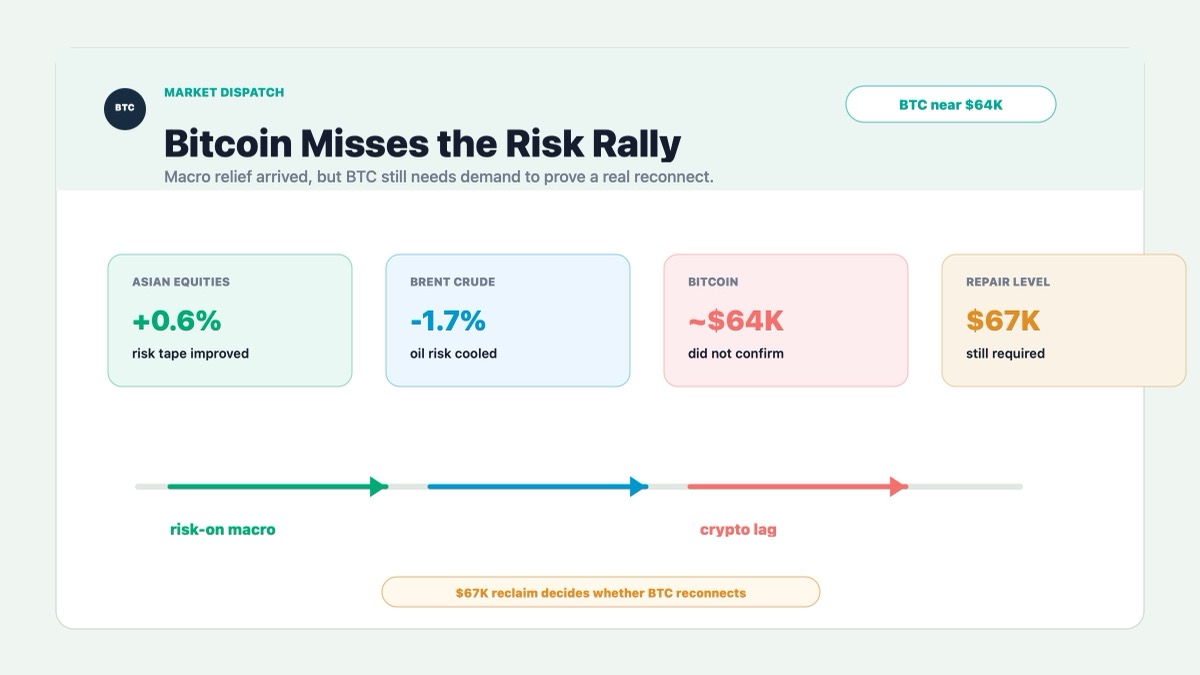
The practical read is simpler: Bitcoin is sitting below a psychological model floor and below the repair zone that would make the breakdown look like a fakeout. Until BTC can reclaim the mid-to-high $60,000s, the market is not proving that the Rainbow break was a bear trap. It is proving that buyers are still negotiating from a lower floor.
For the broader crypto market, that matters because Bitcoin remains the risk anchor. If BTC is being repriced as a macro-sensitive asset rather than a clean four-year-cycle machine, altcoins do not get to pretend they live in a separate weather system. Liquidity first hits Bitcoin. Then it decides whether the rest of crypto deserves oxygen.
Historical Parallel
The closest historical parallel is not a perfect Rainbow Chart repeat. It is the late-2022 Bitcoin bottom after the FTX collapse.
In November 2022, FTX filed for bankruptcy after a liquidity crisis, a failed rescue attempt, and a market-wide loss of trust. Bitcoin fell to levels not seen in roughly two years, and the panic spread beyond one exchange into lenders, funds, exchange tokens, and wrapped institutional products. The market was not merely repricing price. It was repricing the credibility of crypto's plumbing.
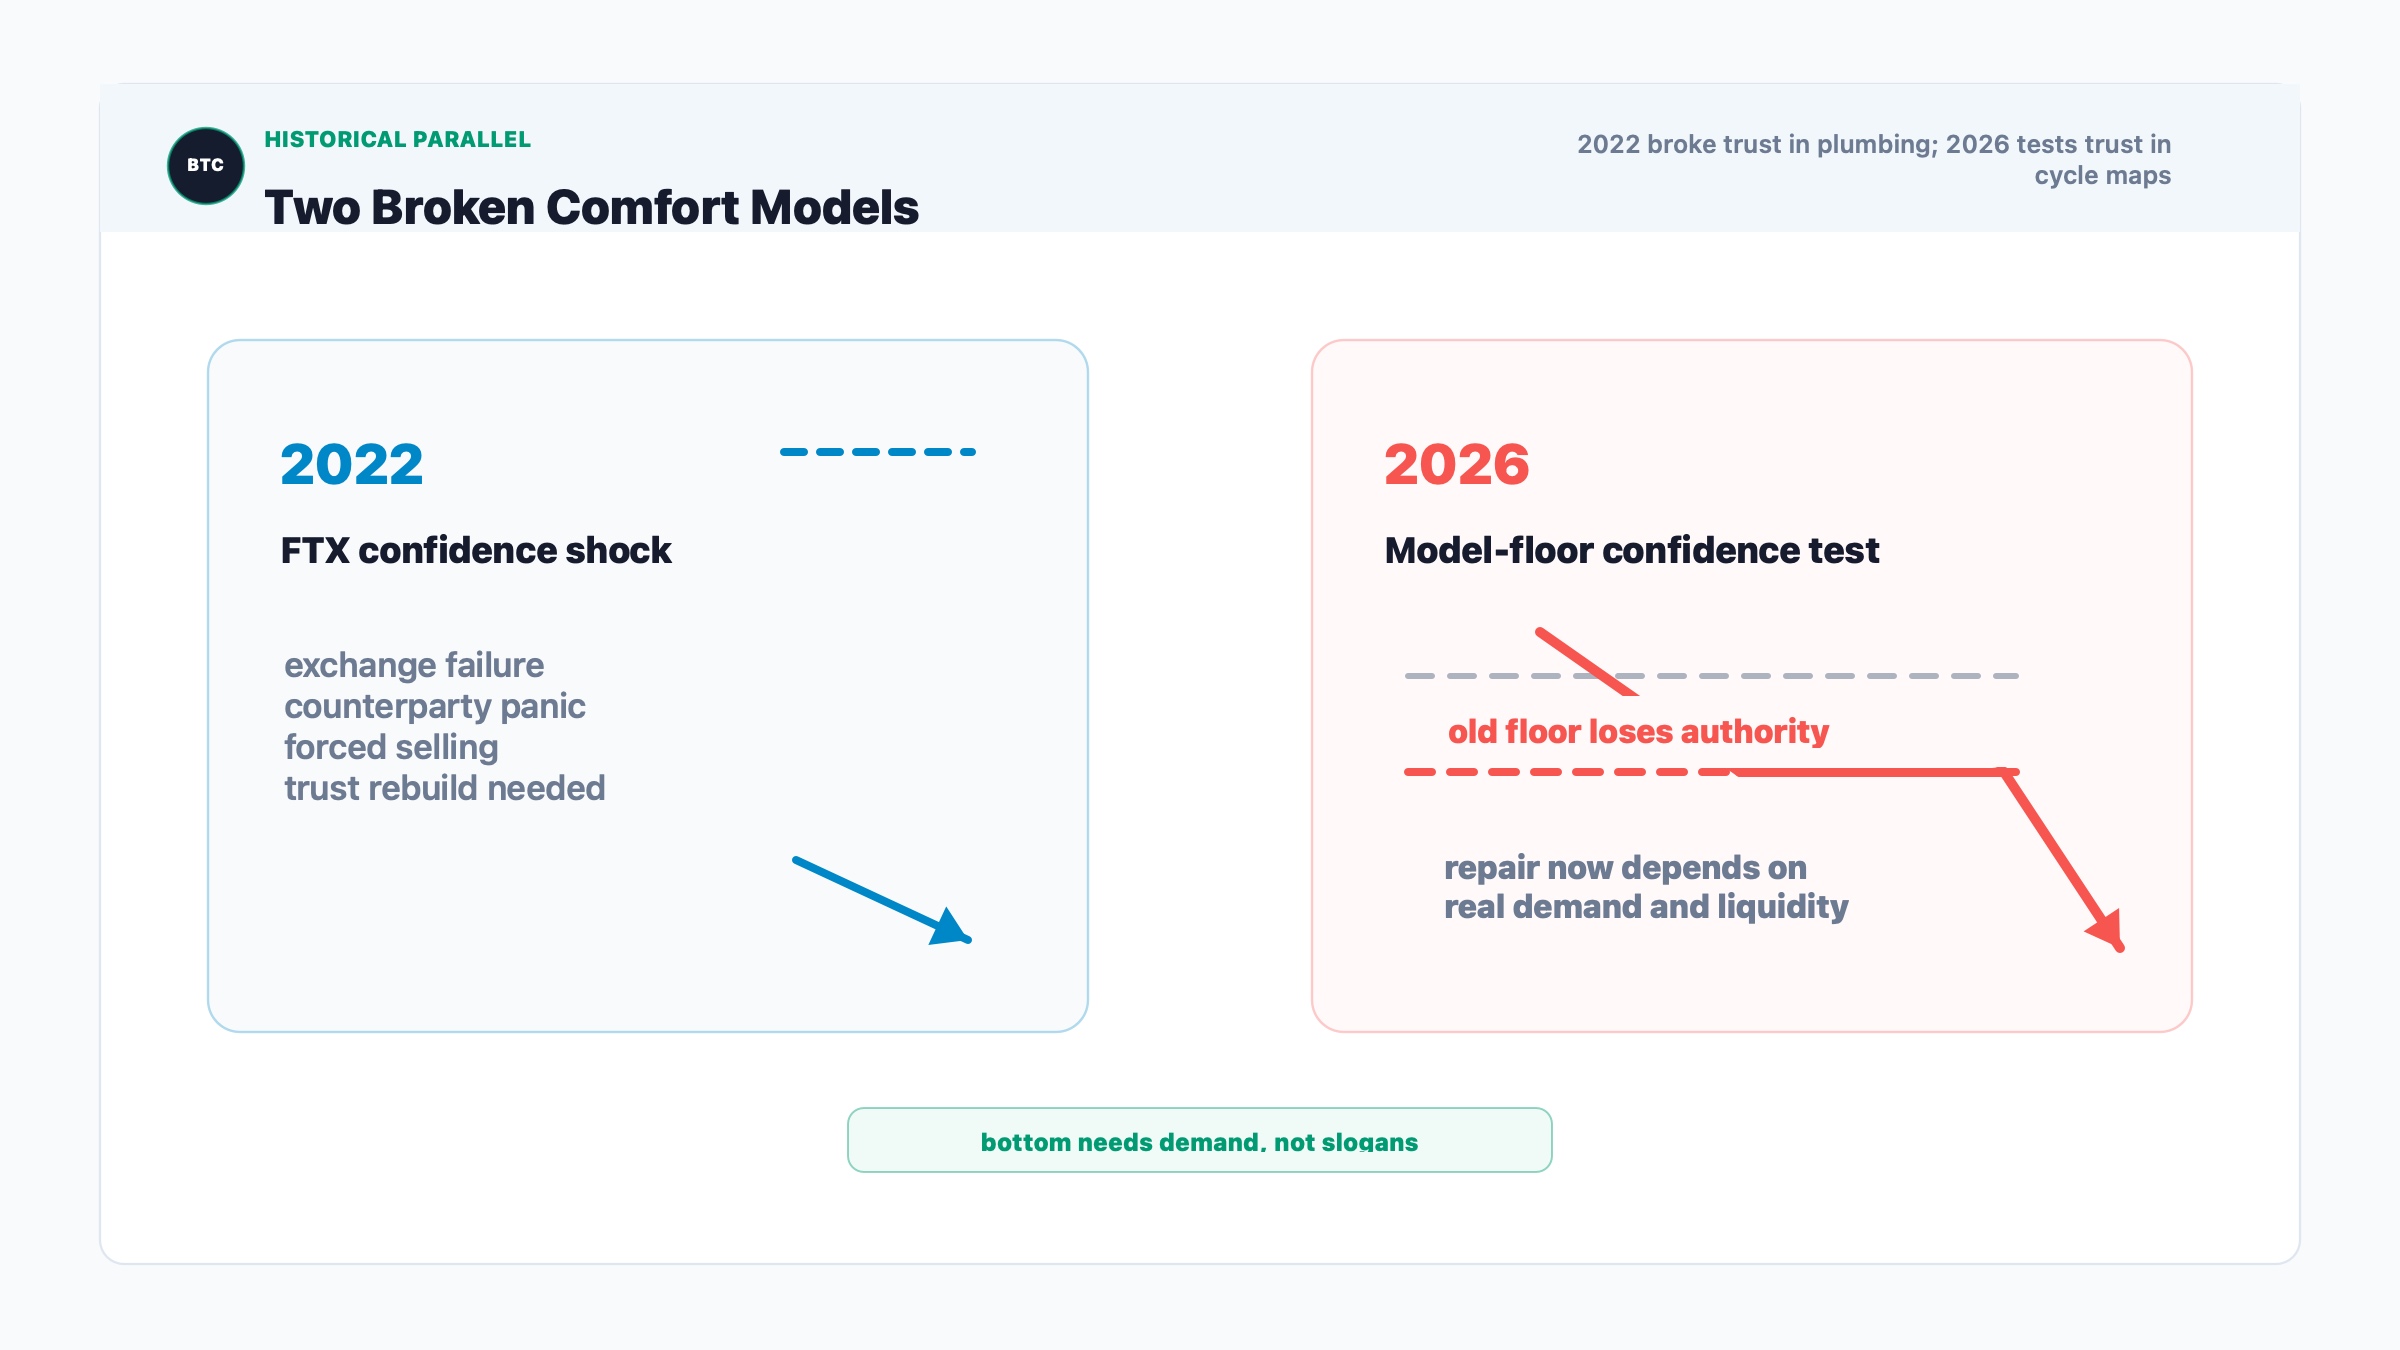
The similarity is the emotional setup. In both cases, Bitcoin traded in a zone where old confidence mechanisms stopped calming people down. In 2022, the old belief was that large centralized crypto institutions were sturdier than they looked. In 2026, the old belief is that cycle charts and rainbow bands still offer a reliable long-term valuation floor. Both moments forced investors to ask whether a trusted mental model had expired.
The difference is the source of stress. The FTX episode was an institutional solvency shock. It exposed fraud, leverage, counterparty risk, and hidden balance-sheet rot. The current Rainbow Chart break is more of a market-structure shock. Bitcoin is not falling because the network failed or because one exchange blew up. It is falling because price discovery now runs through ETFs, macro positioning, institutional flows, derivatives, and risk-on/risk-off rotations that older Bitcoin models were not built to absorb.
The lesson for current BTC judgment is that a famous "death" zone can mark exhaustion, but only after the market stops finding new sellers. In 2022, bottoming required forced selling to burn out and trust to rebuild. Today, a similar bottom call needs evidence that ETF flows stabilize, the $60,000 area stops leaking, and BTC can recover the $65,000-$70,000 zone. Without that, the Rainbow Chart is not a buy signal. It is a broken thermometer in a colder room.
Bitcoin Price Reaction and K-Line Analysis
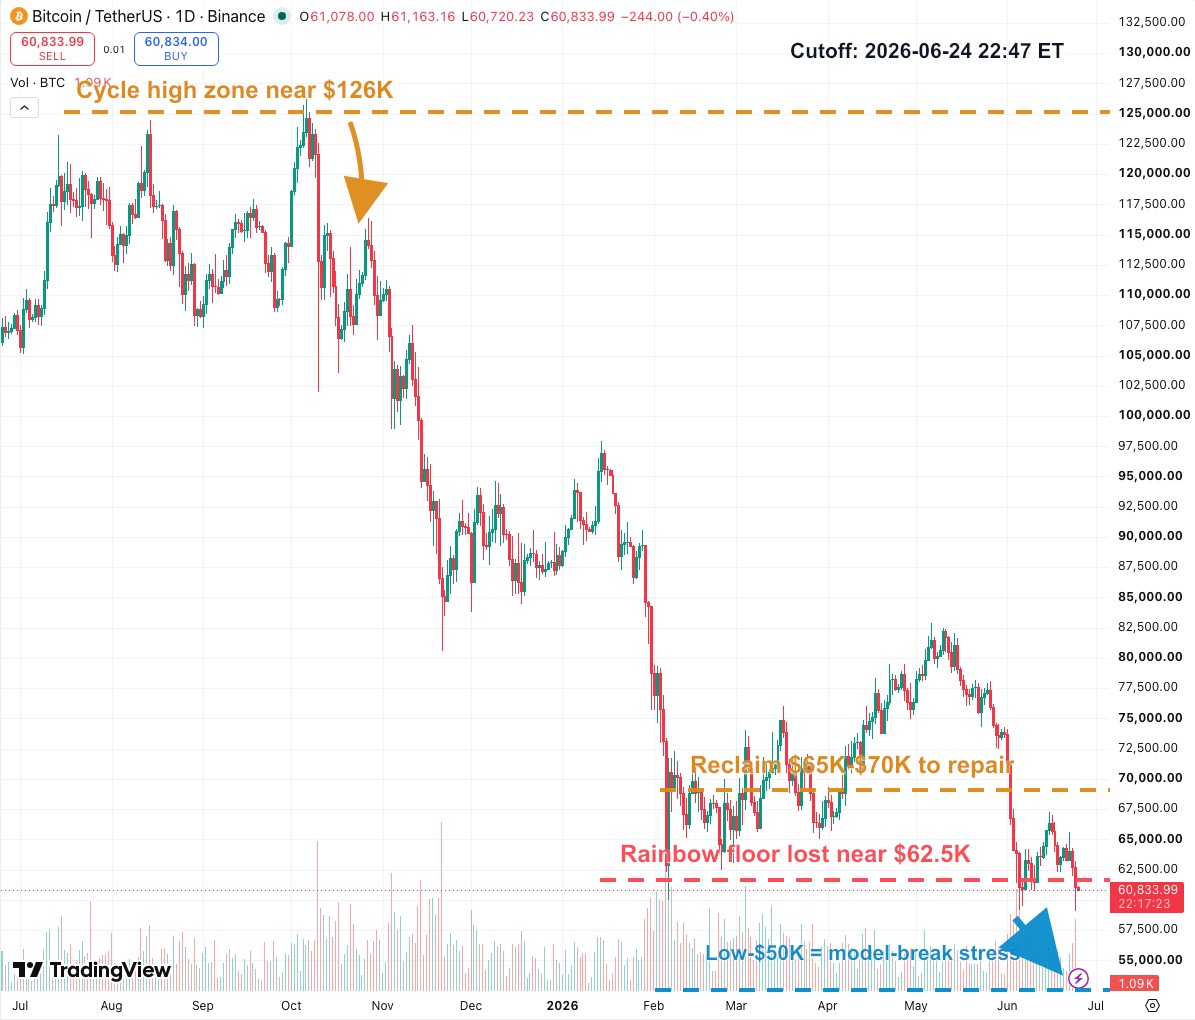
The daily BTCUSDT chart gives the Rainbow Chart story a cleaner shape.
Bitcoin's October 2025 high near $126,000 sits on the left side of the chart like the old regime's last confident sentence. From there, BTC bled lower, broke hard in early 2026, tried to rebuild from February into May, and then failed again before sliding back toward the $60,000-$62,500 area.
That sequence matters. This is not a single red candle that can be dismissed as noise. It is a lower-structure market that already failed one major rebound attempt.
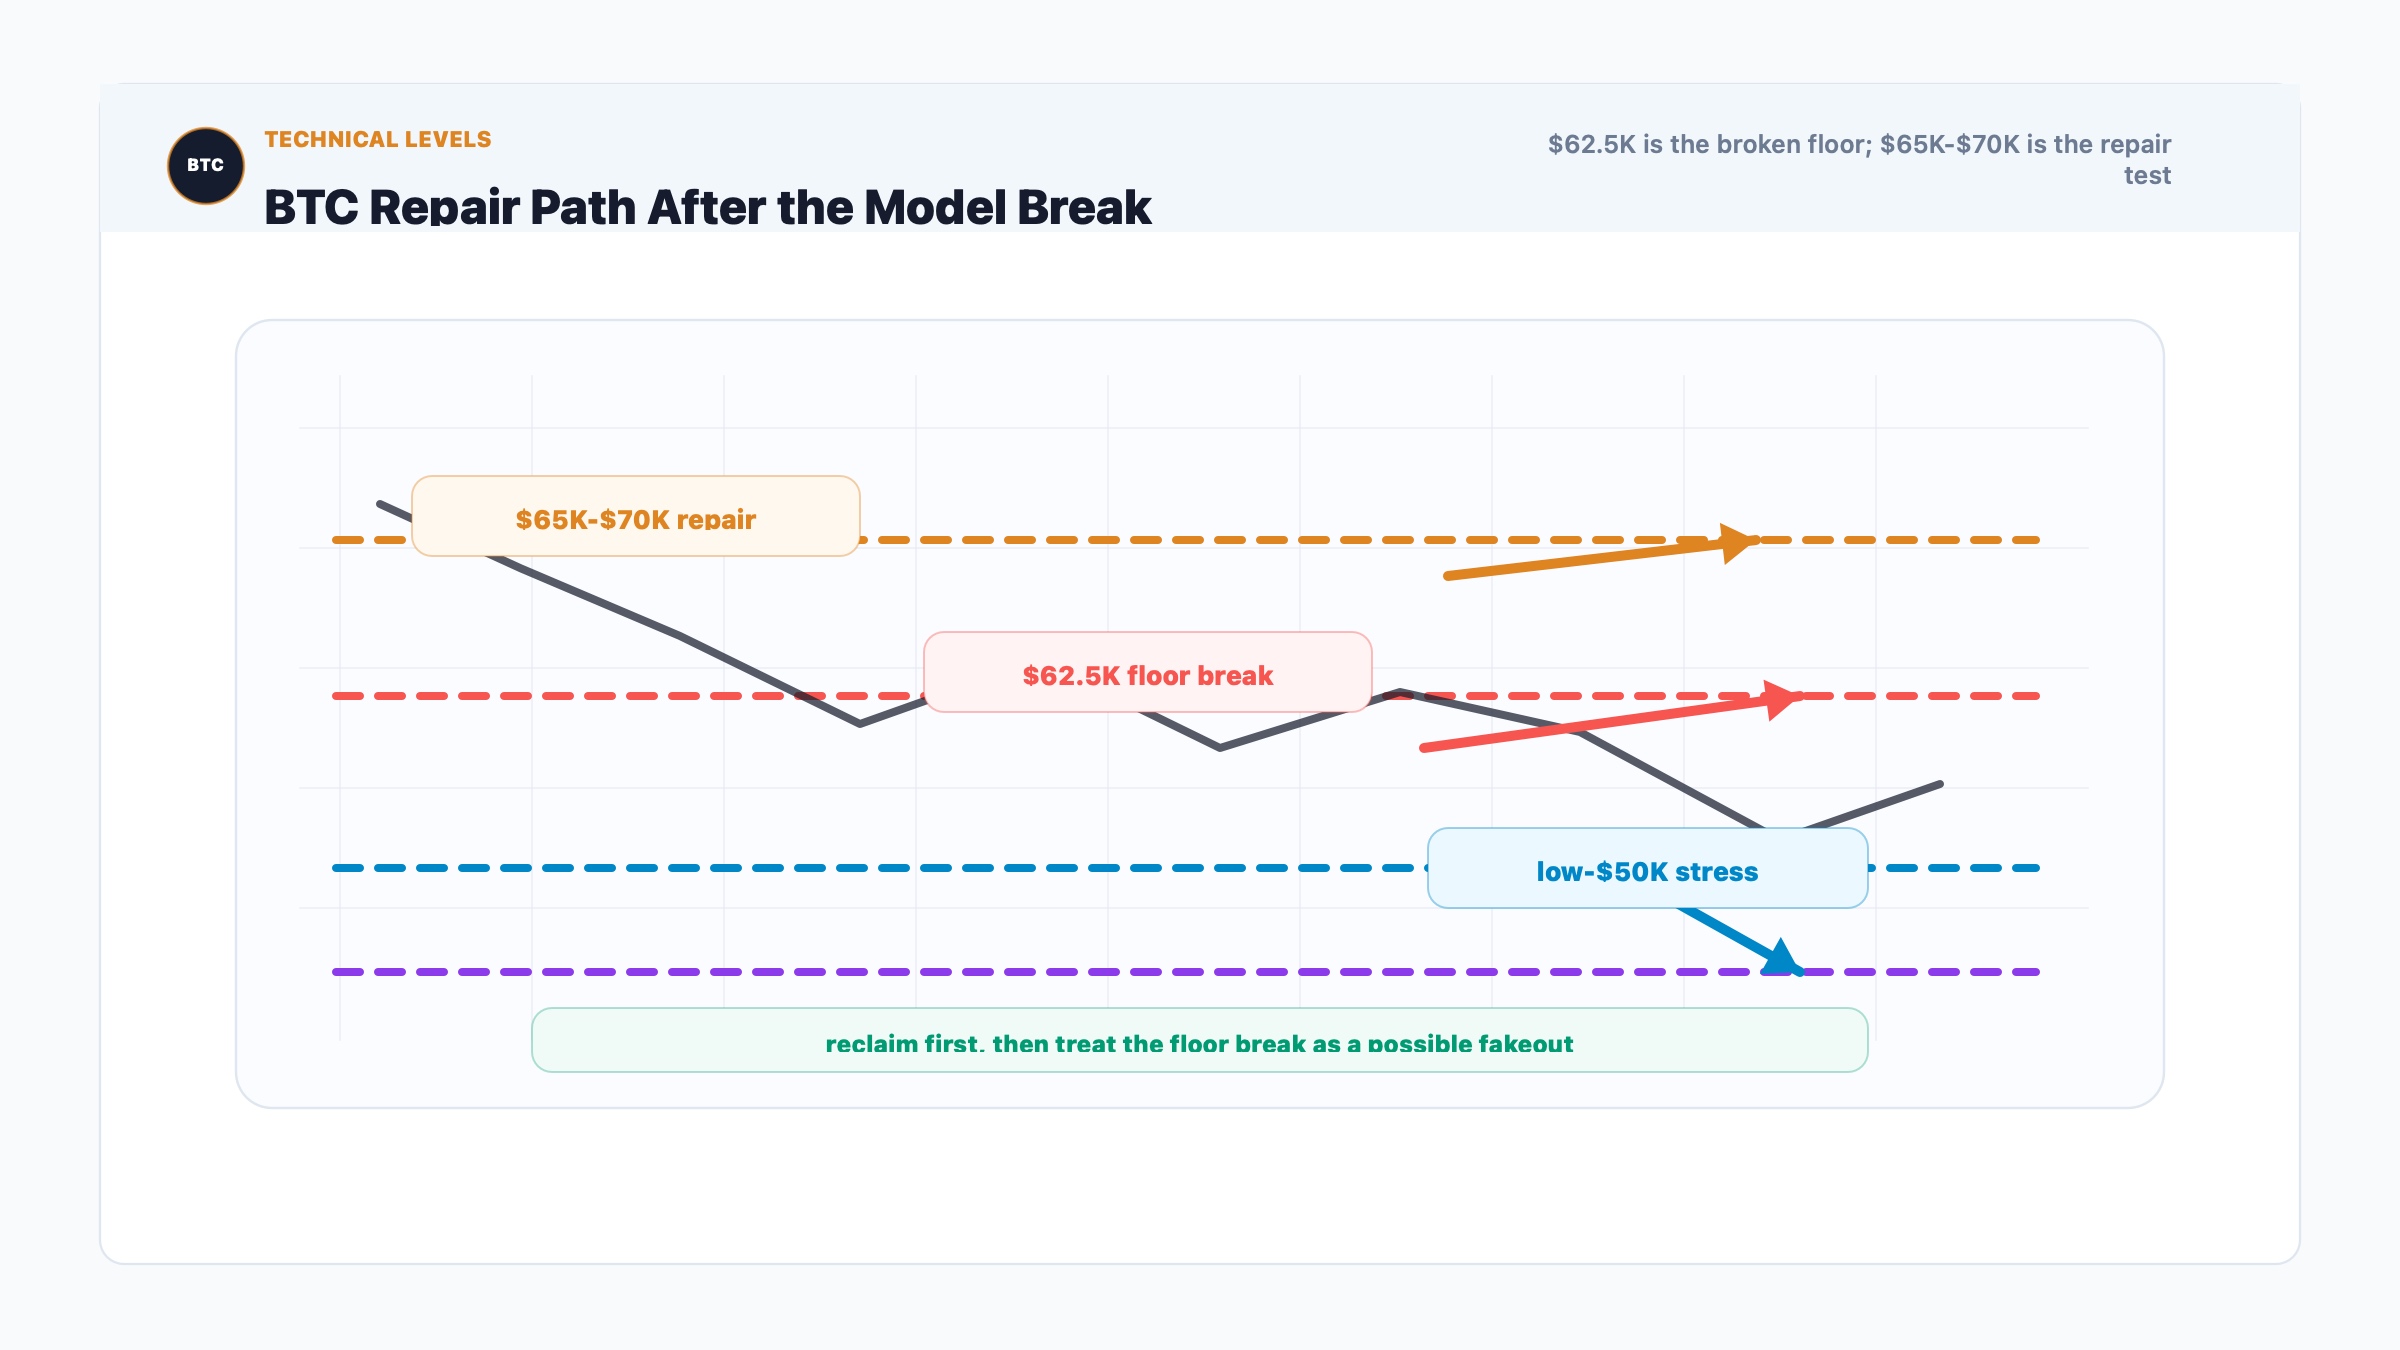
The most important line is the $62,500 area, because that is where the article places the Rainbow Chart floor break. Price is now trading around that zone rather than cleanly above it. That is the difference between a scary headline and an active technical problem.
The repair zone is $65,000-$70,000. If BTC can reclaim that band and hold it, the breakdown starts to look less like a new leg lower and more like a forced flush below a famous model level. If BTC cannot reclaim it, the market stays in "prove it" mode.
The lower risk zone is the low-$50,000s. That does not mean Bitcoin must go there. It means the market has created a vacuum below $60,000 if buyers fail again. In a model-break environment, old floors often become negotiation points, not guarantees.
Key Levels to Watch
$65,000-$70,000: This is the repair zone. A reclaim would tell us the Rainbow Chart break may have been a fear spike rather than a lasting regime break.
$62,500: This is the news level. It is where the Rainbow Chart floor break became the story, and it now works as the psychological pivot.
$60,000: This is the practical defense line. If BTC loses it cleanly, the market will likely start talking less about charts and more about forced selling.
Low-$50,000s: This is the stress zone. It becomes more relevant if BTC keeps rejecting the $65,000-$70,000 repair band.
Conditional Forecast
If Bitcoin reclaims $65,000-$70,000 with improving volume, the Rainbow Chart break probably becomes a sentiment event rather than a structural breakdown. In that case, the market can rebuild around the idea that BTC was oversold against an outdated model.
If BTC stays below $65,000 and keeps closing near or under $62,500, the pressure remains active. The market would be saying that the famous floor is no longer attracting enough spot demand.
If $60,000 breaks decisively, the low-$50,000s become the next reasonable downside discussion. That would not prove Bitcoin is dead. It would prove that the old Rainbow floor is not where this cycle's buyers were waiting.
Investment Takeaway
The useful takeaway is not "buy because the chart says dead." That is too cute, and cute usually gets expensive in markets.
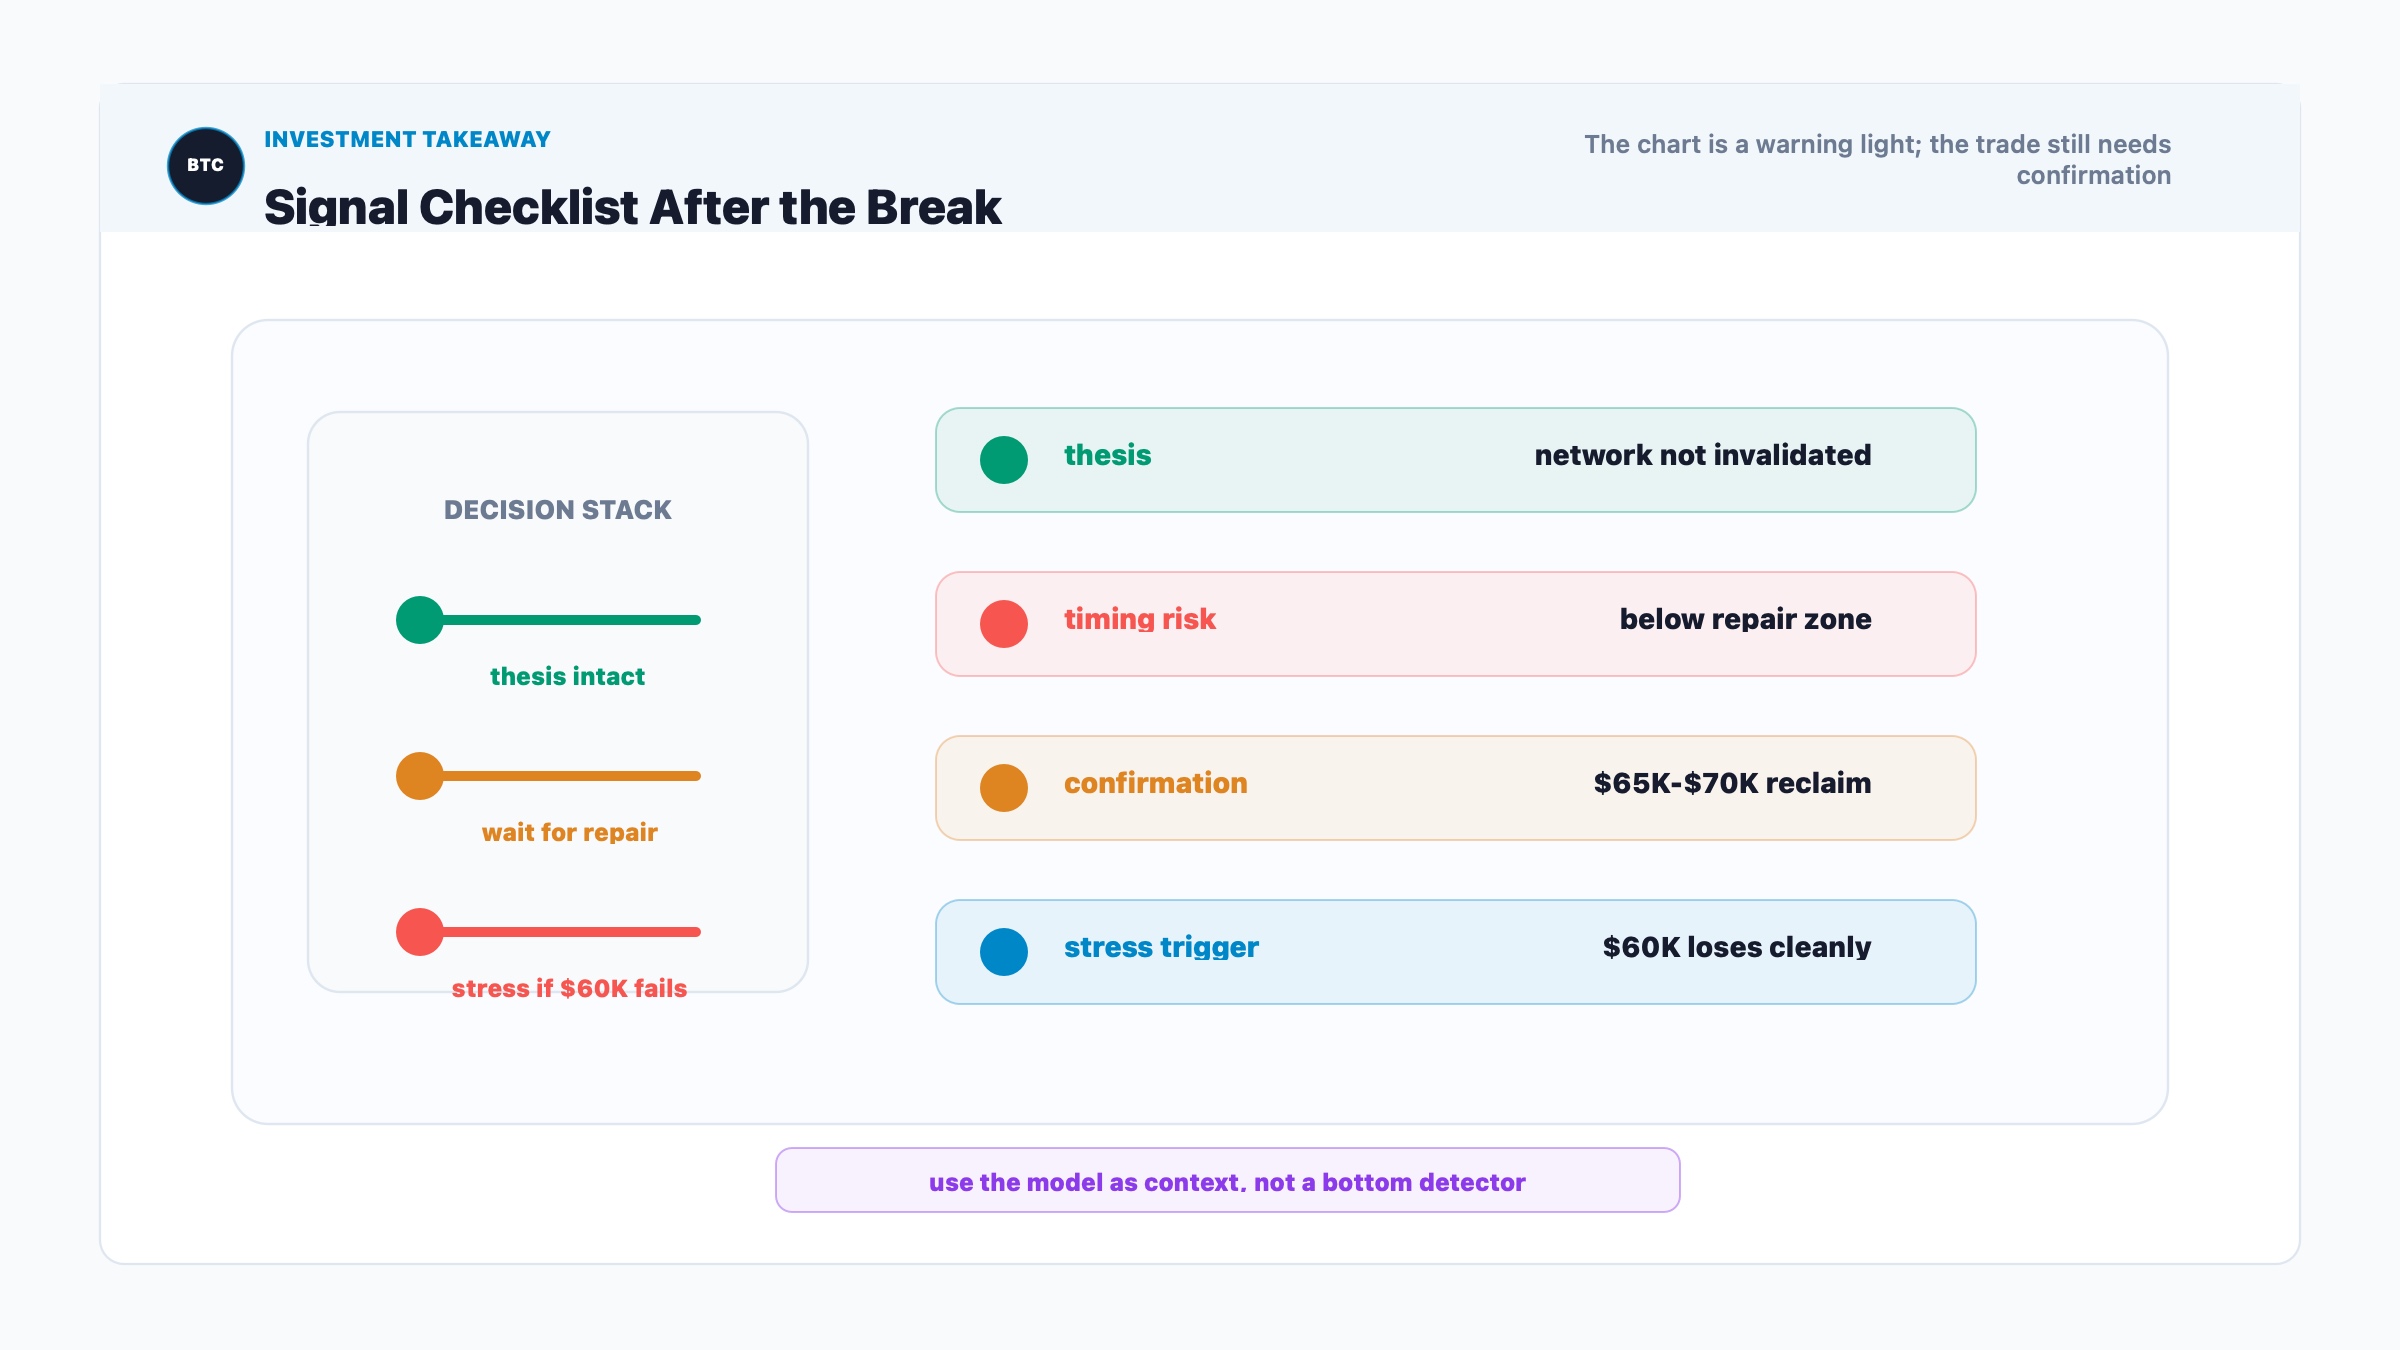
The better takeaway is that Bitcoin has entered a phase where old cycle tools need confirmation from live market structure. The Rainbow Chart may still be useful as a sentiment gauge, but it should not be used alone as a bottom detector.
For long-term investors, this is a moment to separate thesis from timing. The Bitcoin thesis is not invalidated by a chart band. But timing risk is real while BTC trades below the repair zone. For traders, the setup is cleaner: $65,000-$70,000 is the test. Below that, caution still earns its seat at the table.
Sources
- CoinDesk: Bitcoin just broke below the floor of its famous Rainbow Chart into the 'BTC is dead' zone (https://www.coindesk.com/markets/2026/06/24/bitcoin-just-broke-below-the-floor-of-its-famous-rainbow-chart-into-the-btc-is-dead-zone)
- BlockchainCenter: Bitcoin Rainbow Chart (https://www.blockchaincenter.net/bitcoin-rainbow-chart/)
- CoinGecko Learn: Bitcoin Rainbow Chart guide (https://www.coingecko.com/learn/bitcoin-rainbow-chart)
- CoinDesk: The epic collapse of Sam Bankman-Fried's FTX exchange (https://www.coindesk.com/markets/2022/11/12/the-epic-collapse-of-sam-bankman-frieds-ftx-exchange-a-crypto-markets-timeline)
- TradingView: BINANCE:BTCUSDT daily chart (https://www.tradingview.com/chart/?symbol=BINANCE%3ABTCUSDT&interval=D)
|
DISCLAIMER:
1. All content on this website (including but not limited to articles, data, charts, and analyses) is for general informational purposes only and does not constitute any form of investment advice, trading recommendation, or financial guidance. 2. Cryptocurrencies and digital assets are subject to extreme price volatility and high investment risk; you may lose part or all of your principal. Past performance does not predict future results. 3. The information on this website is based on sources we believe to be reliable, but we do not guarantee its accuracy, completeness, or timeliness. Any investment decisions made based on this website’s information are at your own risk. 4. We strongly recommend that you conduct your own thorough research and consult an independent, licensed financial advisor before making any investment decisions. |
Recommended reading
Latest News