Key Takeaways
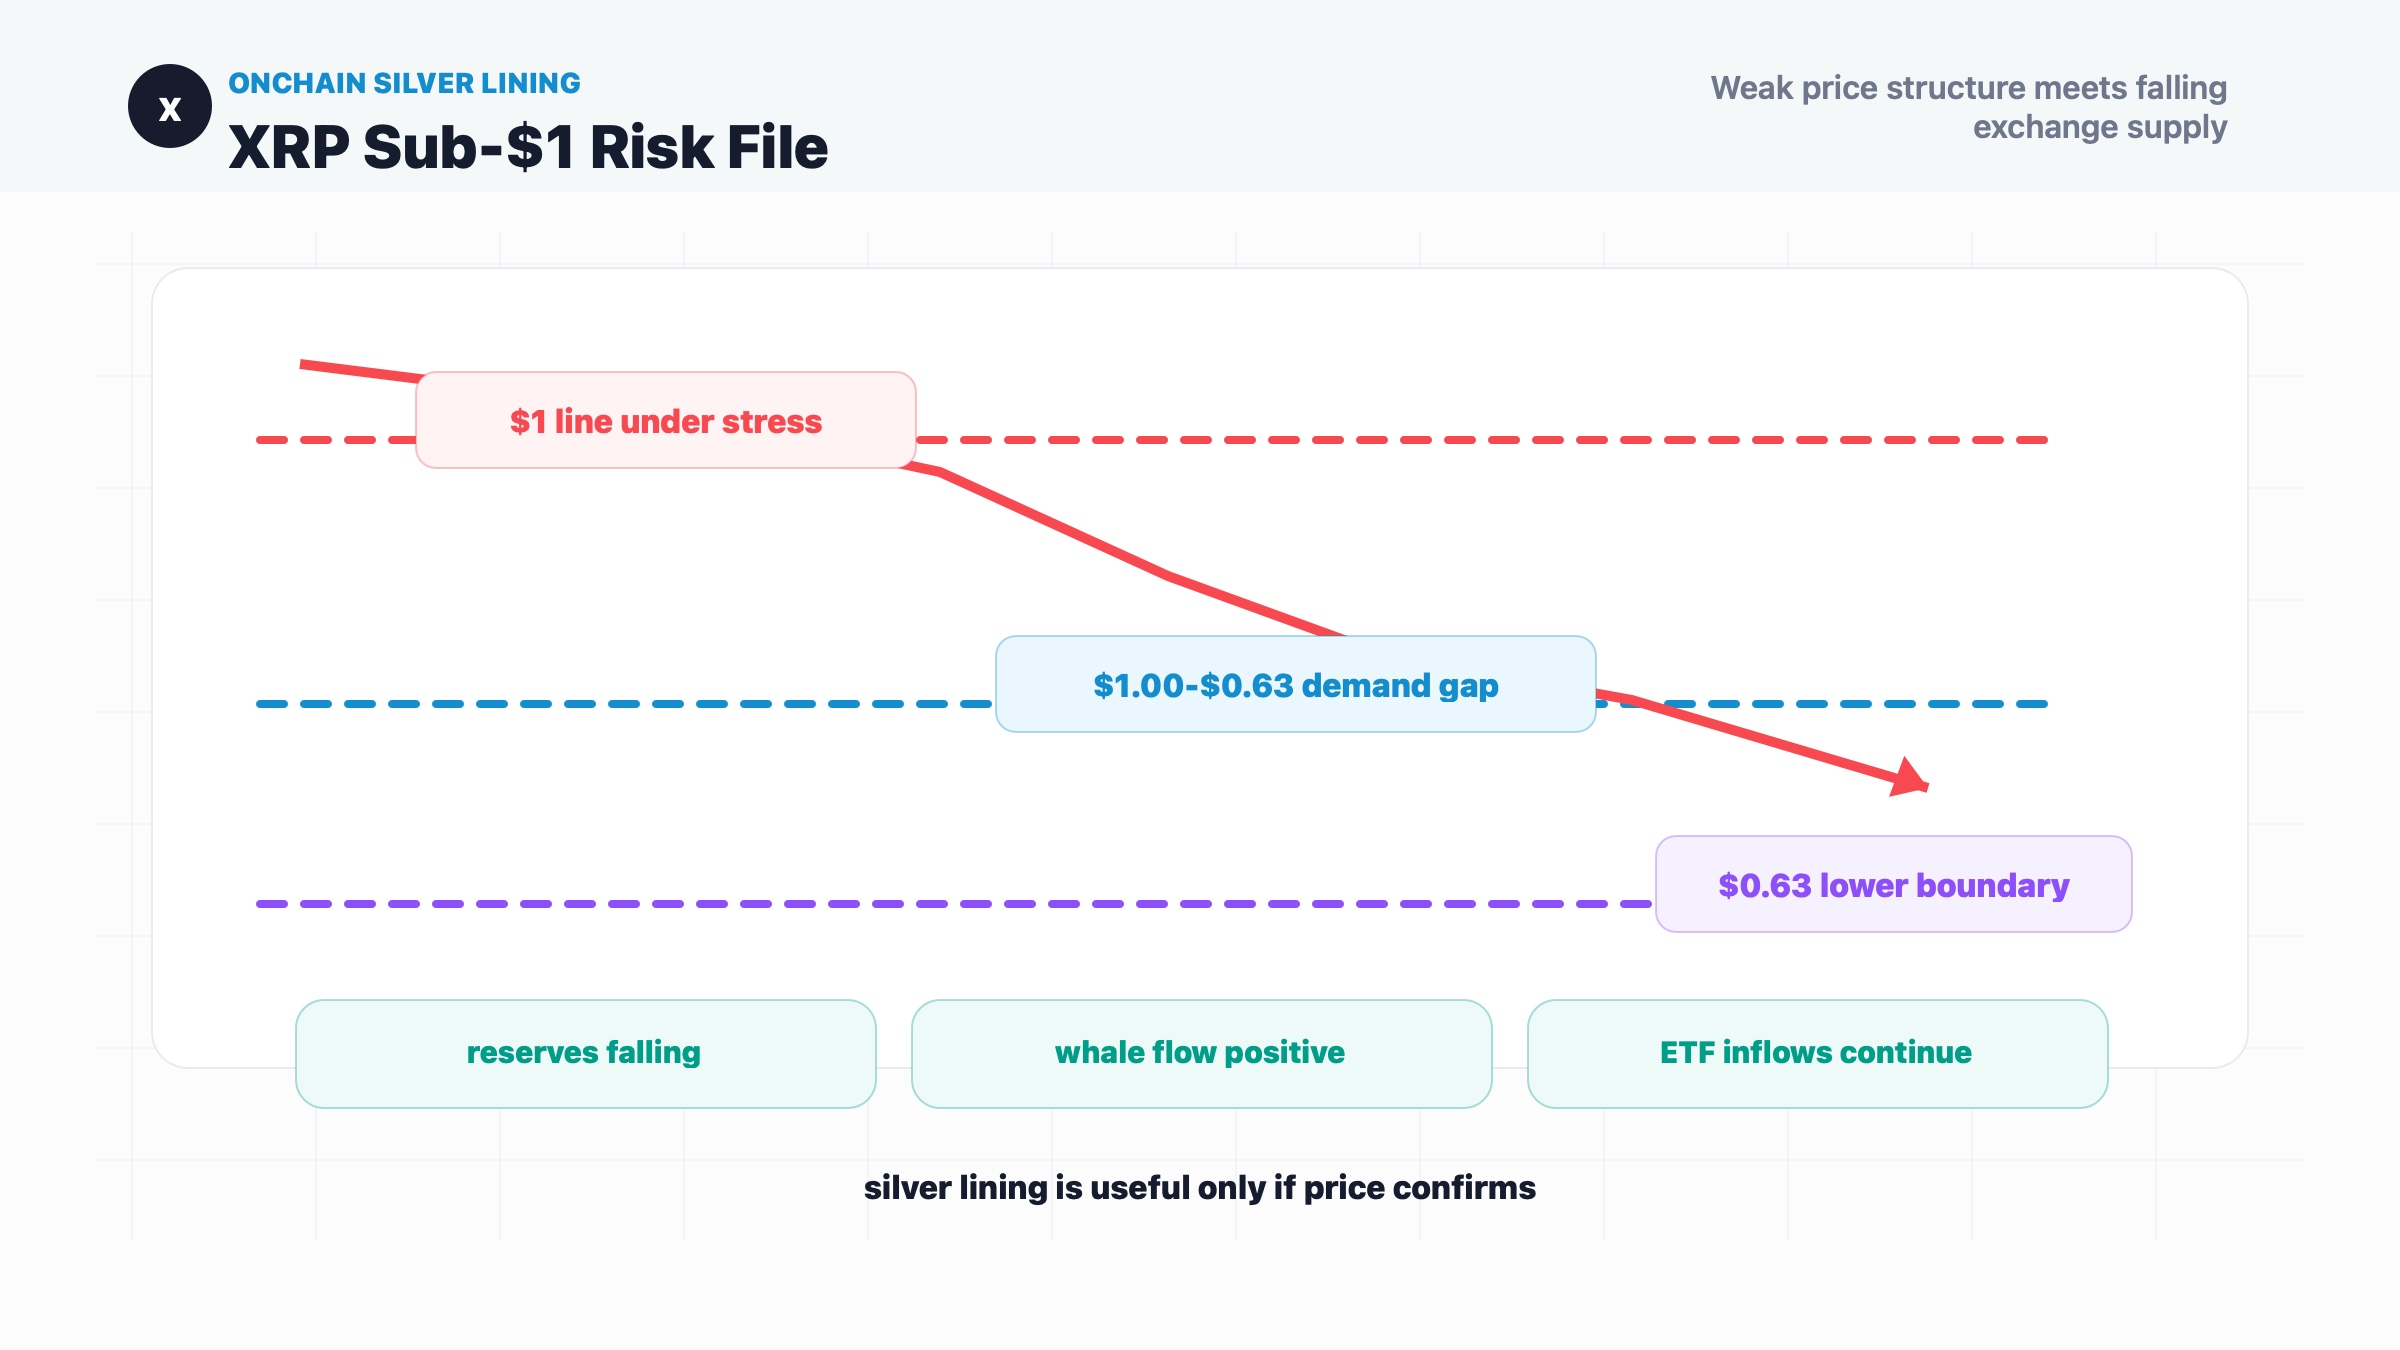
- XRP is trading near its weakest level of 2026, with a break below $1 now close enough to matter on the weekly chart.
- Exchange-held XRP supply is falling, Binance withdrawals have led deposits for seven straight days, and whale flows remain positive.
- The onchain picture is constructive, but price structure is still bearish until XRP reclaims the $1.20-$1.30 area.
- If XRP loses $1 cleanly, the next major demand area sits inside the $1.00-$0.63 fair-value gap from the late-2024 rally.
What Happened
XRP has reached the market's least comfortable kind of setup: the chart looks weak, while the onchain data refuses to be neatly bearish.
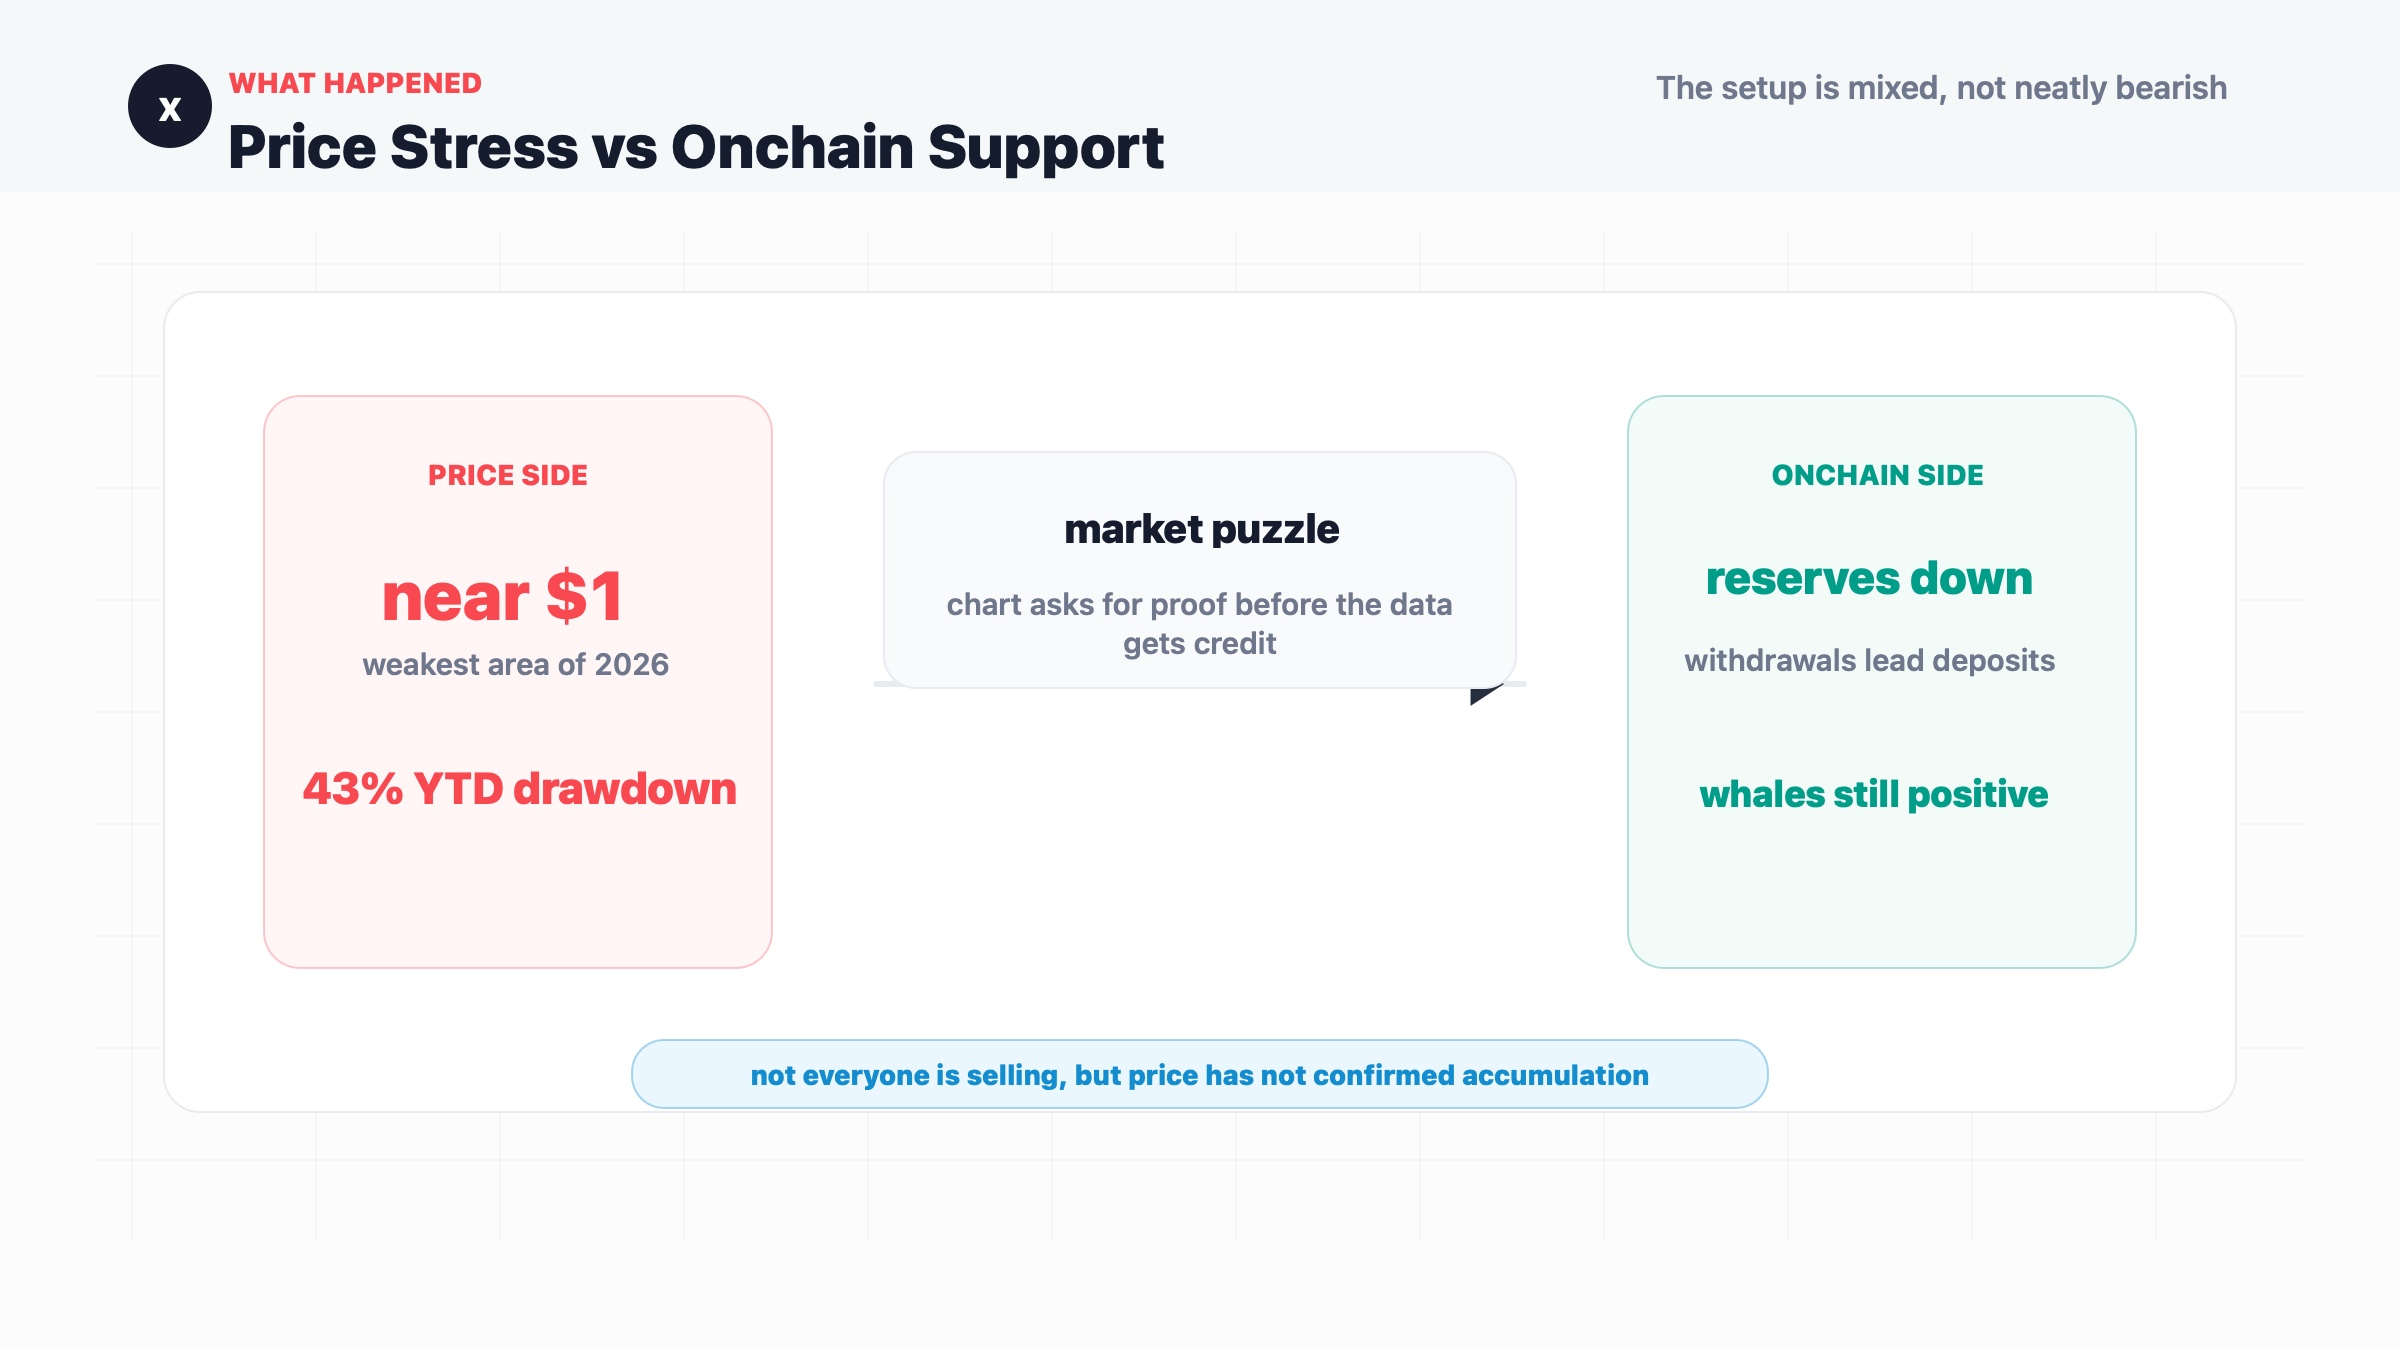
According to Cointelegraph, XRP is trading just above $1, near its weakest price level of 2026. The token touched about $1.01, leaving it close to its first move below $1 since November 2024. The decline has also pushed XRP down roughly 43% year-to-date.
That is the unpleasant part.
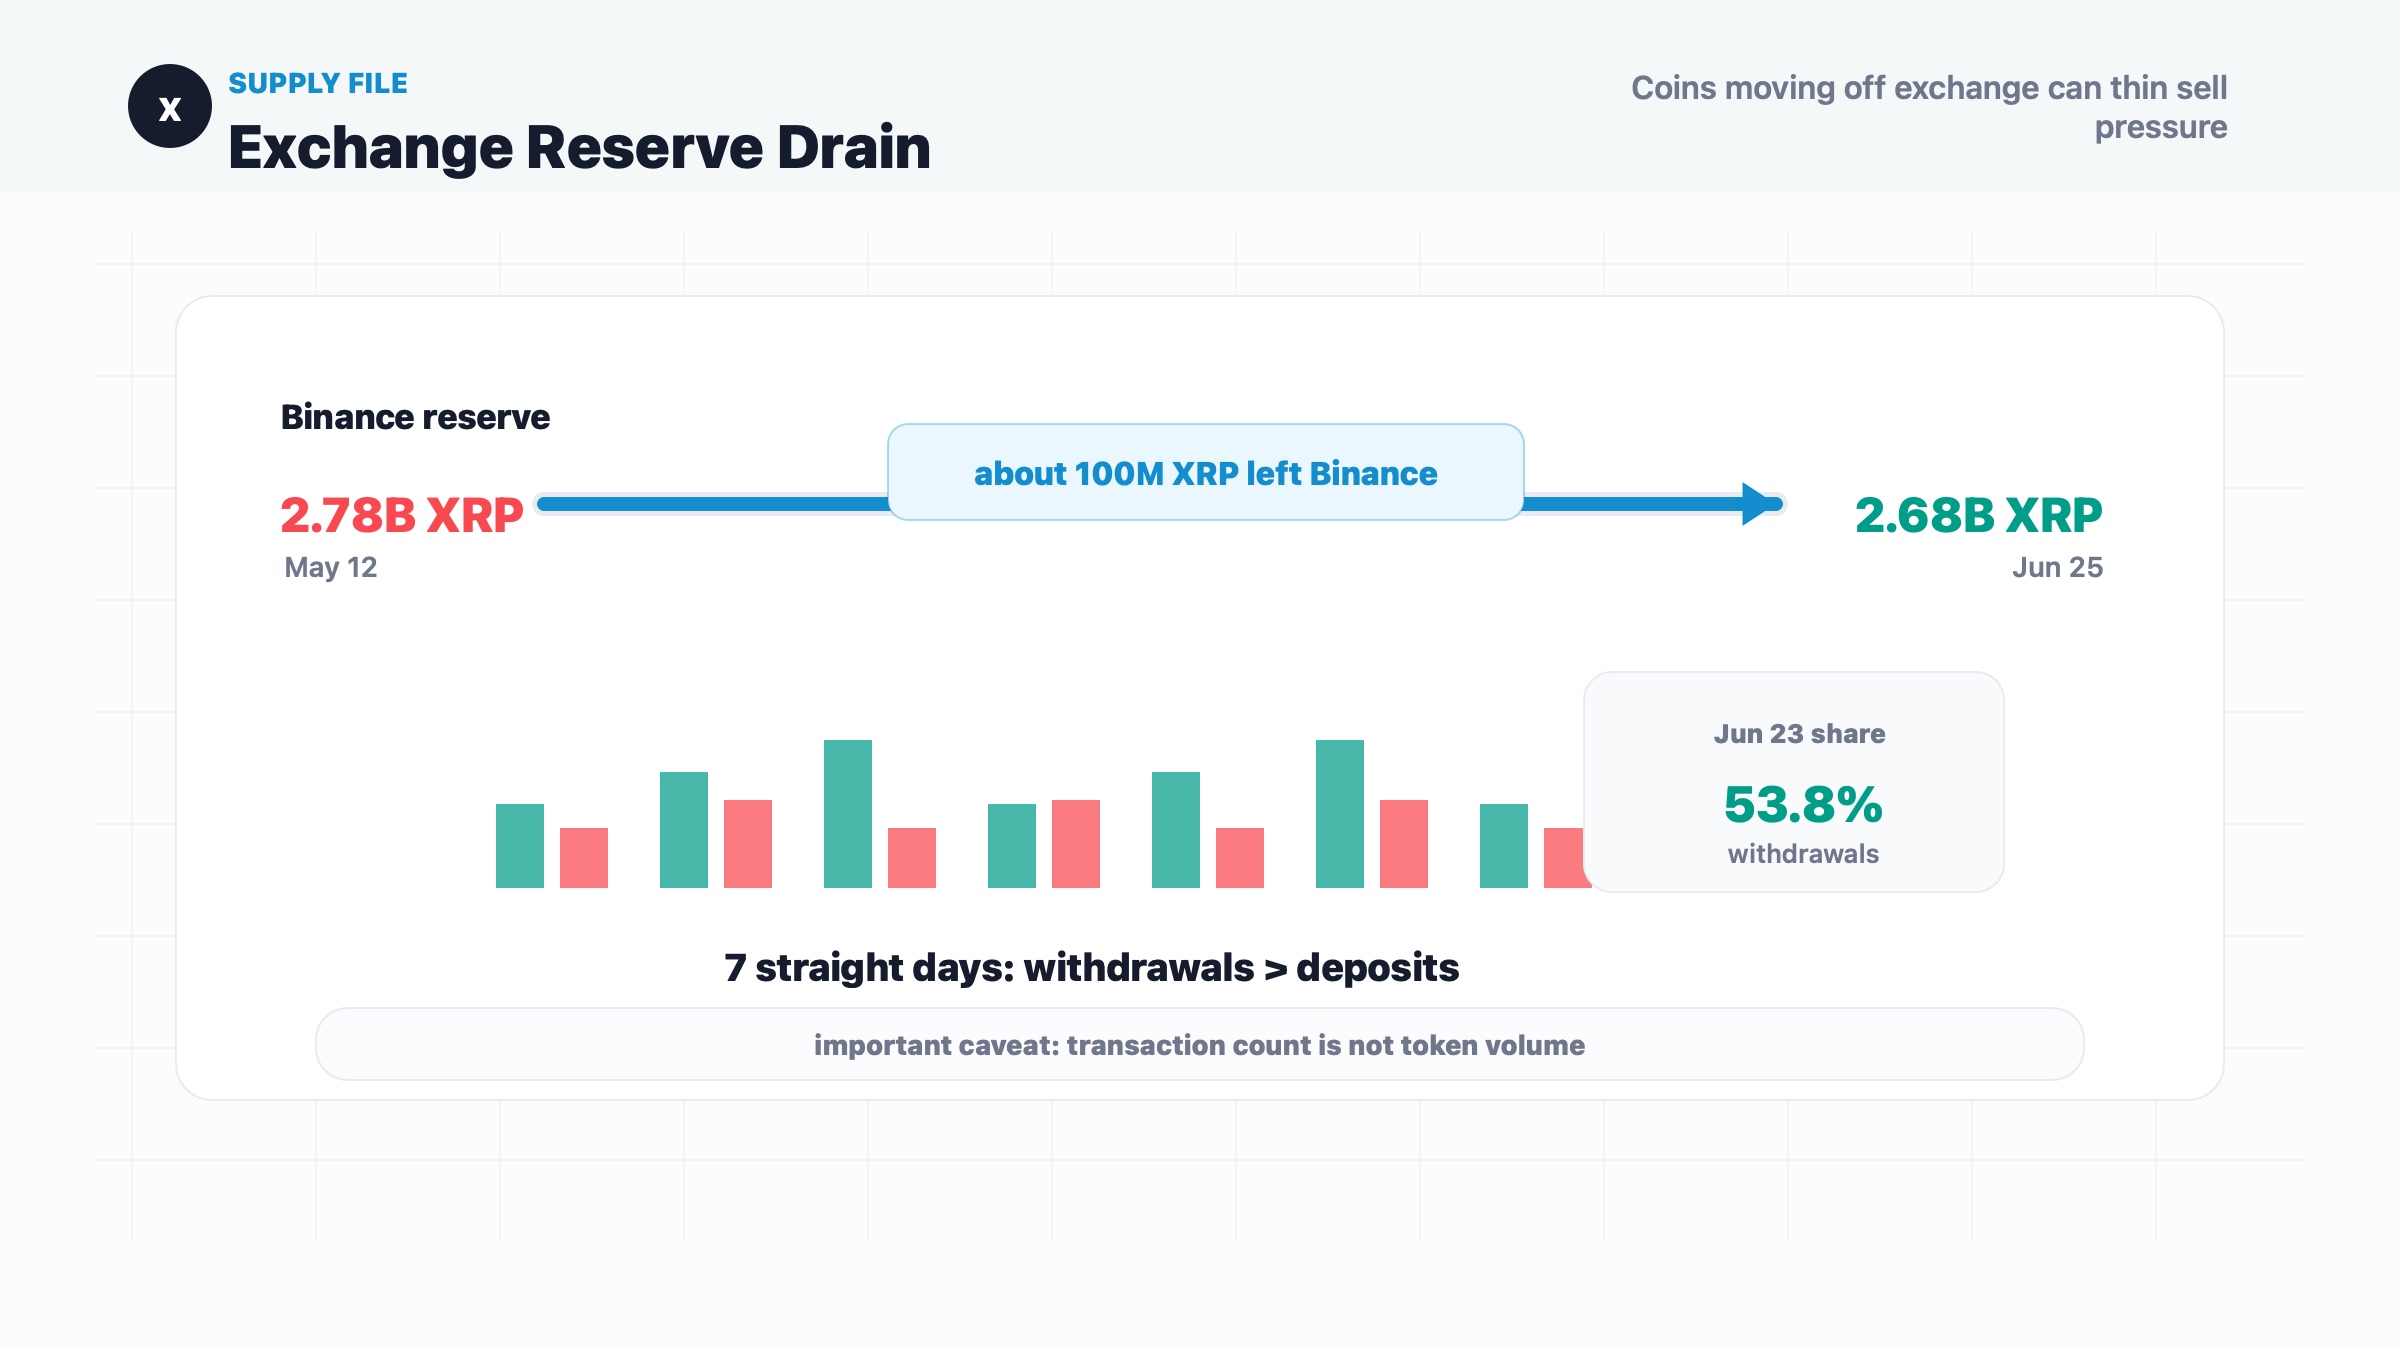
The more interesting part is that exchange and holder data are telling a slightly different story. Binance's XRP reserve reportedly fell from about 2.78 billion XRP on May 12 to about 2.68 billion XRP on June 25, meaning roughly 100 million XRP left the exchange over that period. Upbit and Bybit reserves also fell, with Bybit seeing the steepest percentage decline among the exchanges mentioned.
There is a second detail: XRP withdrawal transactions on Binance have exceeded deposits for seven consecutive days since June 17. On June 23, withdrawals made up 53.8% of the seven-day transaction share, while deposits fell to 46.1%. This is transaction count, not token volume, so we should not overstate it. But it still points in a useful direction: users are moving XRP off exchange more often than they are sending it in.
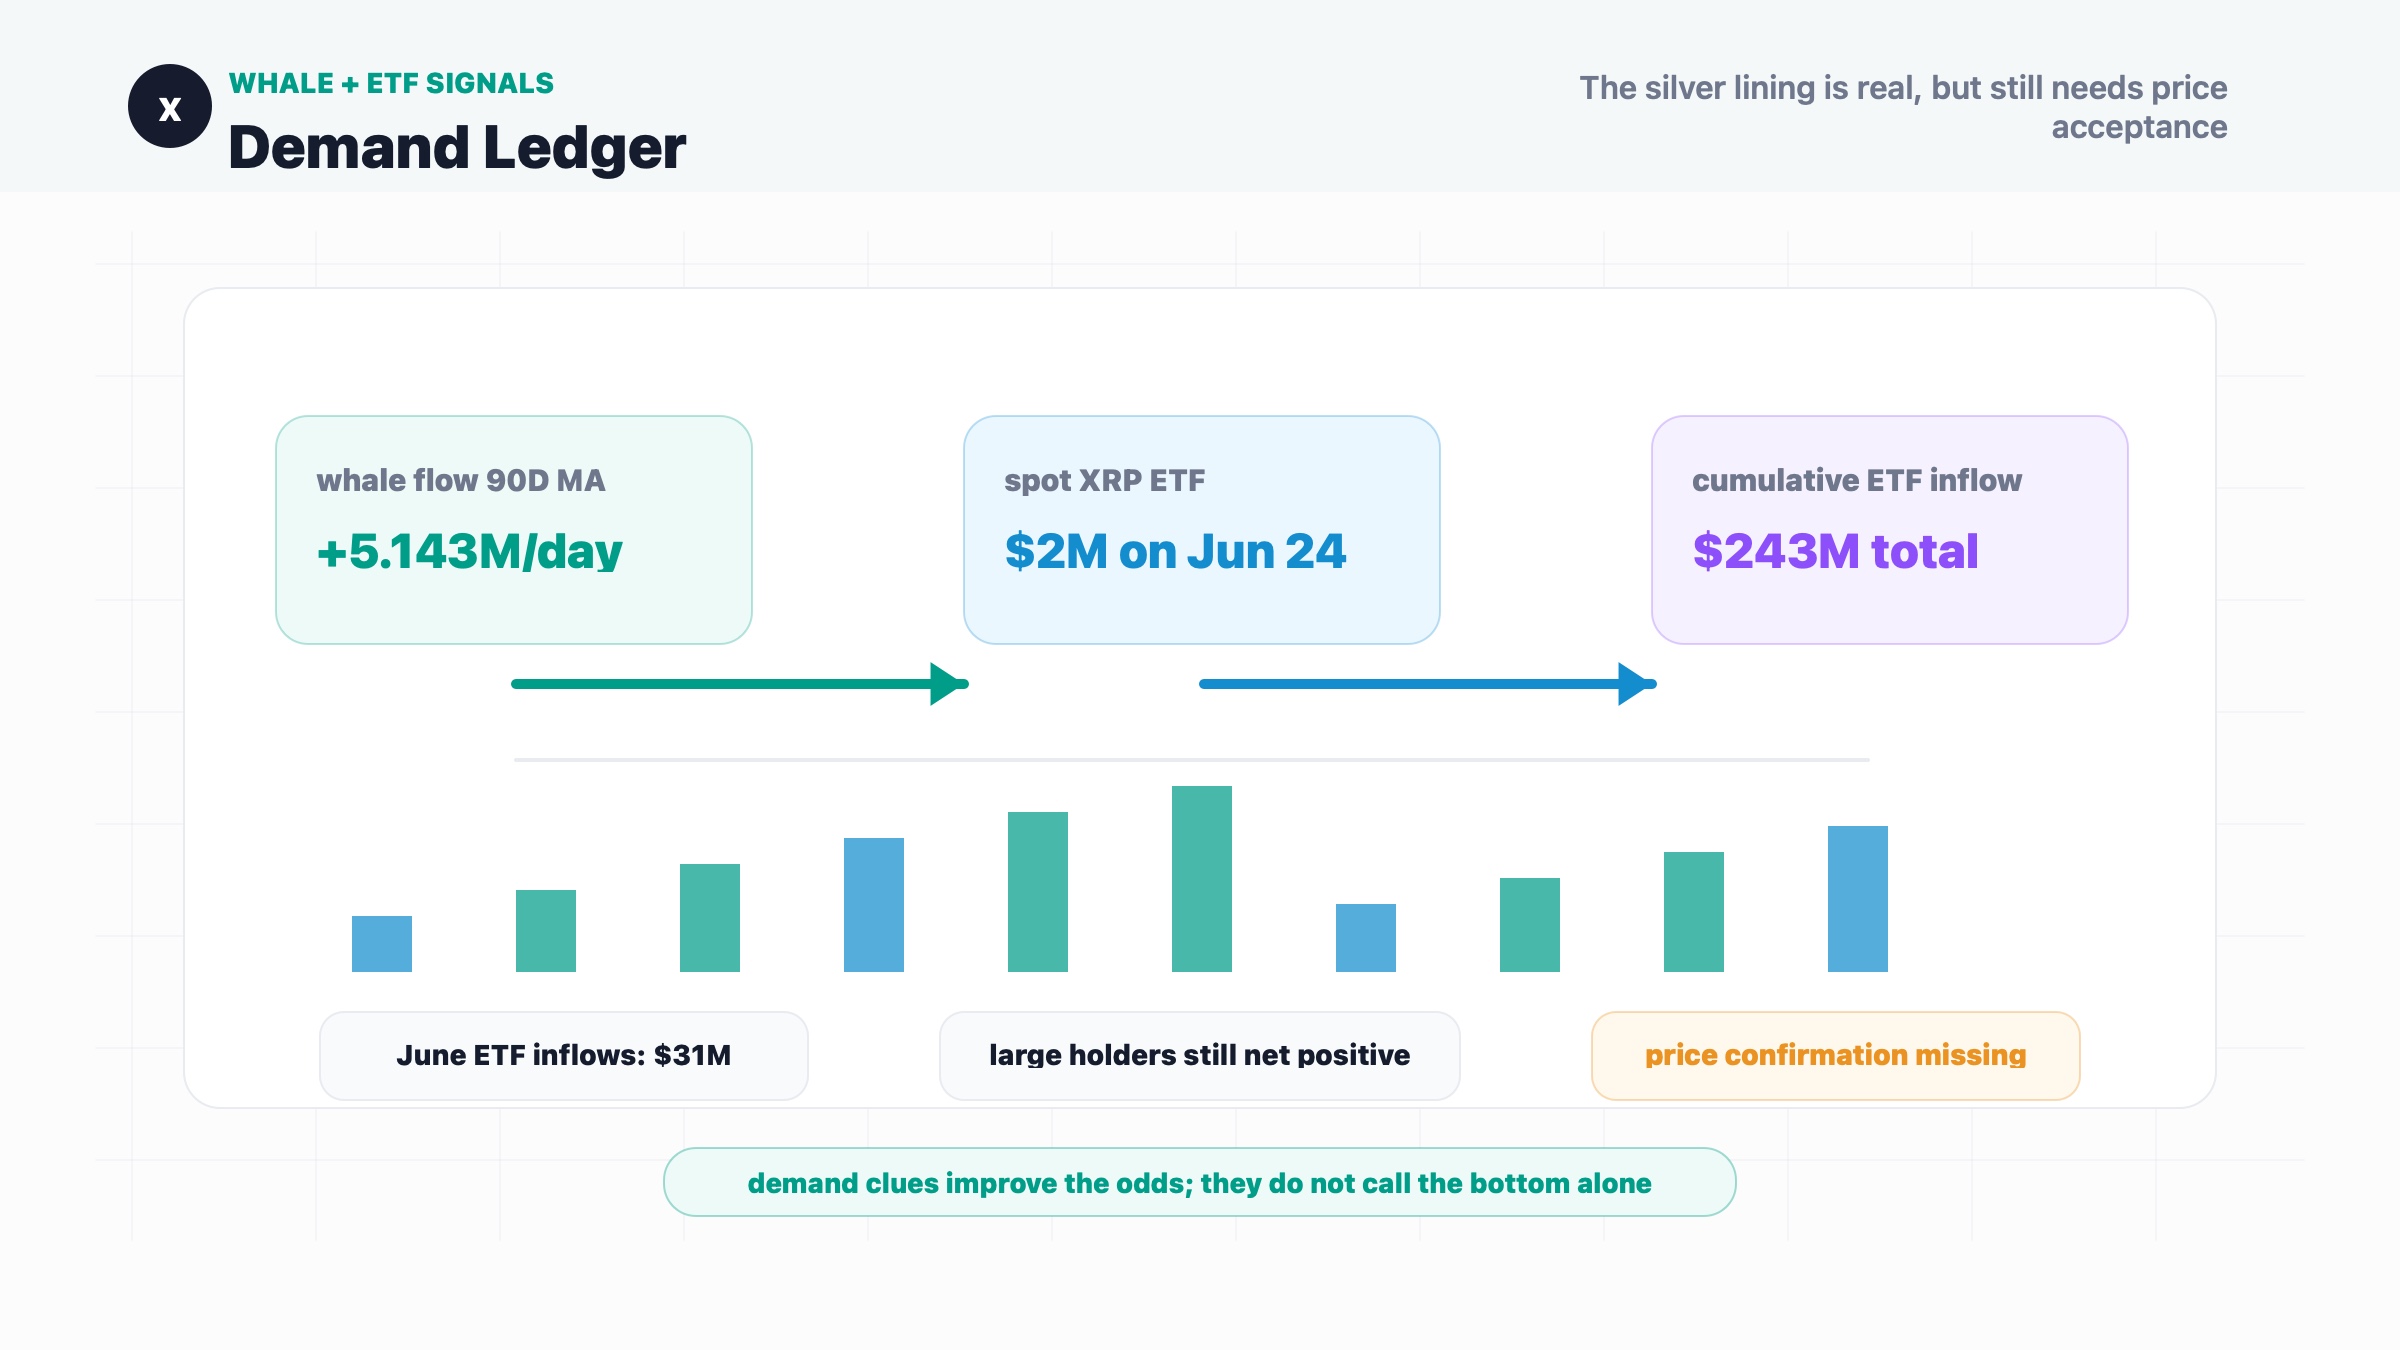
Large-holder data adds another piece. Cointelegraph cited CryptoQuant data showing XRP whale flow on a 90-day moving average staying positive throughout the quarter at 5.143 million XRP per day. Spot XRP ETFs also recorded $2 million in net inflows on June 24, bringing June inflows to $31 million and cumulative inflows since April to $243 million.
So the story is not "everyone is selling XRP." The story is stranger: price is threatening a breakdown while some of the supply data looks like accumulation.
Markets love giving people this kind of puzzle. It is how they make confident narratives pay rent.
Why This Matters for XRP and Crypto Markets
The important distinction is simple: supply moving off exchanges can reduce selling pressure, but it does not automatically create a trend reversal.
If you are bullish on XRP, the onchain data gives you something real to work with. Falling exchange reserves can mean fewer coins are immediately available to sell. Positive whale flows suggest large wallets are still accumulating rather than distributing. ETF inflows show that some institutional-facing demand channel is still open.
But if you are looking at the chart, XRP has not earned the benefit of the doubt yet.
The weekly structure remains under pressure. XRP has been making lower highs since the 2025 peak, and the move toward $1 is not just a random intraday wobble. It is a test of a level that now carries both psychological and structural weight. If $1 fails, traders will stop debating whether exchange reserves are falling and start asking how deep the fair-value gap can pull price.
This is the main lesson: onchain data can tell you that selling pressure may be thinning, but price action tells you whether buyers are strong enough to matter.
For the broader altcoin market, XRP is a useful stress test. It has a large holder base, a clear regulatory history, ETF-related demand, and enough liquidity to matter. If even XRP needs to retest a deep demand zone while onchain metrics improve, then the message to altcoin traders is not subtle. Good narratives help. They do not repeal gravity.
Historical Parallel
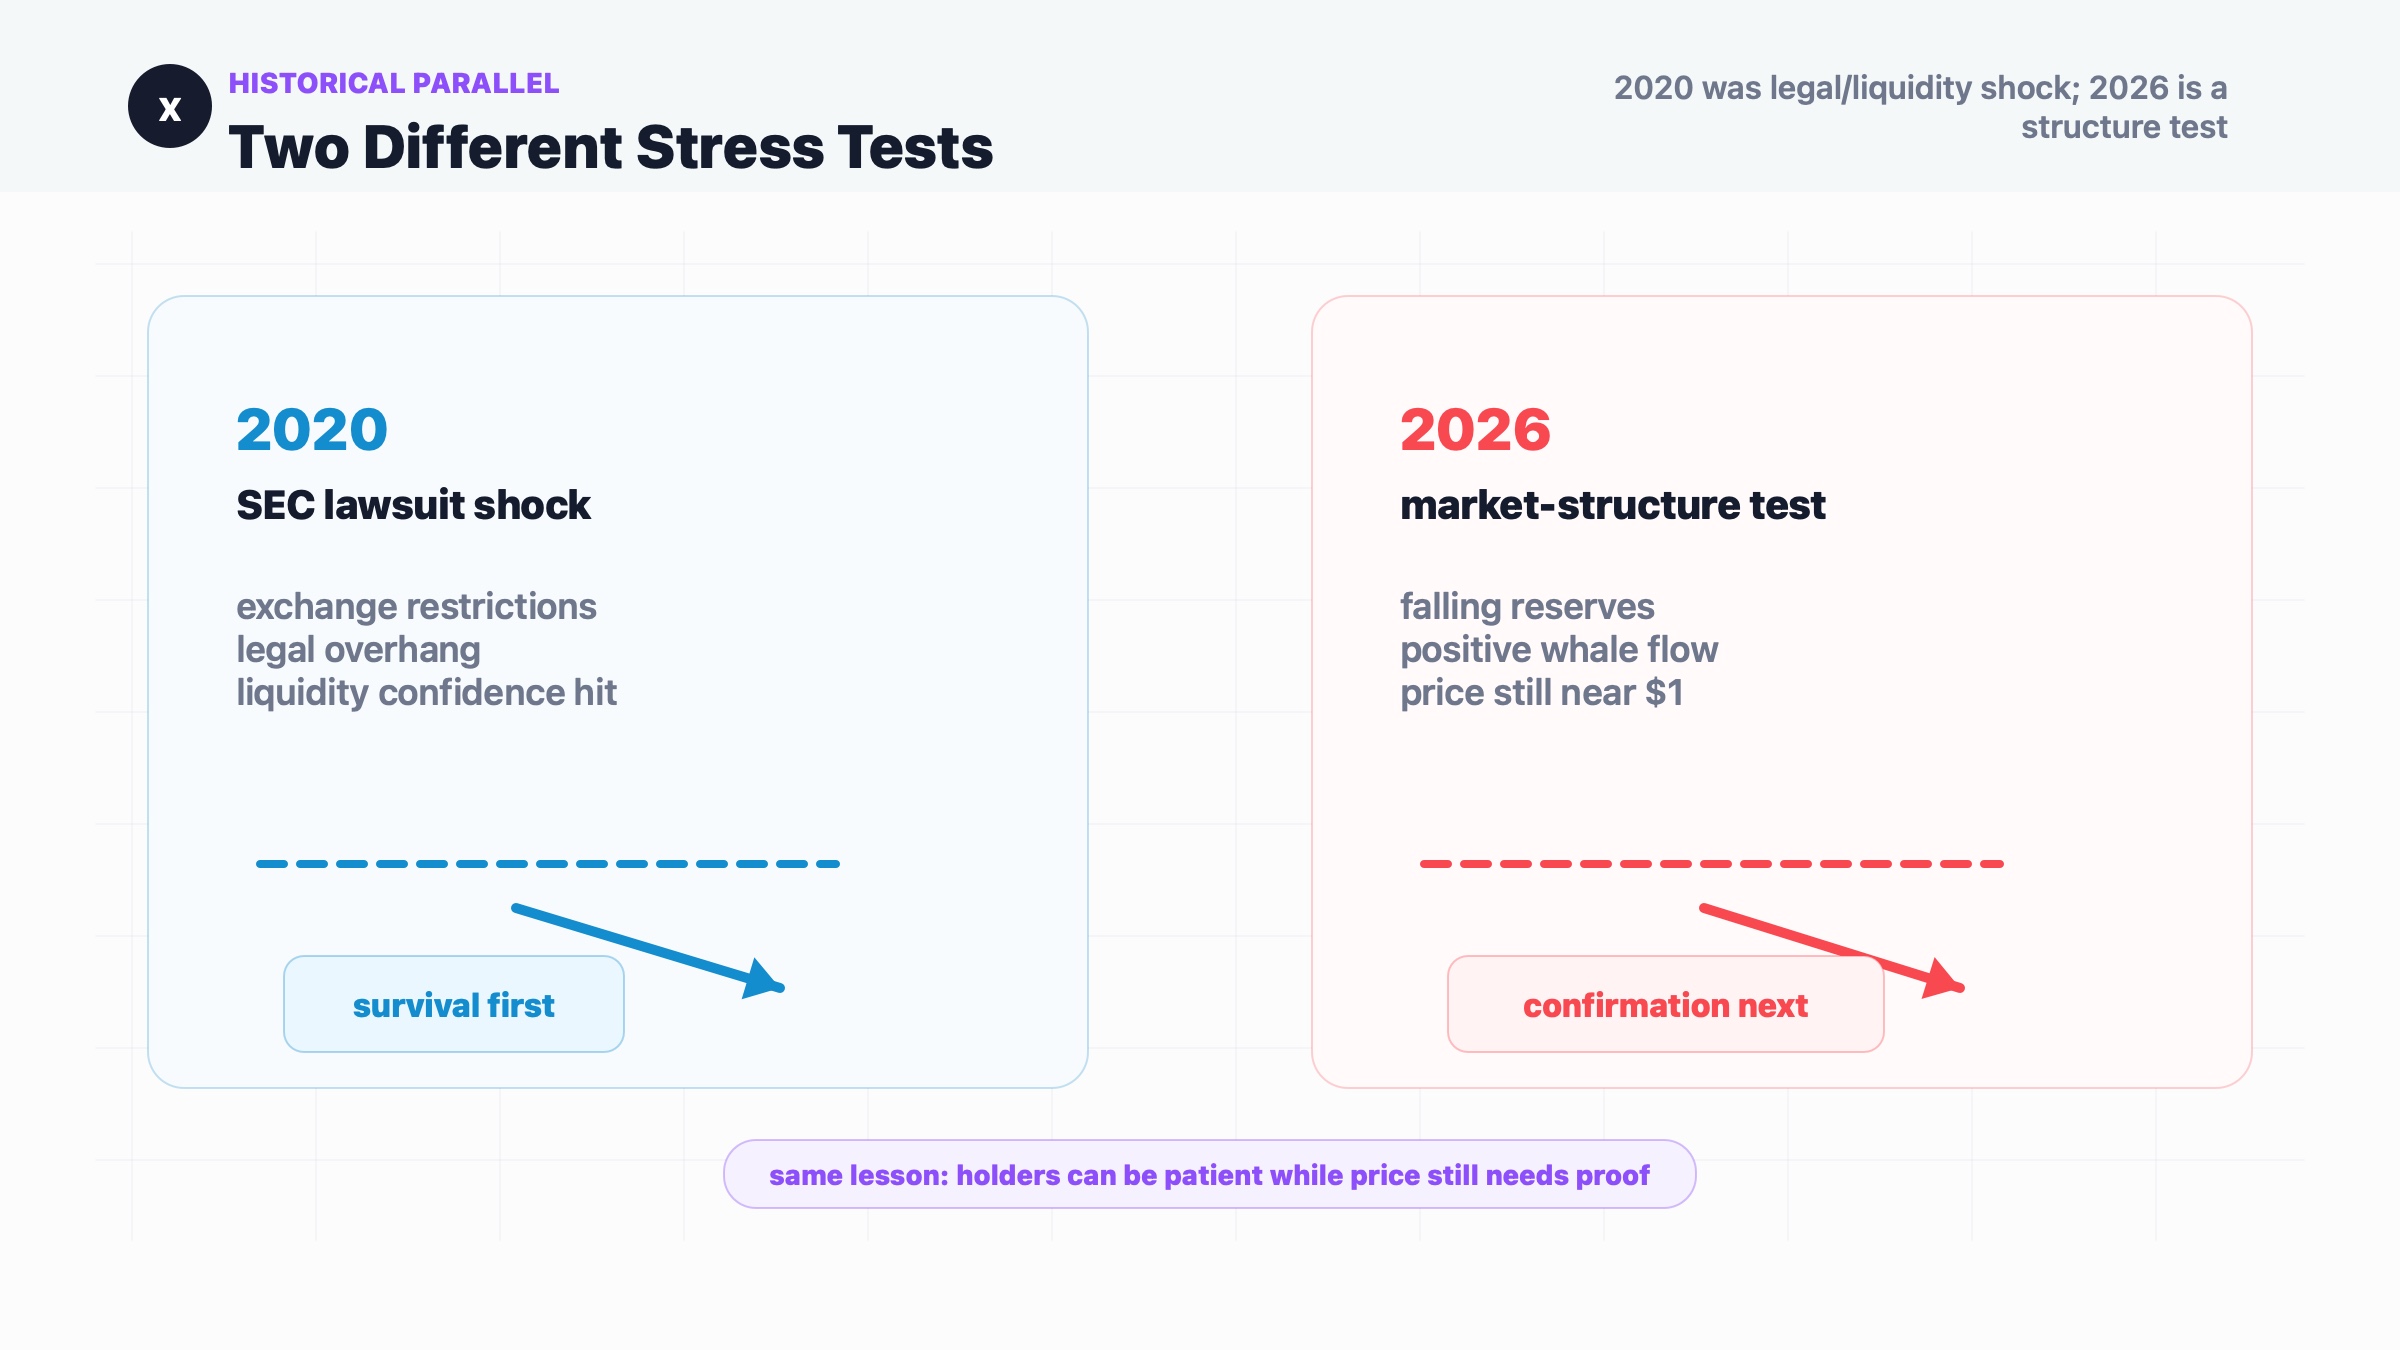
The closest historical parallel is XRP's December 2020 SEC lawsuit shock and the long recovery that followed.
In December 2020, the U.S. Securities and Exchange Commission sued Ripple Labs, alleging that sales of XRP involved unregistered securities offerings. The market reaction was brutal. XRP fell sharply, several exchanges restricted or suspended XRP trading, and the token's price became less about ordinary chart structure and more about legal risk, liquidity access and whether holders believed the asset would survive the institutional pressure.
The similarity is not that today's setup is another lawsuit shock. It is not. The similarity is the split between price stress and holder behavior. In 2020, XRP price action looked ugly because liquidity and confidence were hit at the same time. But the asset did not disappear. A long period of accumulation, legal uncertainty and reduced market enthusiasm eventually gave way to recovery attempts, especially after later court developments improved the regulatory narrative.
The difference is the source of pressure. The 2020 event was an external legal shock. Today's setup is a market-structure test. XRP is not falling because exchanges are delisting it or because a new enforcement action has frozen liquidity. It is falling while exchange reserves decline, whale flows remain positive and ETF inflows continue. That makes the current weakness more technical and positioning-driven than existential.
The lesson for current XRP judgment is that "holders are accumulating" is not the same as "price has bottomed." In 2020, survival and recovery required time, legal clarity and renewed liquidity. In 2026, XRP needs something simpler but still non-negotiable: it needs to defend $1 or quickly reclaim it if lost, then recover $1.20-$1.30 to show buyers are back in control. Until that happens, the onchain data is a silver lining, not a reversal.
XRP Price Reaction and K-Line Analysis
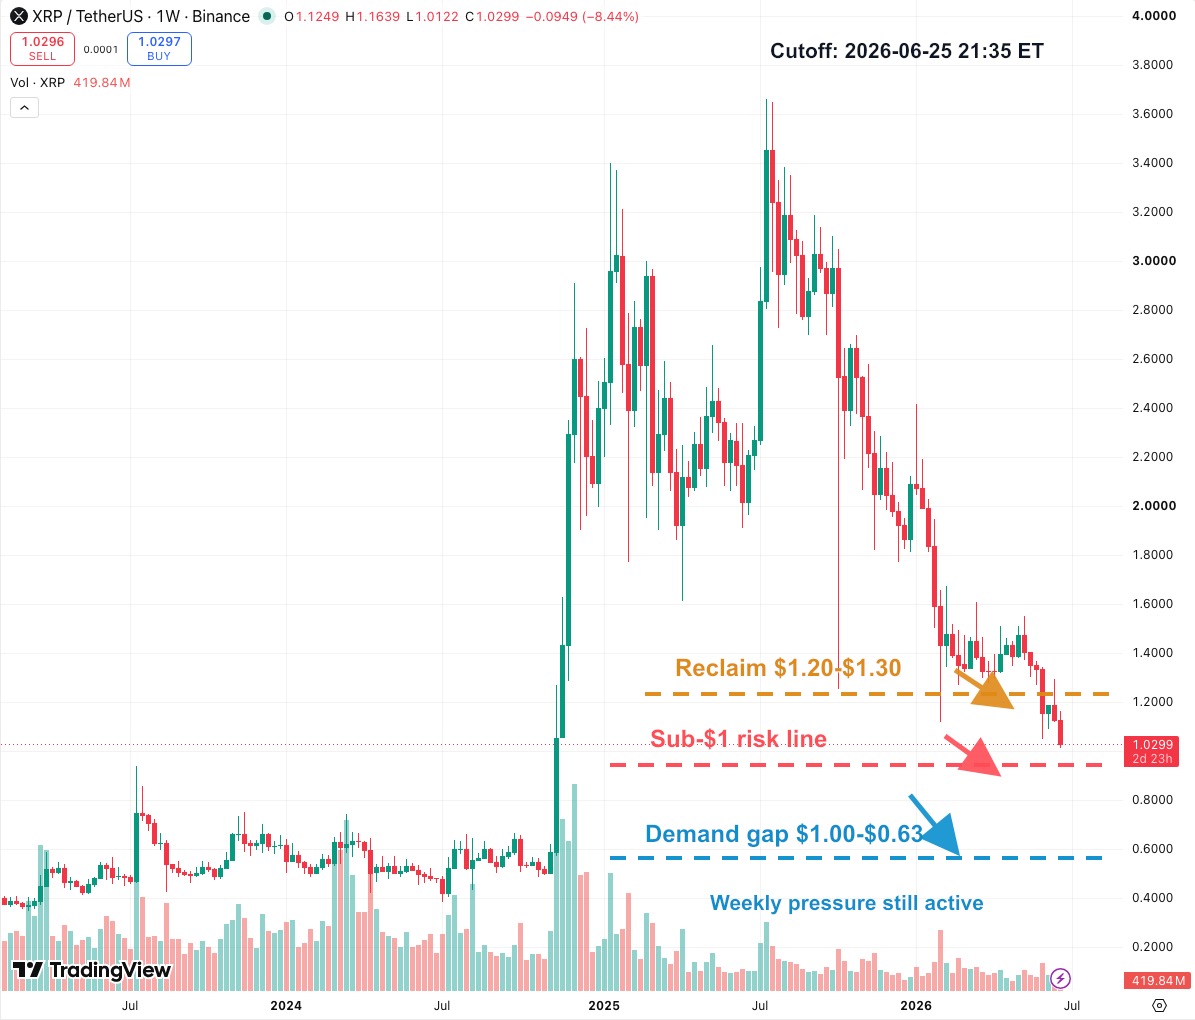
The weekly XRPUSDT chart is not subtle.
XRP exploded higher in late 2024, built a wide high-volatility range in 2025, then spent 2026 bleeding lower into the $1 area. That matters because the current move is not a small correction inside a clean uptrend. It is a high-time-frame retest of the zone that launched the previous major advance.
The first level is $1. This is the psychological line and the top of the fair-value-gap discussion in the original article. A weekly loss of $1 would likely change the market conversation from "can XRP bounce?" to "how much of the 2024 impulse needs to be retraced?"
The second level is the $1.00-$0.63 demand gap. That zone exists because XRP moved so quickly during the late-2024 rally that the chart left behind a large area with limited prior trading. In technical terms, that can become a magnet when price revisits it. In plain English, the market may want to find out where buyers actually live.
The third level is $1.20-$1.30. This is the near-term reclaim zone. XRP does not need to go to $10 to prove strength. It first needs to stop behaving like every bounce is just a better selling opportunity.
Until XRP reclaims that zone, the weekly chart remains under pressure even if the onchain data looks better underneath the surface.
Key Levels to Watch
$1.20-$1.30: Reclaim zone. A move back above this area would make the sub-$1 breakdown risk look less immediate.
$1.00: Psychological and structural line. A clean break below it would likely pull attention toward the lower demand gap.
$0.63-$1.00: Major demand gap from the late-2024 rally. This is where buyers may step in if XRP breaks below $1.
$0.80-$0.85: Mid-gap reaction area. If XRP enters the gap, this could become the first place where traders look for stabilization.
$0.63: Lower boundary of the gap. Losing this area would turn the chart from a deep retest into a much larger trend failure.
Conditional Forecast
If XRP holds $1 and starts reclaiming $1.20-$1.30, the market can treat the recent weakness as a high-time-frame support test. In that scenario, falling exchange reserves and positive whale flows would become more persuasive because price would finally be confirming the accumulation story.
If XRP loses $1 but stabilizes inside the $1.00-$0.63 demand gap, the setup becomes messier but not broken beyond repair. It would suggest that the late-2024 impulse is being retested, not fully erased.
If XRP closes below $0.63 on the weekly chart, the bullish onchain interpretation weakens sharply. At that point, the market would be saying that supply absorption was not enough to offset the broader downtrend.
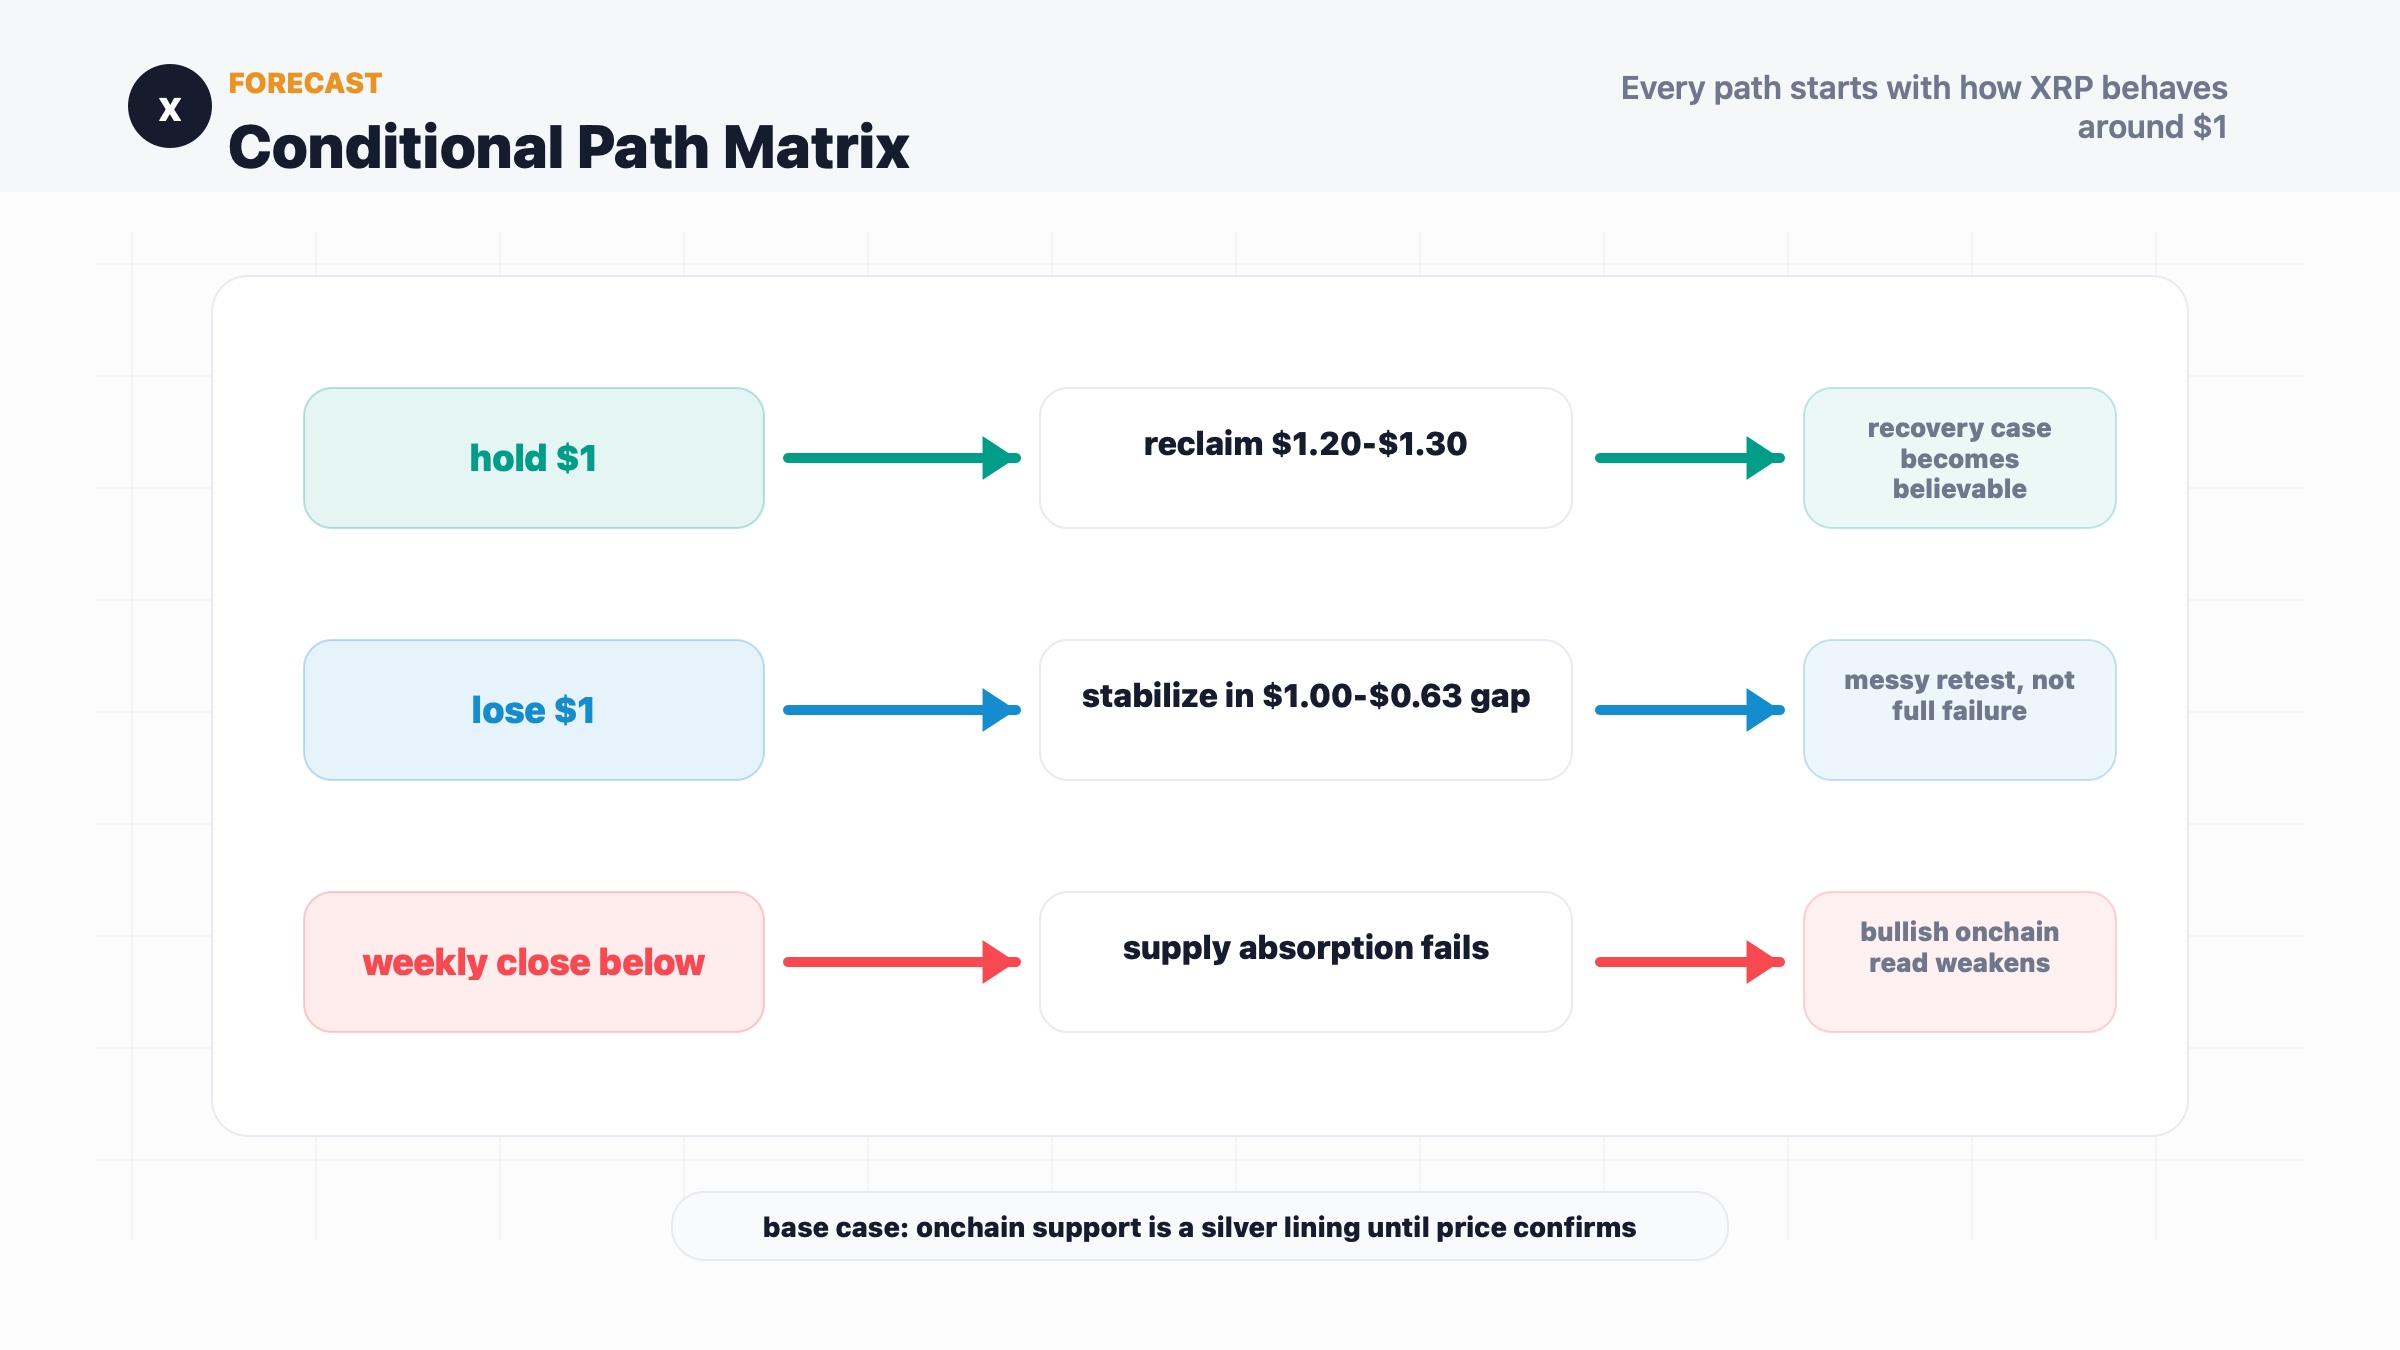
My base case is cautious: the onchain data deserves attention, but the chart deserves obedience. XRP needs price confirmation before the "silver lining" becomes an actual reversal.
Investment Takeaway
XRP is a good example of why market analysis is annoying in a useful way.
One dataset says coins are leaving exchanges. Another says whales are accumulating. ETF flows are still positive. All of that sounds supportive. Then the chart walks in, points at $1, and asks a much less flattering question: if demand is so strong, why is price still here?
That is the right question.
For traders, the setup is level-driven. Above $1.20-$1.30, the recovery case becomes more believable. Below $1, the $1.00-$0.63 gap becomes the main battlefield.
For longer-term investors, the lesson is not to ignore the onchain data. It is to make it earn confirmation. Accumulation is useful. Price acceptance is better.
Sources
- Cointelegraph via TradingView: XRP risks drop below $1, but onchain data highlights silver lining (https://www.tradingview.com/news/cointelegraph%3Abf0f8351e094b%3A0-xrp-risks-drop-below-1-but-onchain-data-highlights-silver-lining/)
- Cointelegraph original URL from downloaded article: XRP may lose $1, but onchain data signals improving outlook (https://cointelegraph.com/markets/xrp-may-lose-1-but-onchain-data-signals-improving-outlook-heres-why)
- TradingView: BINANCE:XRPUSDT weekly chart (https://www.tradingview.com/chart/?symbol=BINANCE%3AXRPUSDT&interval=W)
- SEC: SEC Charges Ripple and Two Executives with Conducting $1.3 Billion Unregistered Securities Offering (https://www.sec.gov/newsroom/press-releases/2020-338)
- Axios: SEC formally sues cryptocurrency company Ripple (https://www.axios.com/2020/12/22/sec-formally-sues-cryptocurrency-company-ripple)
|
DISCLAIMER:
1. All content on this website (including but not limited to articles, data, charts, and analyses) is for general informational purposes only and does not constitute any form of investment advice, trading recommendation, or financial guidance. 2. Cryptocurrencies and digital assets are subject to extreme price volatility and high investment risk; you may lose part or all of your principal. Past performance does not predict future results. 3. The information on this website is based on sources we believe to be reliable, but we do not guarantee its accuracy, completeness, or timeliness. Any investment decisions made based on this website’s information are at your own risk. 4. We strongly recommend that you conduct your own thorough research and consult an independent, licensed financial advisor before making any investment decisions. |
Recommended reading
Latest News