Key Takeaways
- XRP rose more than 3% to around $1.18 after reclaiming the $1.14-$1.15 area on its strongest volume since the recent sell-off.
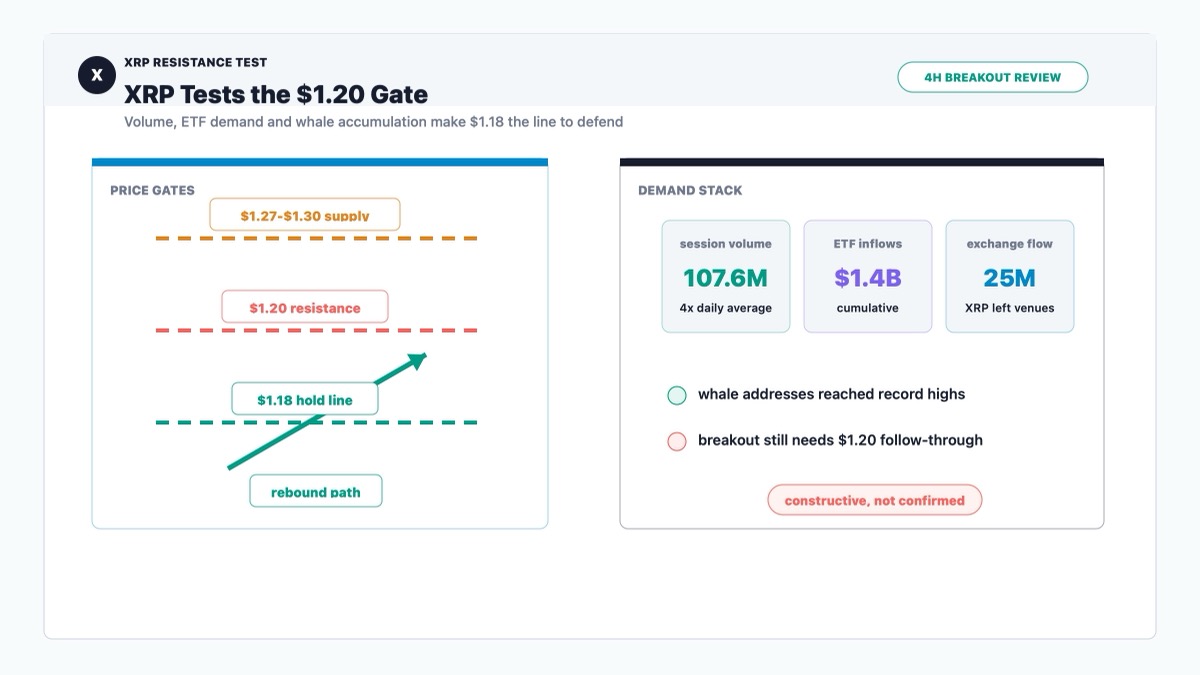
- The rally looks constructive, but the real test is still ahead: $1.20 is the first resistance, followed by the heavier $1.27-$1.30 zone.
- ETF inflows, whale accumulation and exchange outflows support the rebound story, but XRP still needs to hold $1.18 to avoid becoming another short-lived bounce.
What Happened
XRP finally did something markets tend to respect: it moved up with volume.
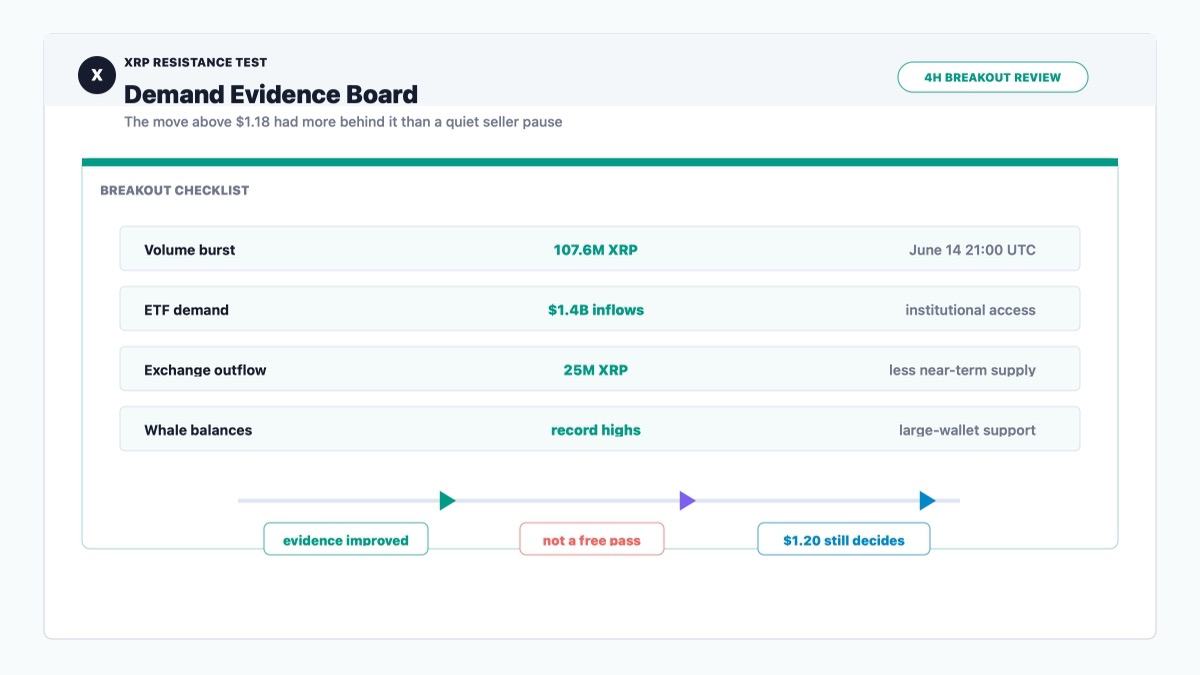
According to CoinDesk, the Ripple-linked token climbed from about $1.1503 to $1.1866 during the 24-hour session, gaining more than 3% and briefly reaching $1.1928 before settling above $1.18. The key move came during the June 14 21:00 UTC session, when volume surged to 107.6 million XRP, more than four times the daily average.
That part matters.
A weak bounce can happen because sellers take a nap. A better bounce happens because buyers actually show up. This one had enough participation to force traders to stop treating XRP like a falling object and start treating it like a market trying to build a floor.
The first technical shift was the reclaim of $1.14-$1.15. That zone had acted like resistance during the recent decline. Once XRP pushed through it, the level turned into the first area bulls need to defend.
Now the market is staring at a simple question: can XRP turn this rebound into a trend?
The next levels make that question easier to track. $1.18 is the first support after the breakout. $1.20 is the immediate psychological resistance. Above that, the $1.27-$1.30 area becomes the larger test, where previous supply and technical resistance may start pushing back.
The fundamental background is also helping. CoinDesk noted that XRP-linked ETFs have attracted roughly $1.4 billion in cumulative inflows, while more than 25 million XRP recently left exchanges and whale addresses climbed to record highs.
That does not guarantee a breakout.
But it does mean the rebound is not floating in empty air.
Why This Matters for Bitcoin and Crypto Markets
XRP is not Bitcoin's steering wheel. It does not decide where the whole crypto market goes.
But XRP can be a useful mood ring for altcoin risk.
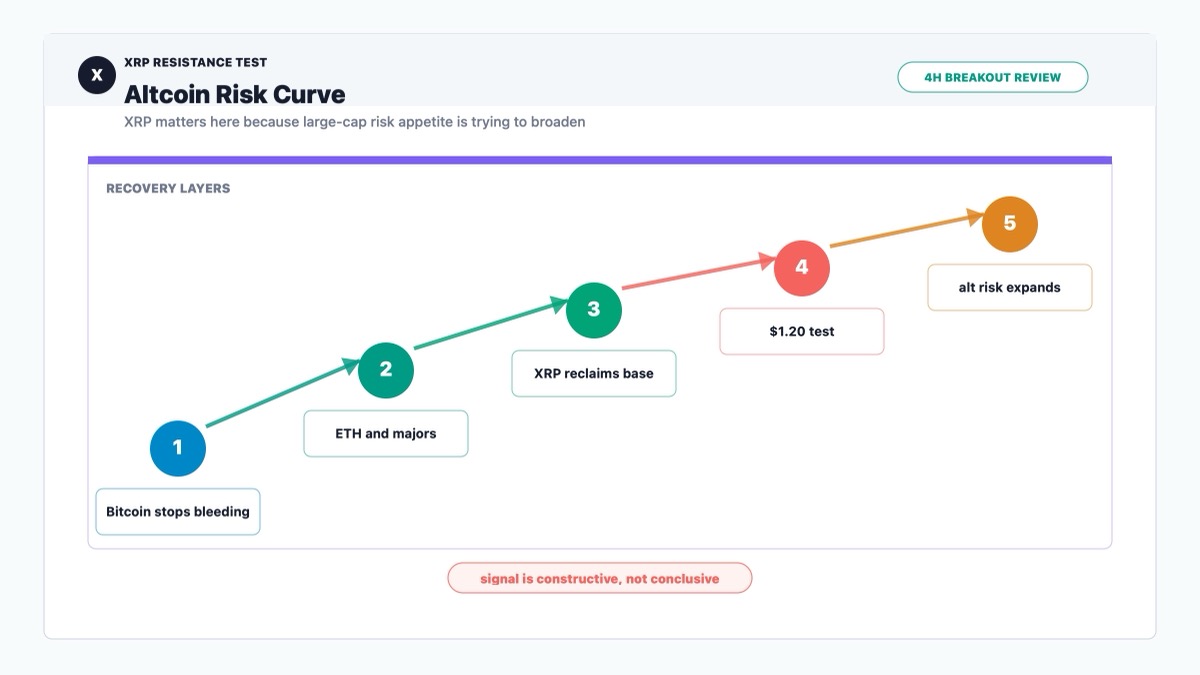
When a large-cap altcoin rebounds on real volume, while ETF demand and whale accumulation are part of the story, the market is telling us something specific: risk appetite is no longer limited to Bitcoin. Traders are willing to look further out on the crypto risk curve.
That is important because crypto recoveries often come in layers.
First, Bitcoin stops bleeding. Then Ethereum and large-cap altcoins begin to stabilize. Then traders start asking whether sector-specific stories can outperform. XRP sits in that middle layer: large enough to matter, liquid enough to trade seriously, and narrative-heavy enough to attract momentum once the chart improves.
The current move fits that pattern. XRP is not rallying because the entire market has become fearless. It is rallying because several smaller pieces are lining up at the same time: stronger volume, ETF inflows, whale accumulation, exchange outflows and a clean technical reclaim.
That combination changes the conversation.
Before the breakout, XRP was mostly a damage-control chart. The question was whether support would hold. After the reclaim, the question becomes whether buyers can defend a higher base and press into resistance.
That is a different market.
Still, this is not the part where we pretend the hard work is over. A token can look energetic at $1.18 and still fail at $1.20. It can attract institutional interest and still spend weeks chopping sideways. It can print one impressive volume candle and still need follow-through.
So the signal is constructive, not conclusive.
XRP has earned attention.
Now it has to earn trust.
Historical Parallel
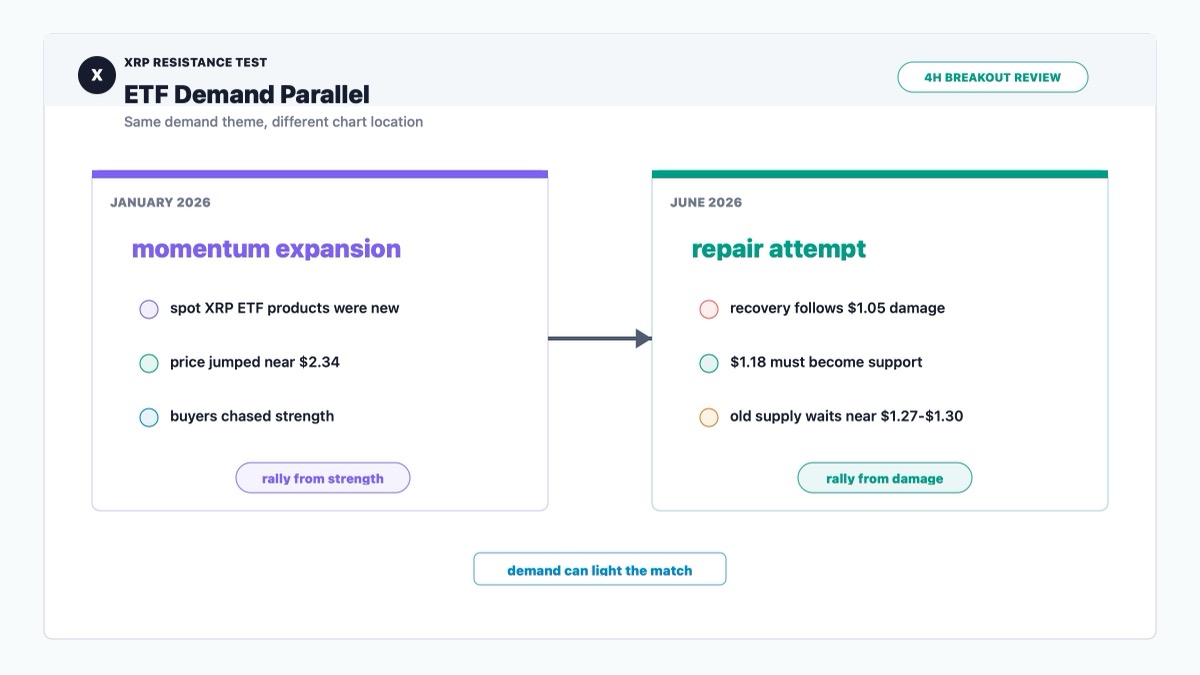
A useful historical parallel is XRP's early-2026 ETF-driven rally, when the token surged as investors treated spot XRP exchange-traded products as a new demand channel rather than just another trading headline. Barron's reported in January 2026 that XRP jumped more than 9% to around $2.34, with spot XRP ETF inflows cited as a major driver after the products launched in late 2025.
The similarity is the demand story. In both cases, XRP's price action was not only about chart traders chasing candles. The move was tied to the idea that institutional access had improved. ETF inflows gave buyers a cleaner narrative: if traditional capital can enter more easily, XRP may deserve a higher liquidity premium than it had during earlier cycles.
That is also why the current rebound above $1.18 matters. CoinDesk's report points to roughly $1.4 billion in cumulative XRP-linked ETF inflows, rising whale balances and XRP leaving exchanges. Those are not magic words. They do not force price higher. But they do suggest that the market has a demand base underneath the short-term technical move.
The difference is the chart location. The January rally was a momentum expansion from a stronger market position. Today's move is a recovery attempt after a bruising decline toward the $1.05 area. That makes the current setup more fragile. A rally from strength can tolerate hesitation. A rally from damage has to prove itself quickly, because trapped holders and short-term sellers are waiting at every resistance shelf.
The lesson is simple: institutional demand can light the match, but price structure decides whether the fire spreads. In January, ETF demand helped XRP run. Now, ETF demand may help XRP stabilize.
Those are related stories.
They are not the same story.
XRP Price Reaction and K-Line Analysis
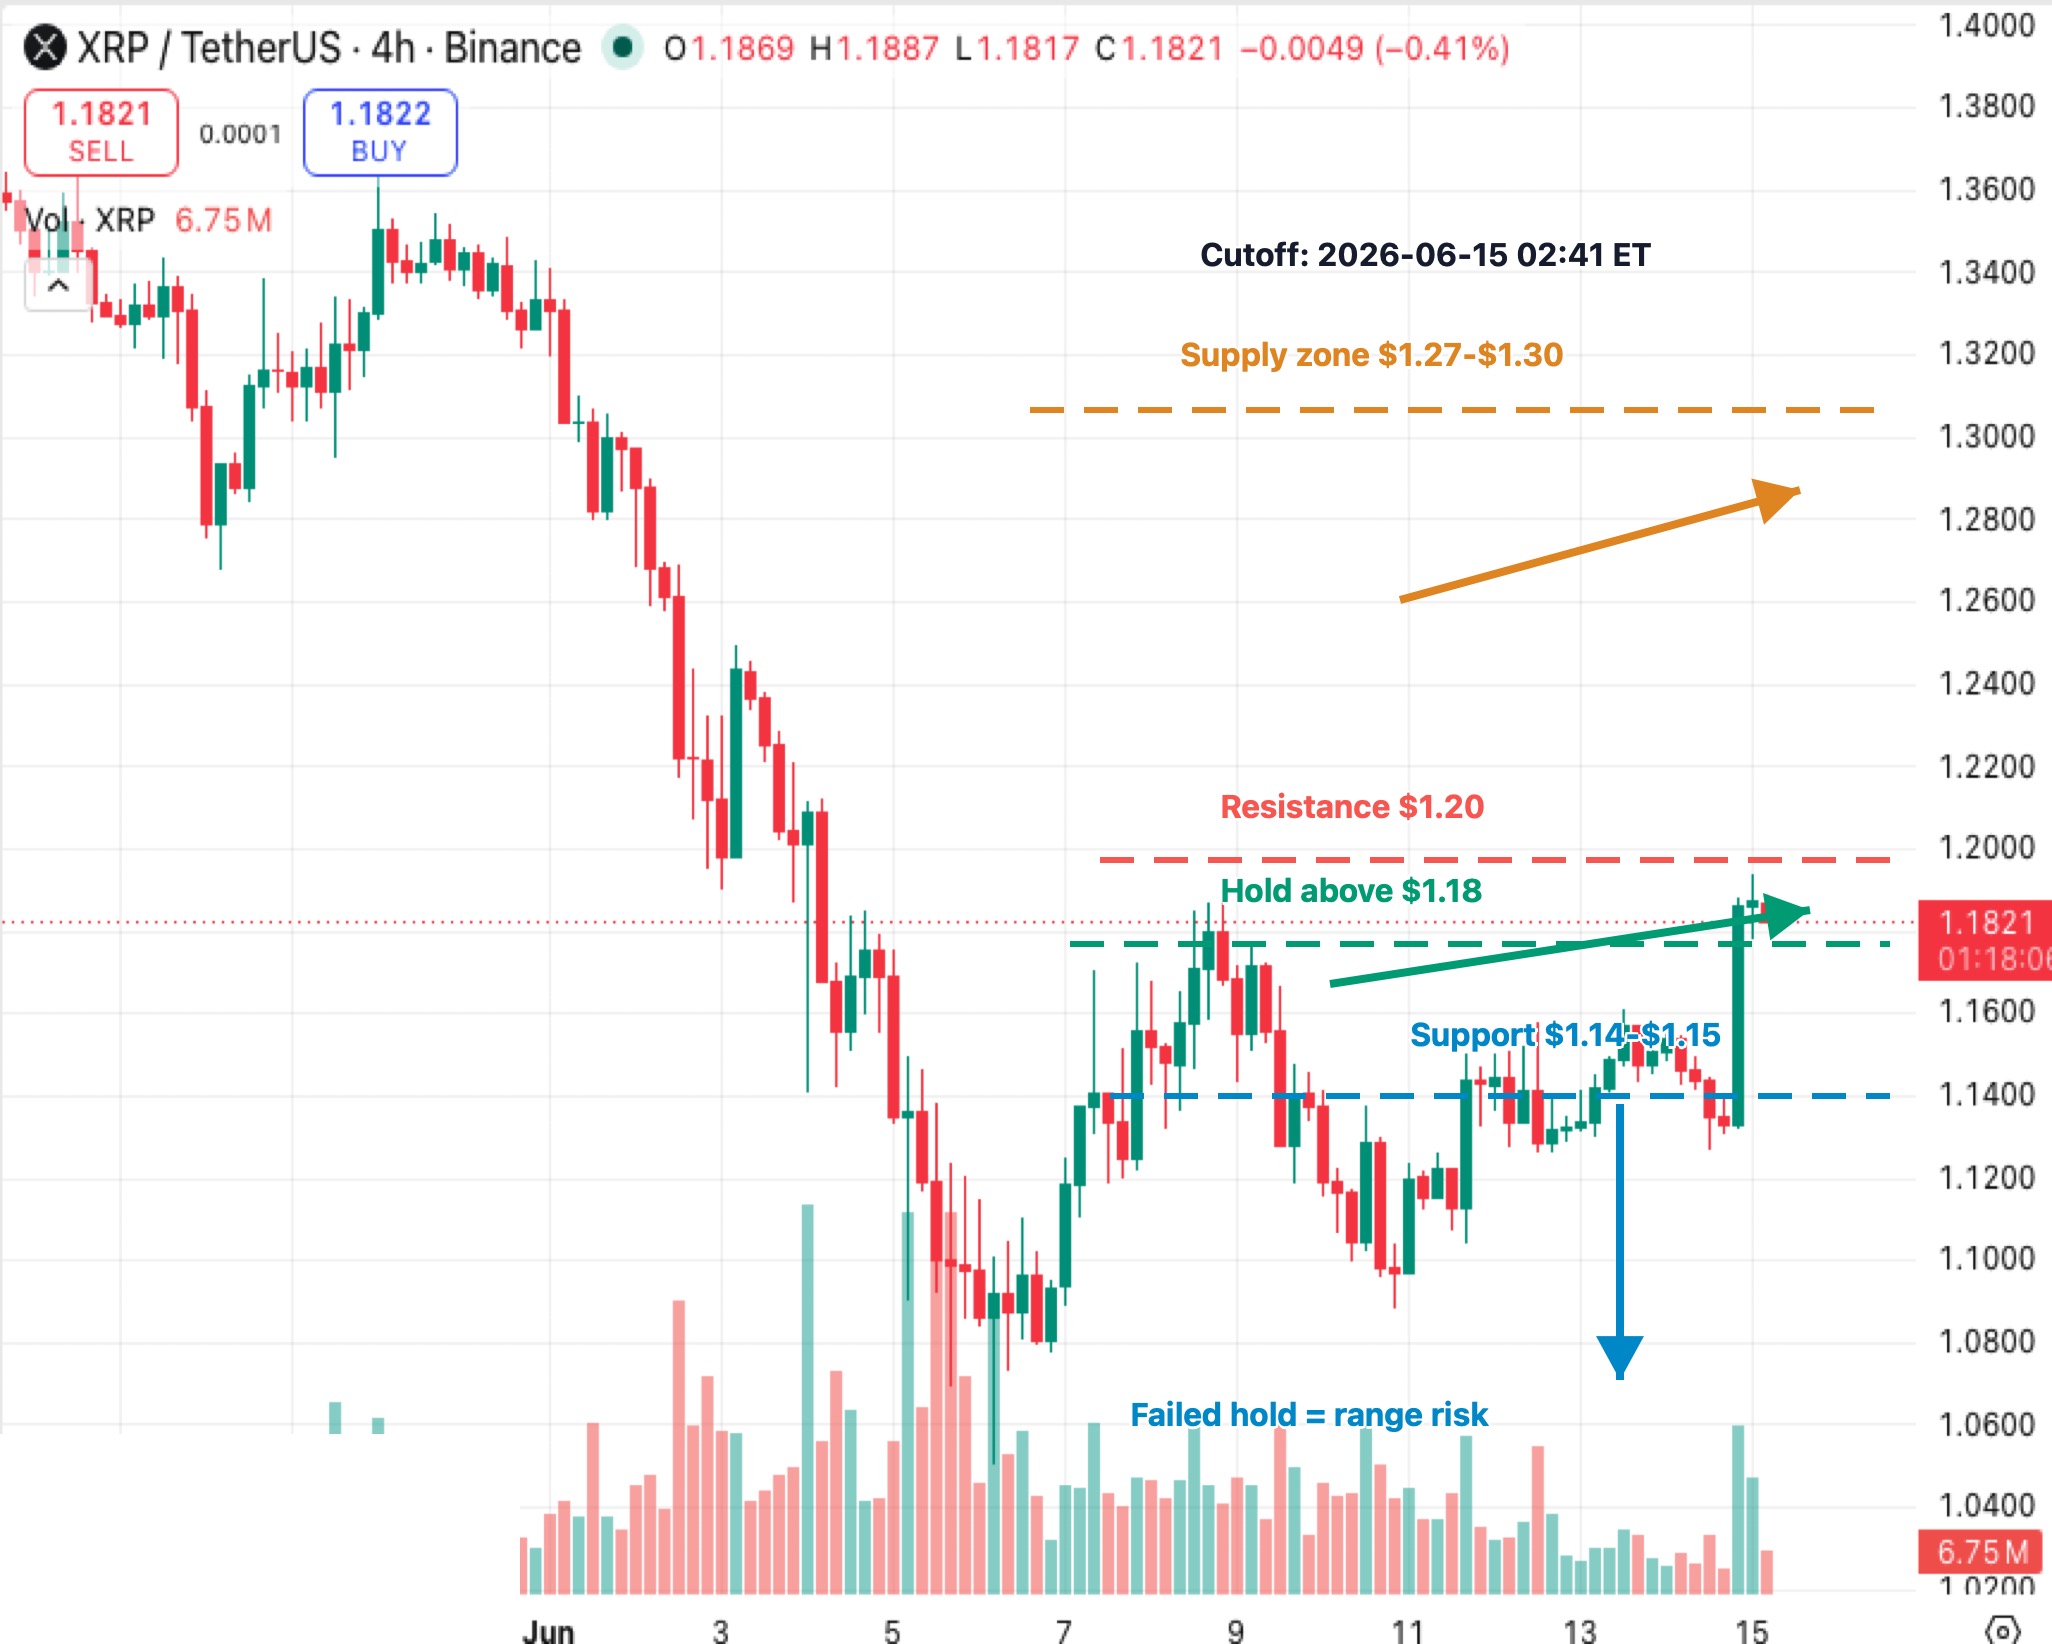
The XRPUSDT 4H chart shows a market trying to repair itself after a sharp slide.
The first half of the chart is ugly in a clean way: lower highs, lower lows and repeated selling pressure from the $1.30s down toward the $1.05-$1.10 region. That was not a market calmly drifting lower. That was a market repricing.
Then the behavior changed.
XRP stopped making easy new lows, began building a base, reclaimed $1.14-$1.15, and then pushed into the $1.18 area with a strong candle and volume expansion. That is the kind of move that can mark the start of a repair phase, because buyers are no longer waiting for perfect prices. They are stepping in before the chart fully heals.
The immediate battleground is $1.18. If XRP holds above that level, the breakout has a better chance of becoming a base. If it slips below $1.18 but stays above $1.14-$1.15, the setup remains alive but less clean.
$1.20 is the next test. It is psychological, visible and close enough that short-term traders will care about it. A decisive break above $1.20 would make the move look less like a bounce and more like a continuation attempt.
The larger resistance zone sits around $1.27-$1.30. That is where the chart has to answer a harder question: are new buyers strong enough to absorb old supply?
For now, XRP has done enough to make the bearish case less comfortable.
It has not done enough to make the bullish case automatic.
Key Levels to Watch
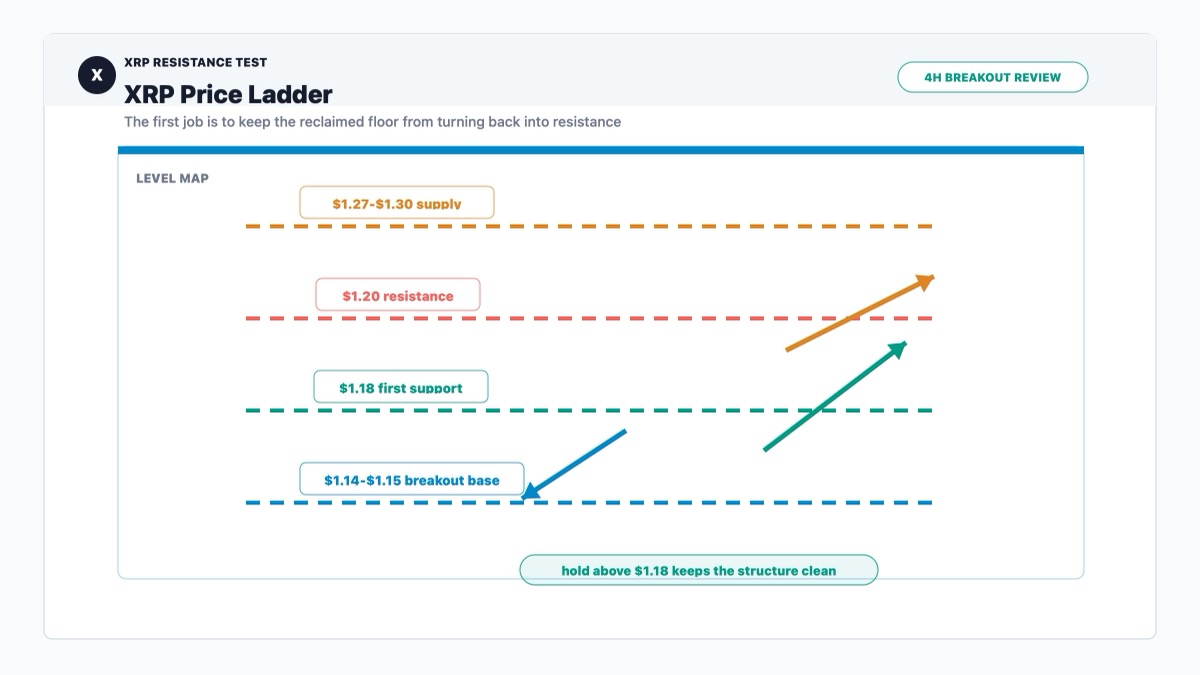
- $1.18: First support after the breakout. Holding this keeps the rebound structure clean.
- $1.14-$1.15: The key breakout support. Losing this would make the move look much more like a failed rally.
- $1.20: Immediate resistance and the next proof-of-strength level.
- $1.27-$1.30: Larger supply zone where the recovery would face a more serious test.
Conditional Forecast
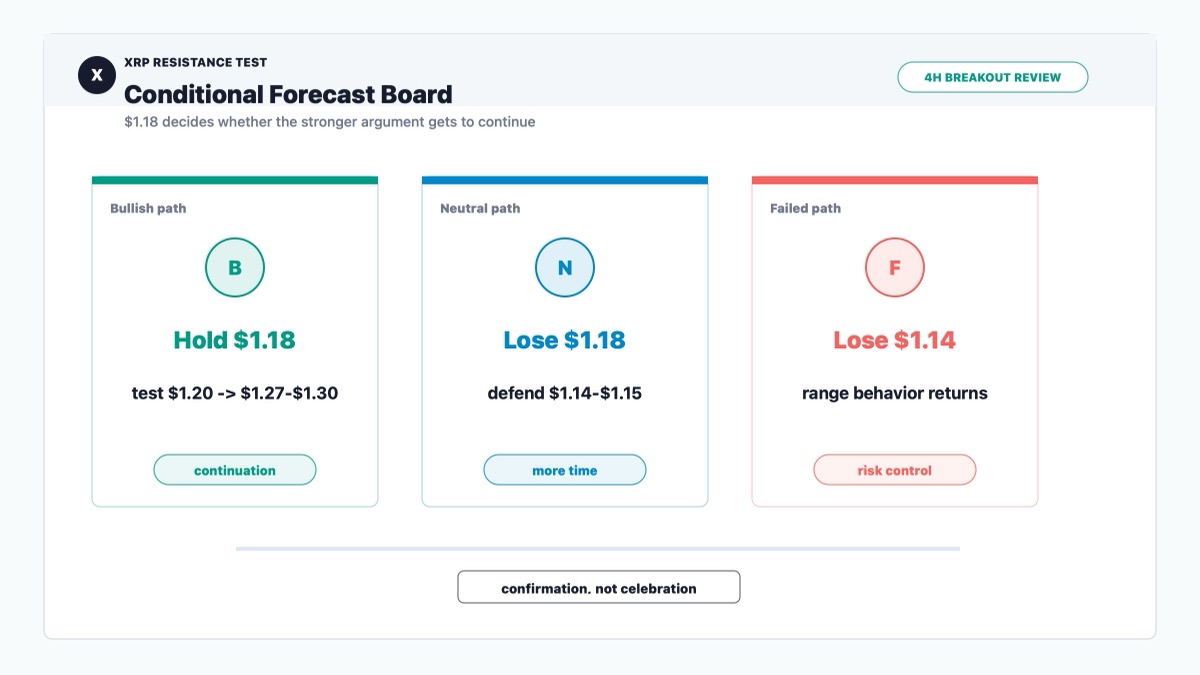
If XRP holds above $1.18, the next logical test is $1.20. A clean break there would open the path toward $1.27-$1.30 and would support the idea that ETF demand and whale accumulation are finally showing up in price.
If XRP loses $1.18 but holds $1.14-$1.15, the setup becomes more neutral. The breakout would still be alive, but the market would need more time to prove that buyers can defend the reclaimed zone.
If XRP falls back below $1.14, the bullish case weakens quickly. That would tell traders the breakout did not hold, and the market could rotate back into range behavior near the lower support area.
The cleanest version of the trade is not "XRP went up, therefore XRP is fixed."
The cleaner version is this: XRP has built a better argument, and now $1.18 decides whether that argument gets to continue.
Investment Takeaway
XRP's rebound is meaningful because it came with volume, institutional-demand support and a technical reclaim.
That is a real improvement.
But improvement is not the same thing as confirmation. The market still has to deal with $1.20 first and $1.27-$1.30 after that. Those levels are where a hopeful chart becomes an honest test.
For investors, the practical read is simple. Above $1.18, XRP deserves more attention. Above $1.20, the recovery starts to look more serious. Above $1.30, the conversation changes again.
Below $1.14, the market starts asking the uncomfortable question.
Was this a base?
Or just another bounce with better lighting?
Sources
|
DISCLAIMER:
1. All content on this website (including but not limited to articles, data, charts, and analyses) is for general informational purposes only and does not constitute any form of investment advice, trading recommendation, or financial guidance. 2. Cryptocurrencies and digital assets are subject to extreme price volatility and high investment risk; you may lose part or all of your principal. Past performance does not predict future results. 3. The information on this website is based on sources we believe to be reliable, but we do not guarantee its accuracy, completeness, or timeliness. Any investment decisions made based on this website’s information are at your own risk. 4. We strongly recommend that you conduct your own thorough research and consult an independent, licensed financial advisor before making any investment decisions. |
Recommended reading
Latest News