Key Takeaways
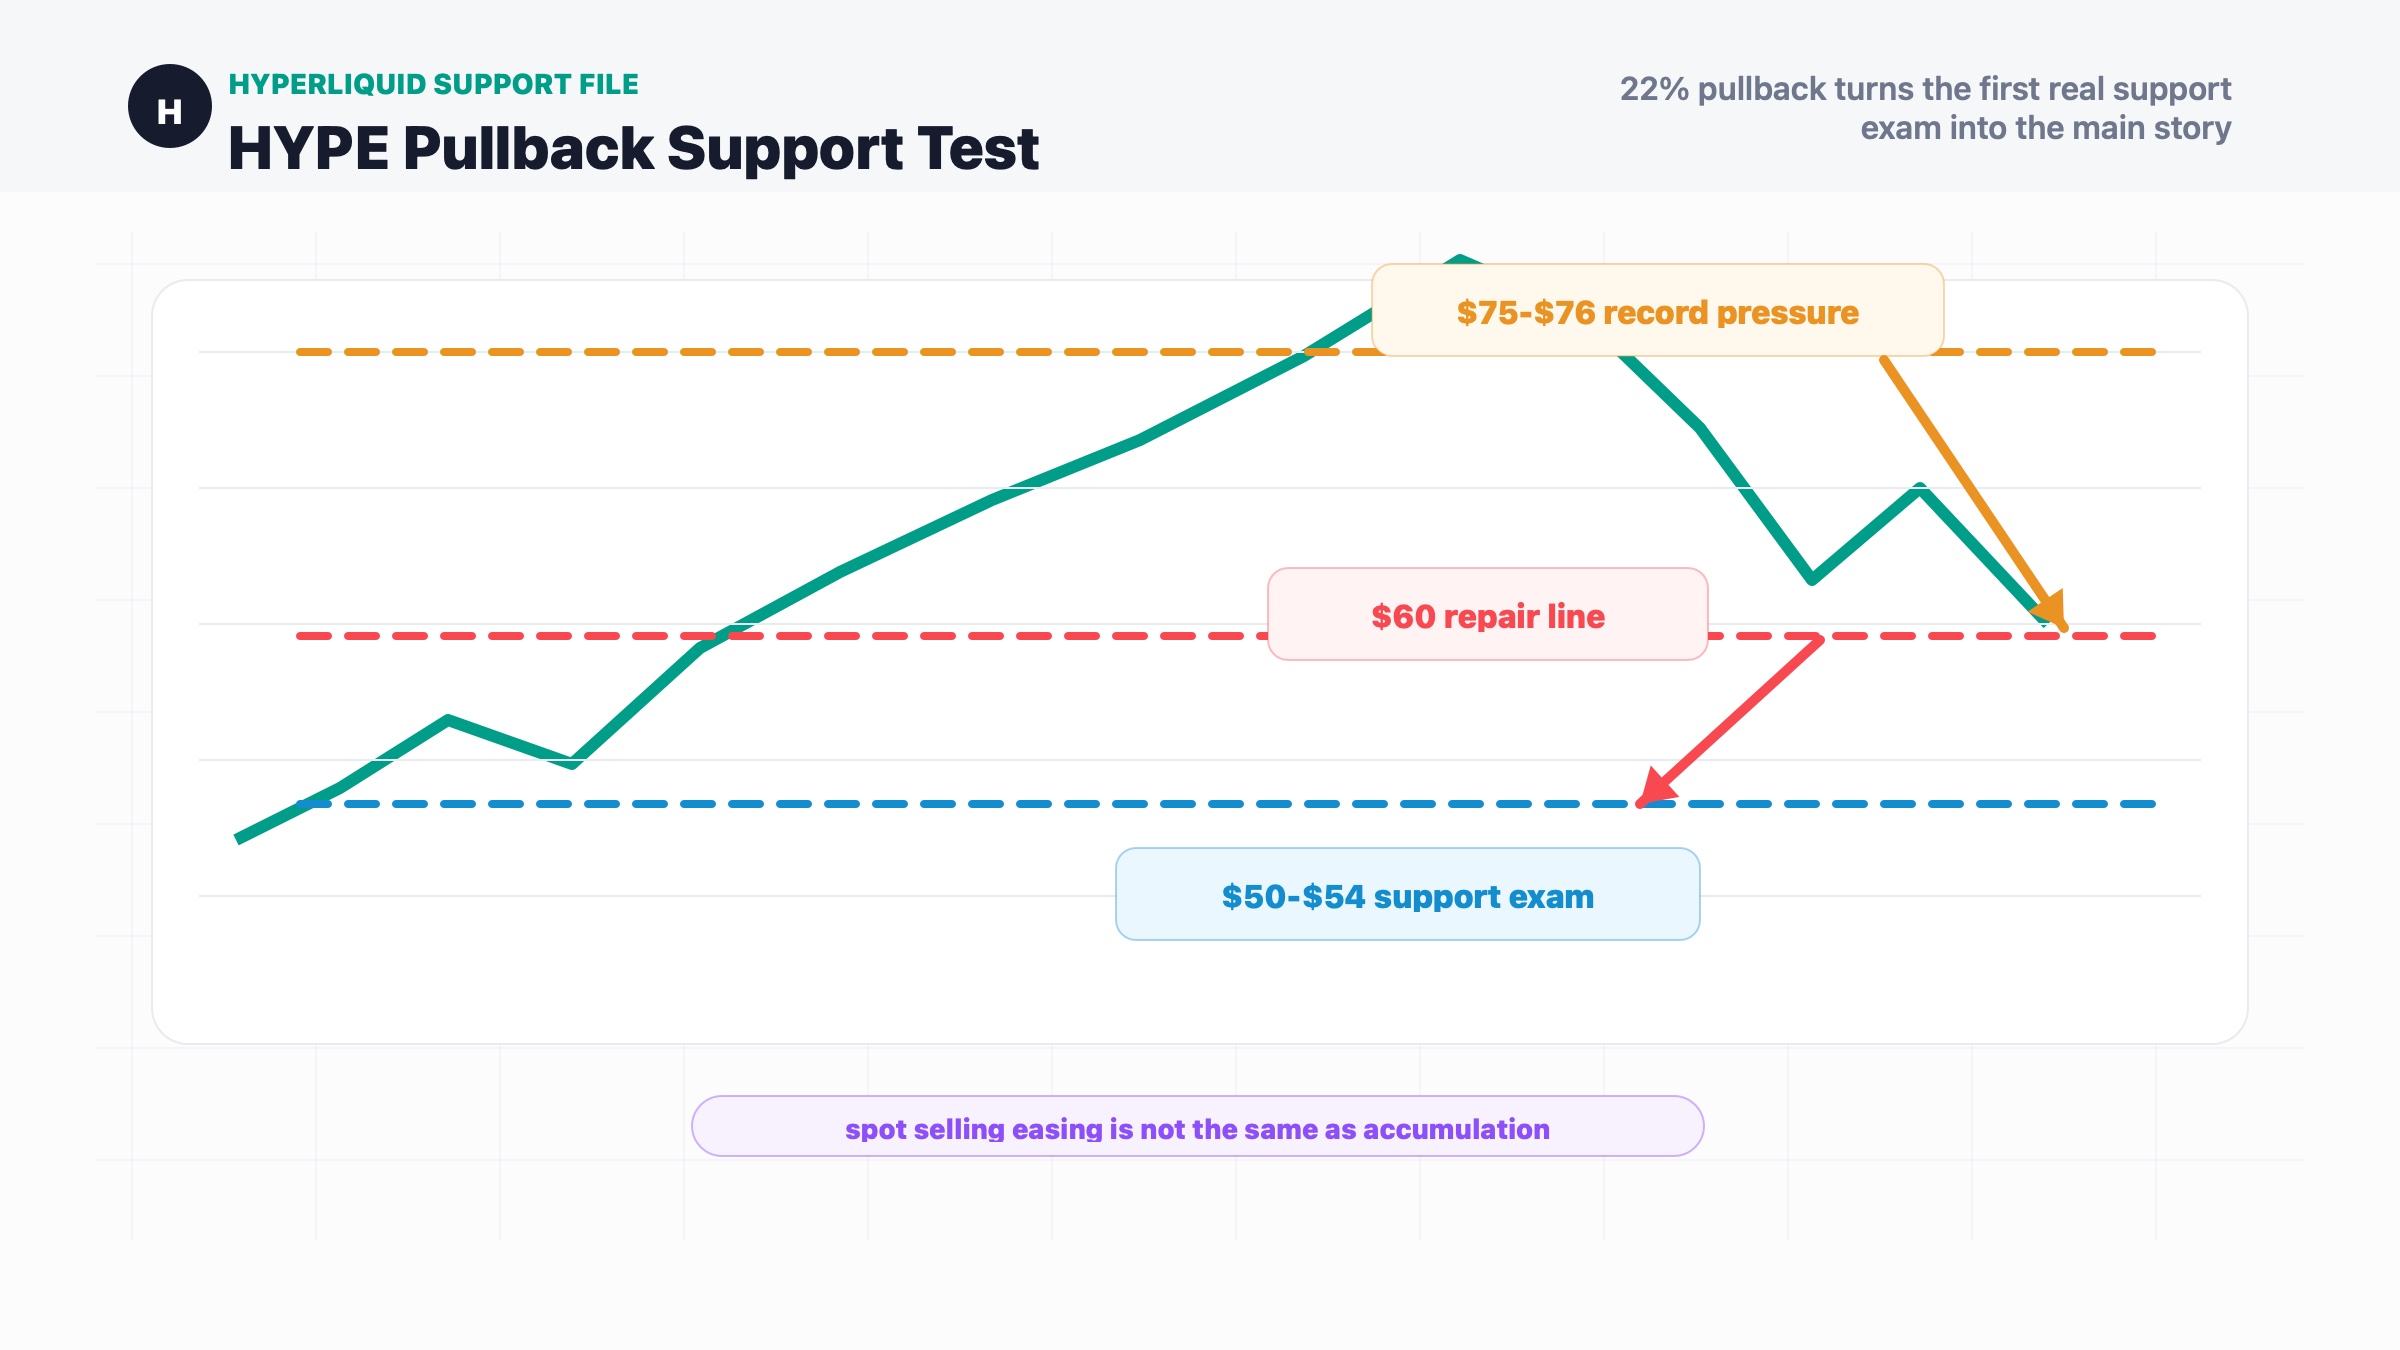
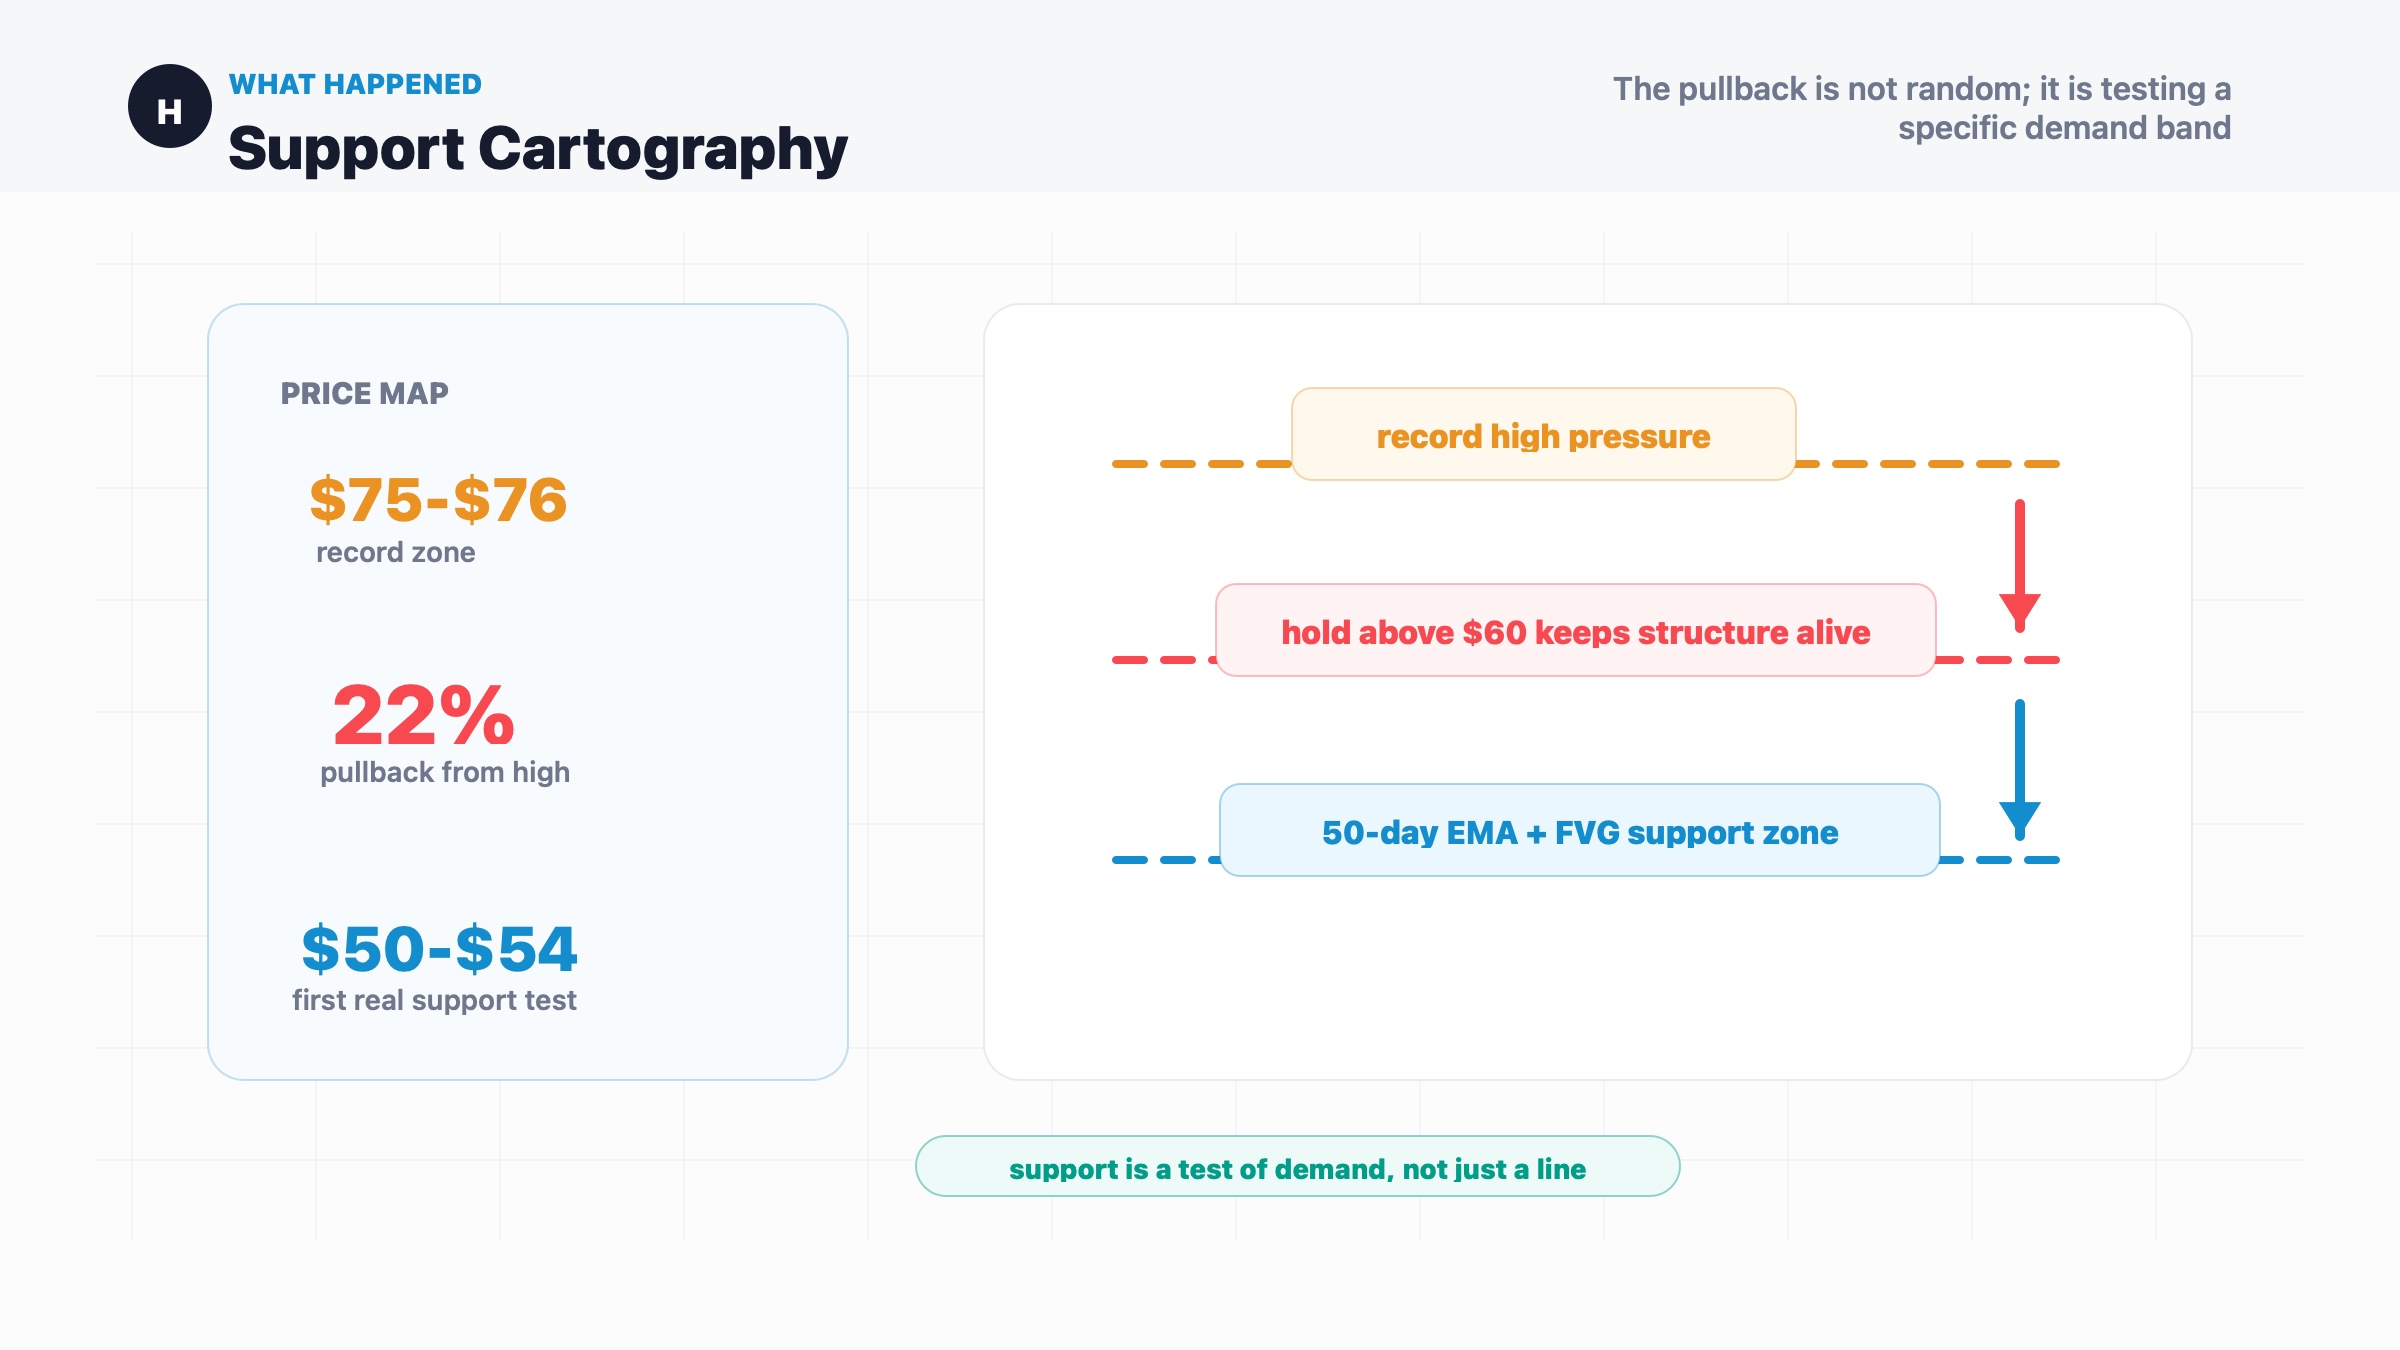
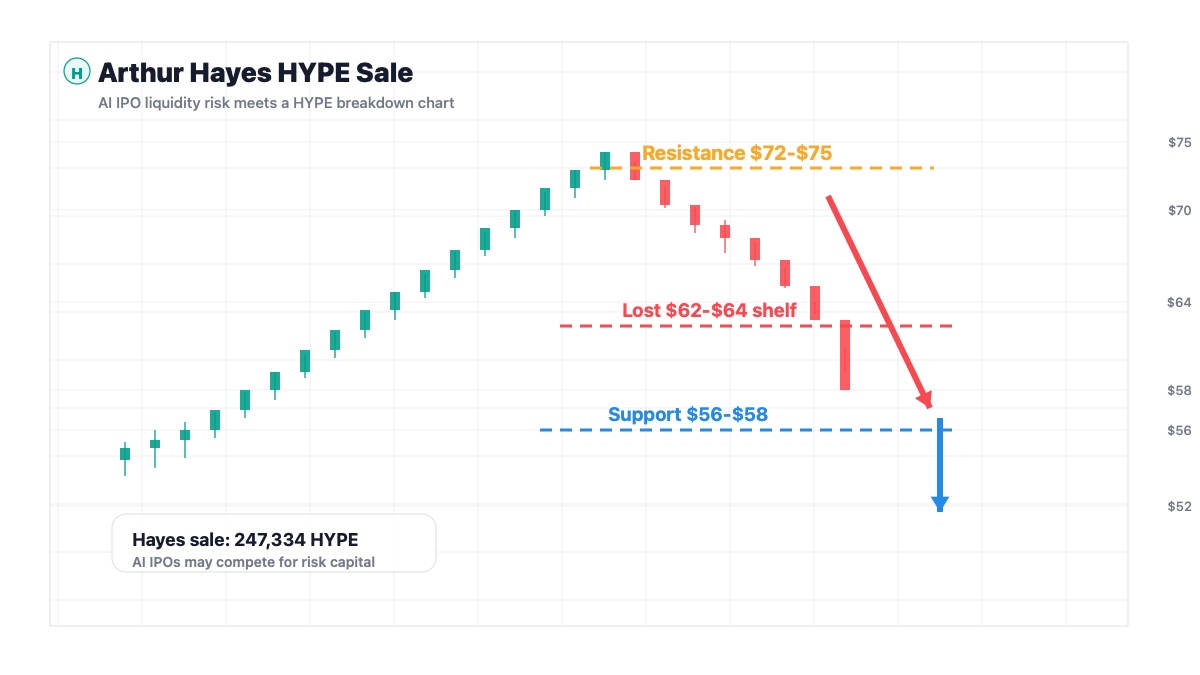
- HYPE has pulled back roughly 22% from its $75-$76 record zone, turning the $50-$54 area into the first real support test of the 2026 uptrend.
- Spot selling pressure appears to be easing, but that is not the same thing as aggressive accumulation.
- Futures traders are reducing exposure, with open interest falling from about $2.2 billion to $1.73 billion.
- A hold above $60 keeps the structure repairable; a daily close below $53 would be the first meaningful bearish shift on the daily chart this year.
What Happened
HYPE has reached the part of the rally where the chart stops being a victory lap and starts asking questions.
According to Cointelegraph, Hyperliquid's HYPE token fell about 22% from its record high near $75-$76. The move brought price toward the most important support zone of the year: roughly $50-$54, where the 50-day exponential moving average and an unfilled daily fair-value gap sit below current prices.
That is the clean technical version. The market-structure version is more interesting.
Spot selling has started to ease, but the numbers are not exactly a parade. Cointelegraph cited Velo data showing spot cumulative volume delta improving from recent lows, while still sitting deeply negative near $95 million. In normal language: sellers are no longer hitting the market with the same force, but buyers have not yet shown the kind of demand that makes a correction feel finished.
The derivatives market is cooling too. Open interest has dropped from about $2.2 billion to $1.73 billion, and derivatives CVD remains deeply negative near $389 million. Traders are not leaning into fresh leverage. They are reducing exposure.
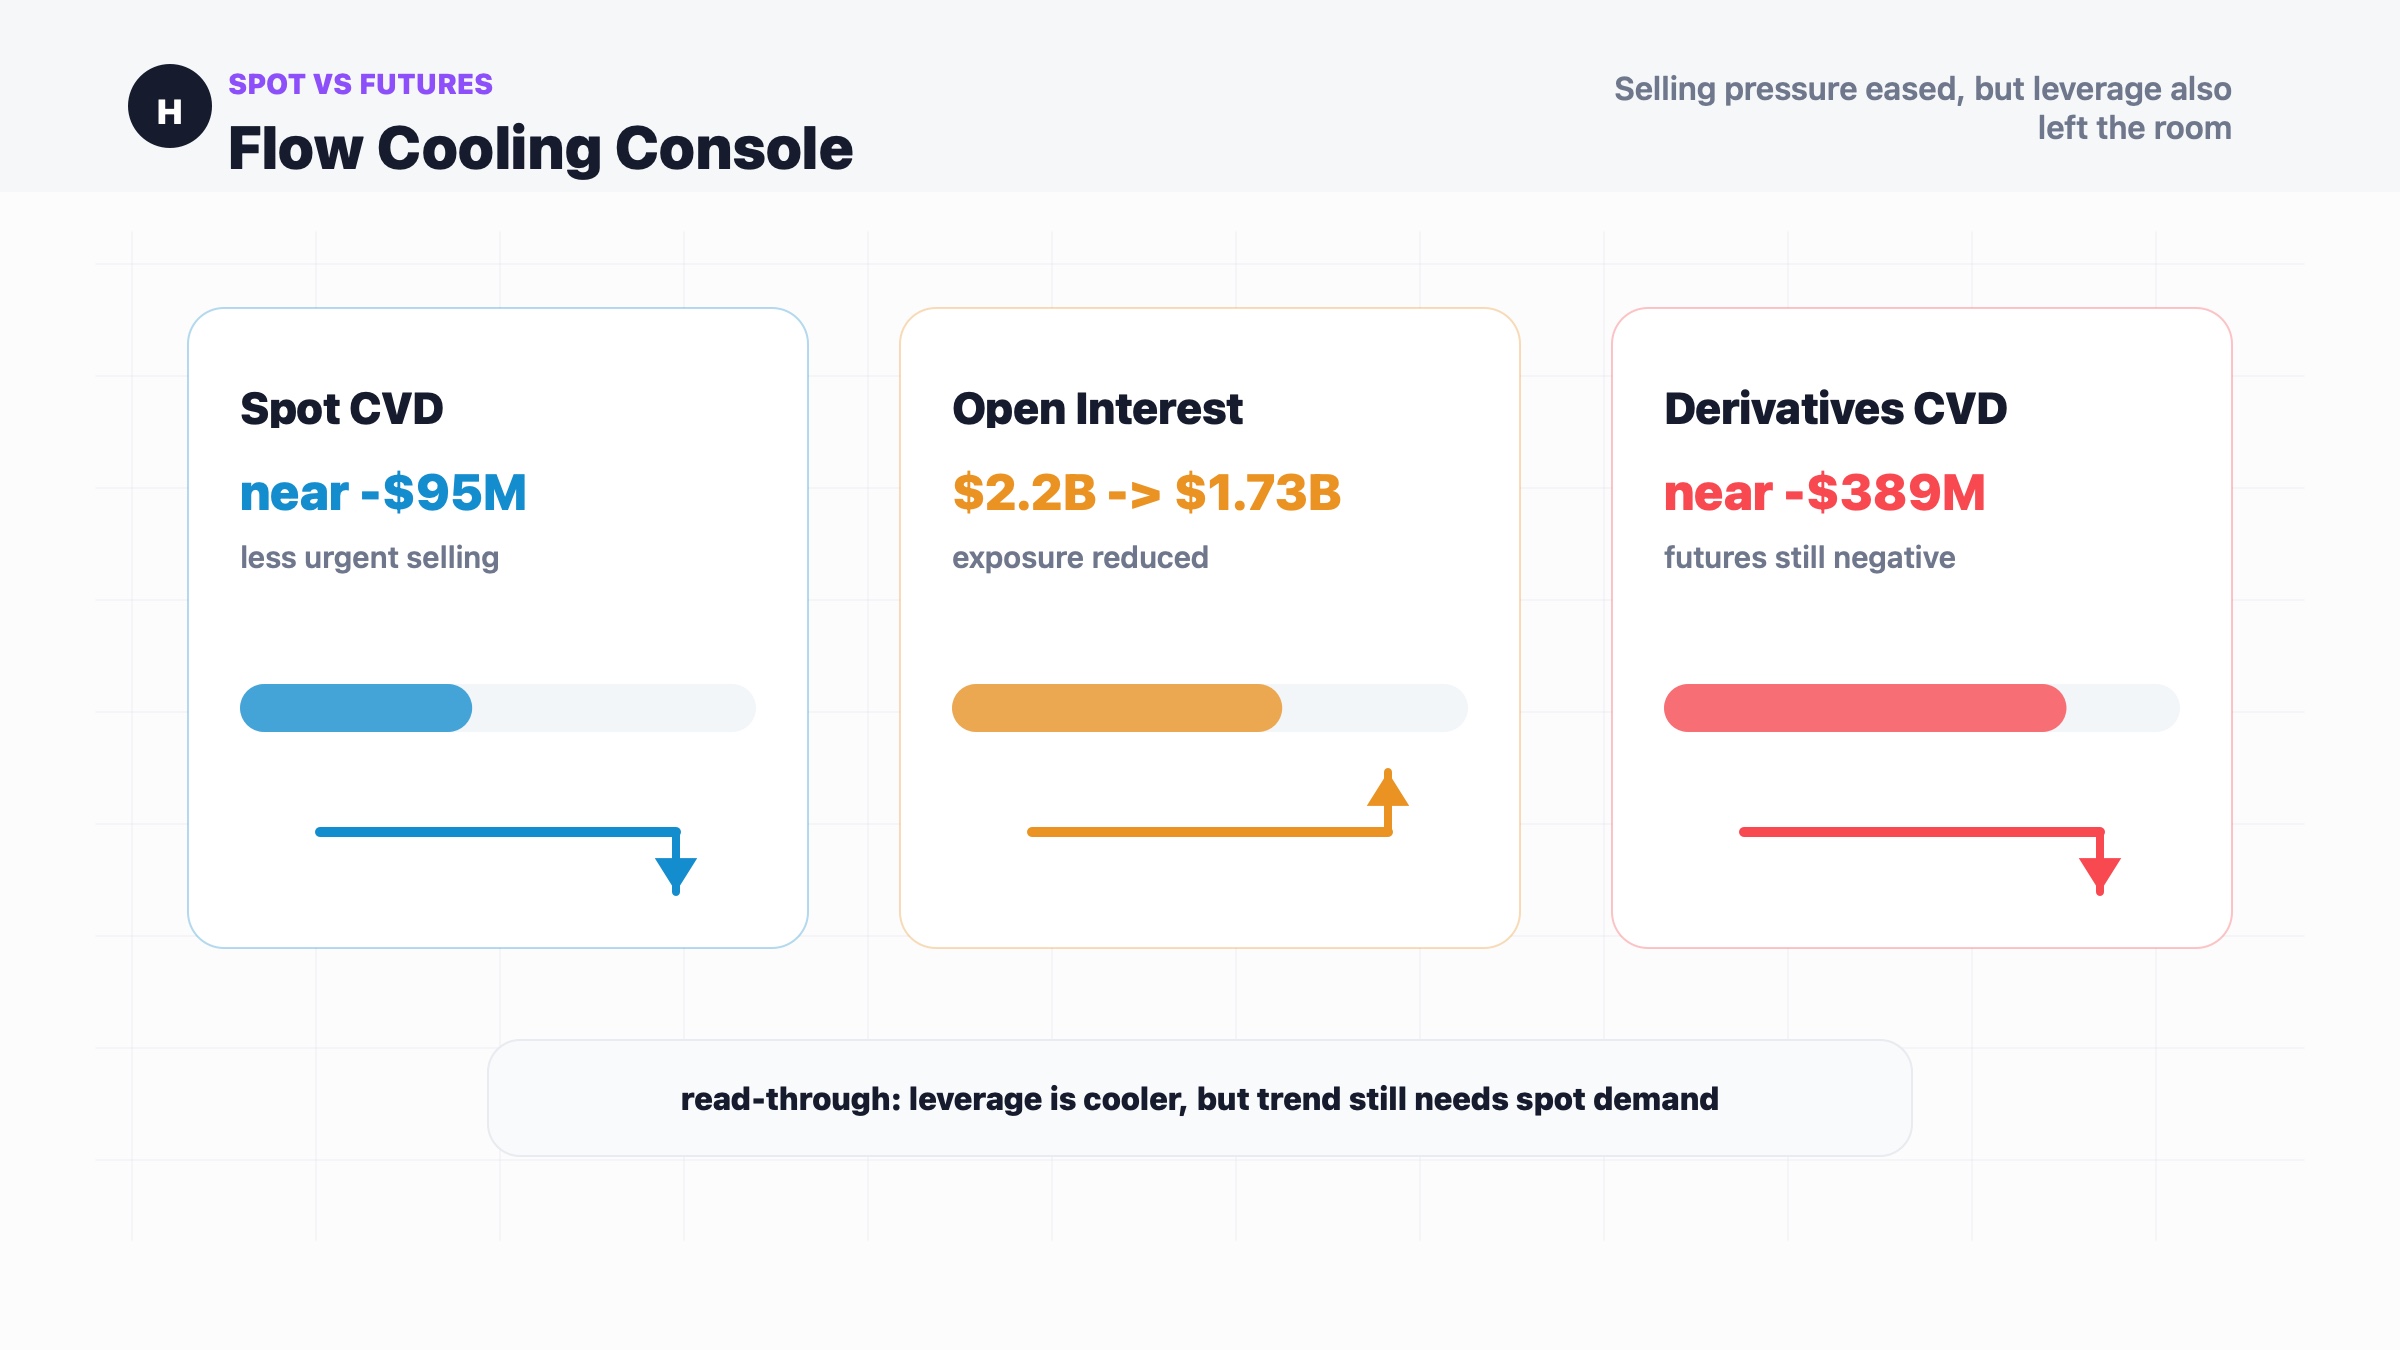
This creates a very specific setup. HYPE is not collapsing in a straight line. It is not cleanly resuming the uptrend either. It is sitting in the awkward middle, where spot buyers are absorbing some supply while leveraged traders step back and ask whether the previous rally already got ahead of itself.
Markets enjoy this sort of ambiguity. It gives everyone just enough evidence to feel right and just enough risk to be wrong.
Why This Matters for HYPE and Crypto Markets
HYPE matters because it has been one of the cleaner altcoin momentum stories of the year.
The token is not just floating on a vague "altcoin season" slogan. Hyperliquid has a clear narrative: a fast perpetuals venue, heavy trading activity, protocol revenue, and a token that traders have treated as a direct expression of that growth. When HYPE rises, it is easy for the market to say, "Here is an altcoin with actual usage behind it."
The problem is that actual usage does not cancel market structure.
If a token rallies hard, builds crowded positioning, and then starts losing momentum near record highs, the next question is not whether the project is interesting. The next question is whether the marginal buyer is still there. That is what the $50-$54 zone is testing.
The spot-versus-derivatives split is the important part. Improving spot CVD suggests the urgent selling impulse may be fading. Falling open interest suggests leverage is leaving the room. That can be healthy if it removes excess risk and lets spot demand rebuild the trend. It can also be bearish if reduced leverage simply reveals that the rally was more positioning-driven than buyers wanted to admit.
For the broader altcoin market, HYPE is a useful signal because it sits near the intersection of narrative, revenue, liquidity and leverage. If HYPE can hold support and recover, traders may keep paying for high-usage altcoin stories. If it breaks down, the message is harsher: even the strong stories are not immune when positioning cools.
Historical Parallel
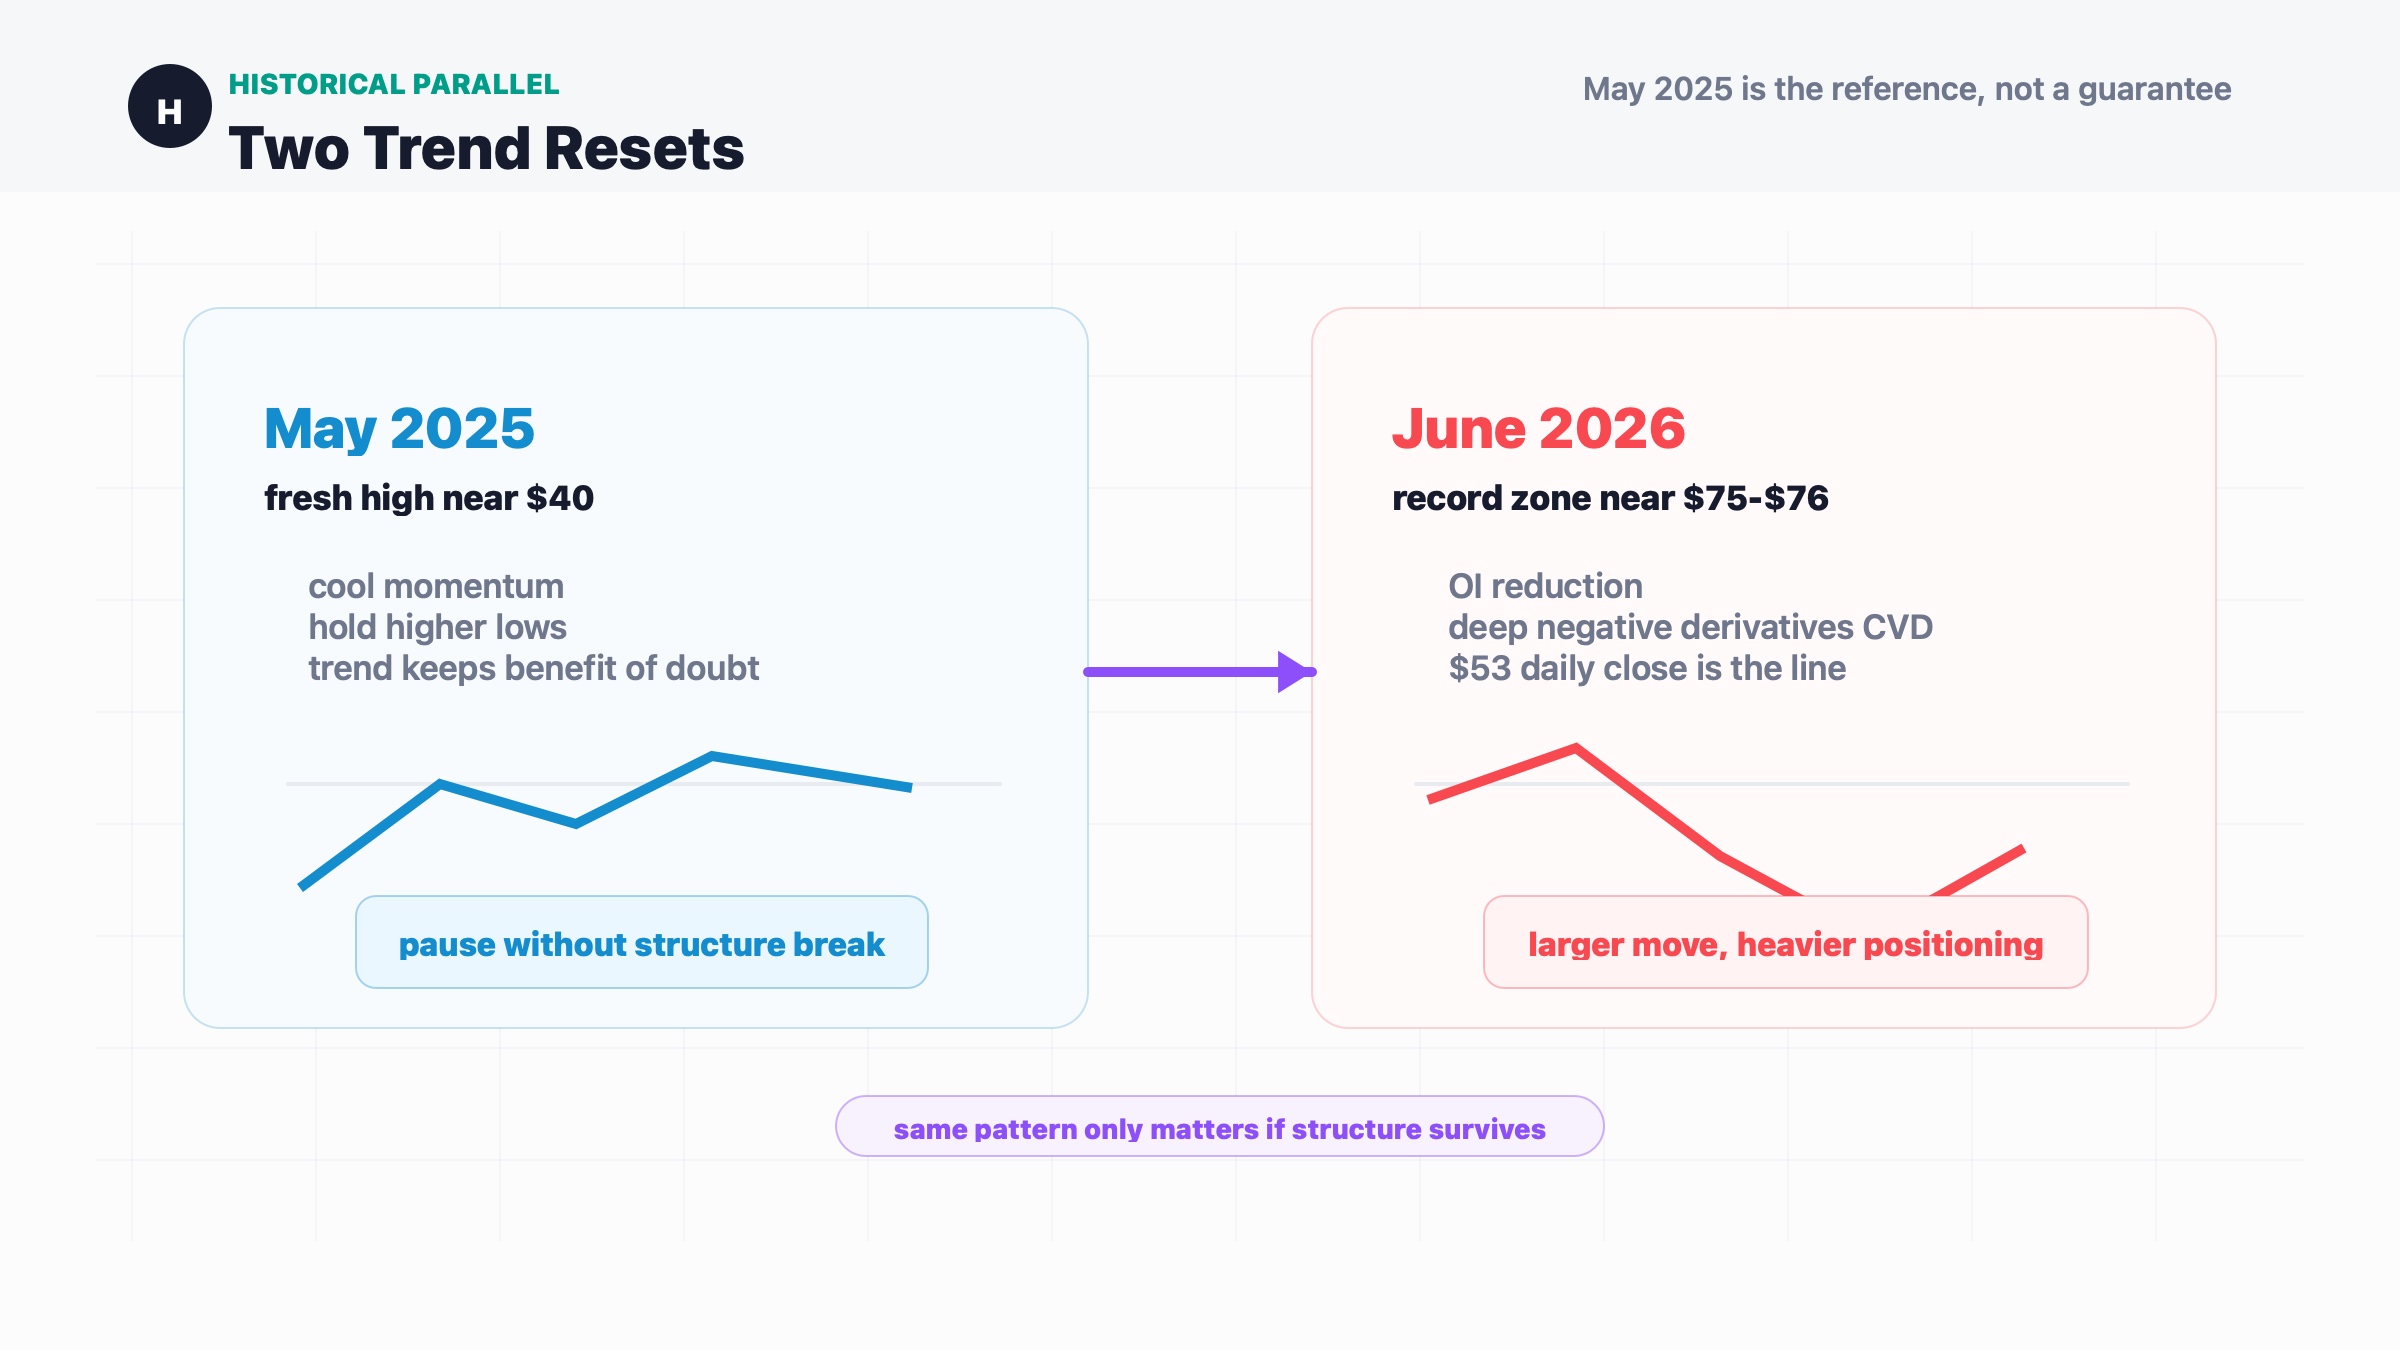
The closest historical parallel is HYPE's own consolidation in May 2025, which Cointelegraph also pointed to.
At that time, HYPE had printed a fresh high near $40 and then entered a multi-week pause. The important part was not that price went sideways. Strong assets are allowed to breathe. The important part was that the pullback cooled momentum without breaking the daily structure. Price stopped behaving like a vertical line, but it did not lose the sequence of higher lows that made the trend worth respecting.
The similarity is obvious: both episodes came after a fast advance into new-high territory. In both cases, momentum had become stretched, traders had grown used to upside follow-through, and the market needed to discover whether demand was real or merely excited. This is where a rally either becomes healthier or starts admitting that it was mostly speed wearing a nice jacket.
The difference is scale and positioning. The 2026 move is larger, more visible, and more heavily tied to derivatives exposure. HYPE is no longer just proving that it can break out. It is proving that it can hold a higher valuation after the market has already learned the story. That is a harder test. Early rallies can run on surprise. Mature rallies need confirmation.
The lesson for the current setup is not that HYPE must repeat May 2025. Markets do not owe us reruns. The lesson is that the daily structure matters more than the headline pullback percentage. If HYPE holds $50-$54 and recovers above $60 with improving spot demand, this can still look like a trend reset. If it loses $53 on a daily close, the comparison weakens quickly, because the chart would be doing something May 2025 did not: turning a pause into a break.
HYPE Price Reaction and K-Line Analysis
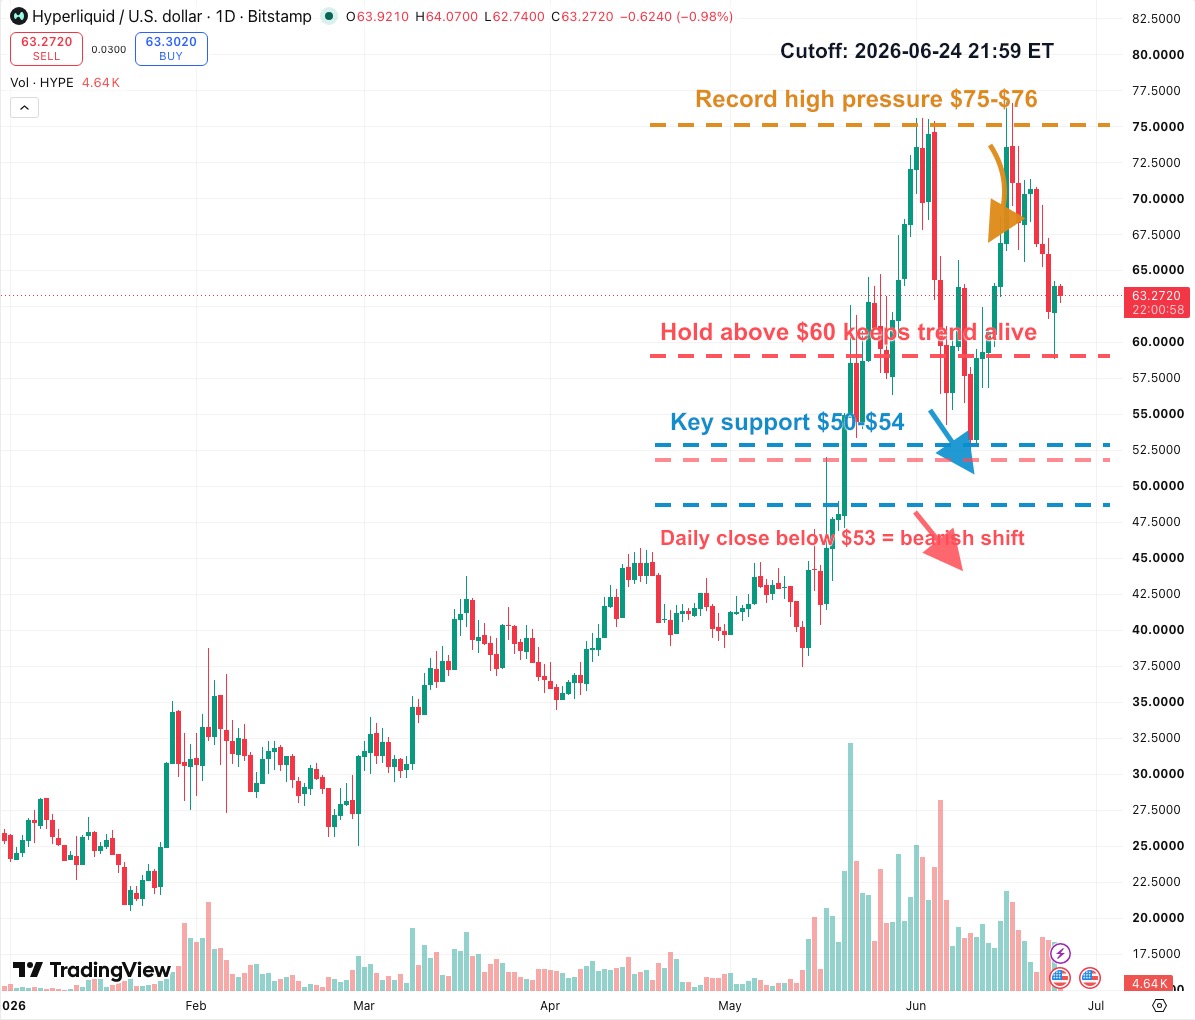
The HYPEUSD daily chart shows a strong uptrend that is no longer in the easy part.
From January into June, HYPE built a sharp series of higher highs and higher lows, then accelerated into the $75-$76 record zone. That zone has now become overhead pressure. The latest pullback did not erase the larger uptrend, but it did drag price back into the area where buyers need to prove the move still has structure.
By the chart cutoff, HYPE had rebounded above $60 and was trading near $63. That matters because $60 is the first practical repair line. A token can dip below $60 intraday or during a fast selloff and still keep its structure intact. But if it cannot hold back above $60, traders will start treating the bounce as weak rather than constructive.
The real test is lower: $50-$54. That is the support band highlighted by Cointelegraph, and it lines up with the article's 50-day EMA and fair-value-gap discussion. If HYPE revisits that zone and holds, the correction can still fit inside a broader uptrend.
The warning line is $53 on a daily close. A decisive close below that level would mark the first meaningful bearish shift on the daily chart this year. It would not make Hyperliquid irrelevant. It would simply tell traders that the token's price structure has stopped getting the benefit of the doubt.
Key Levels to Watch
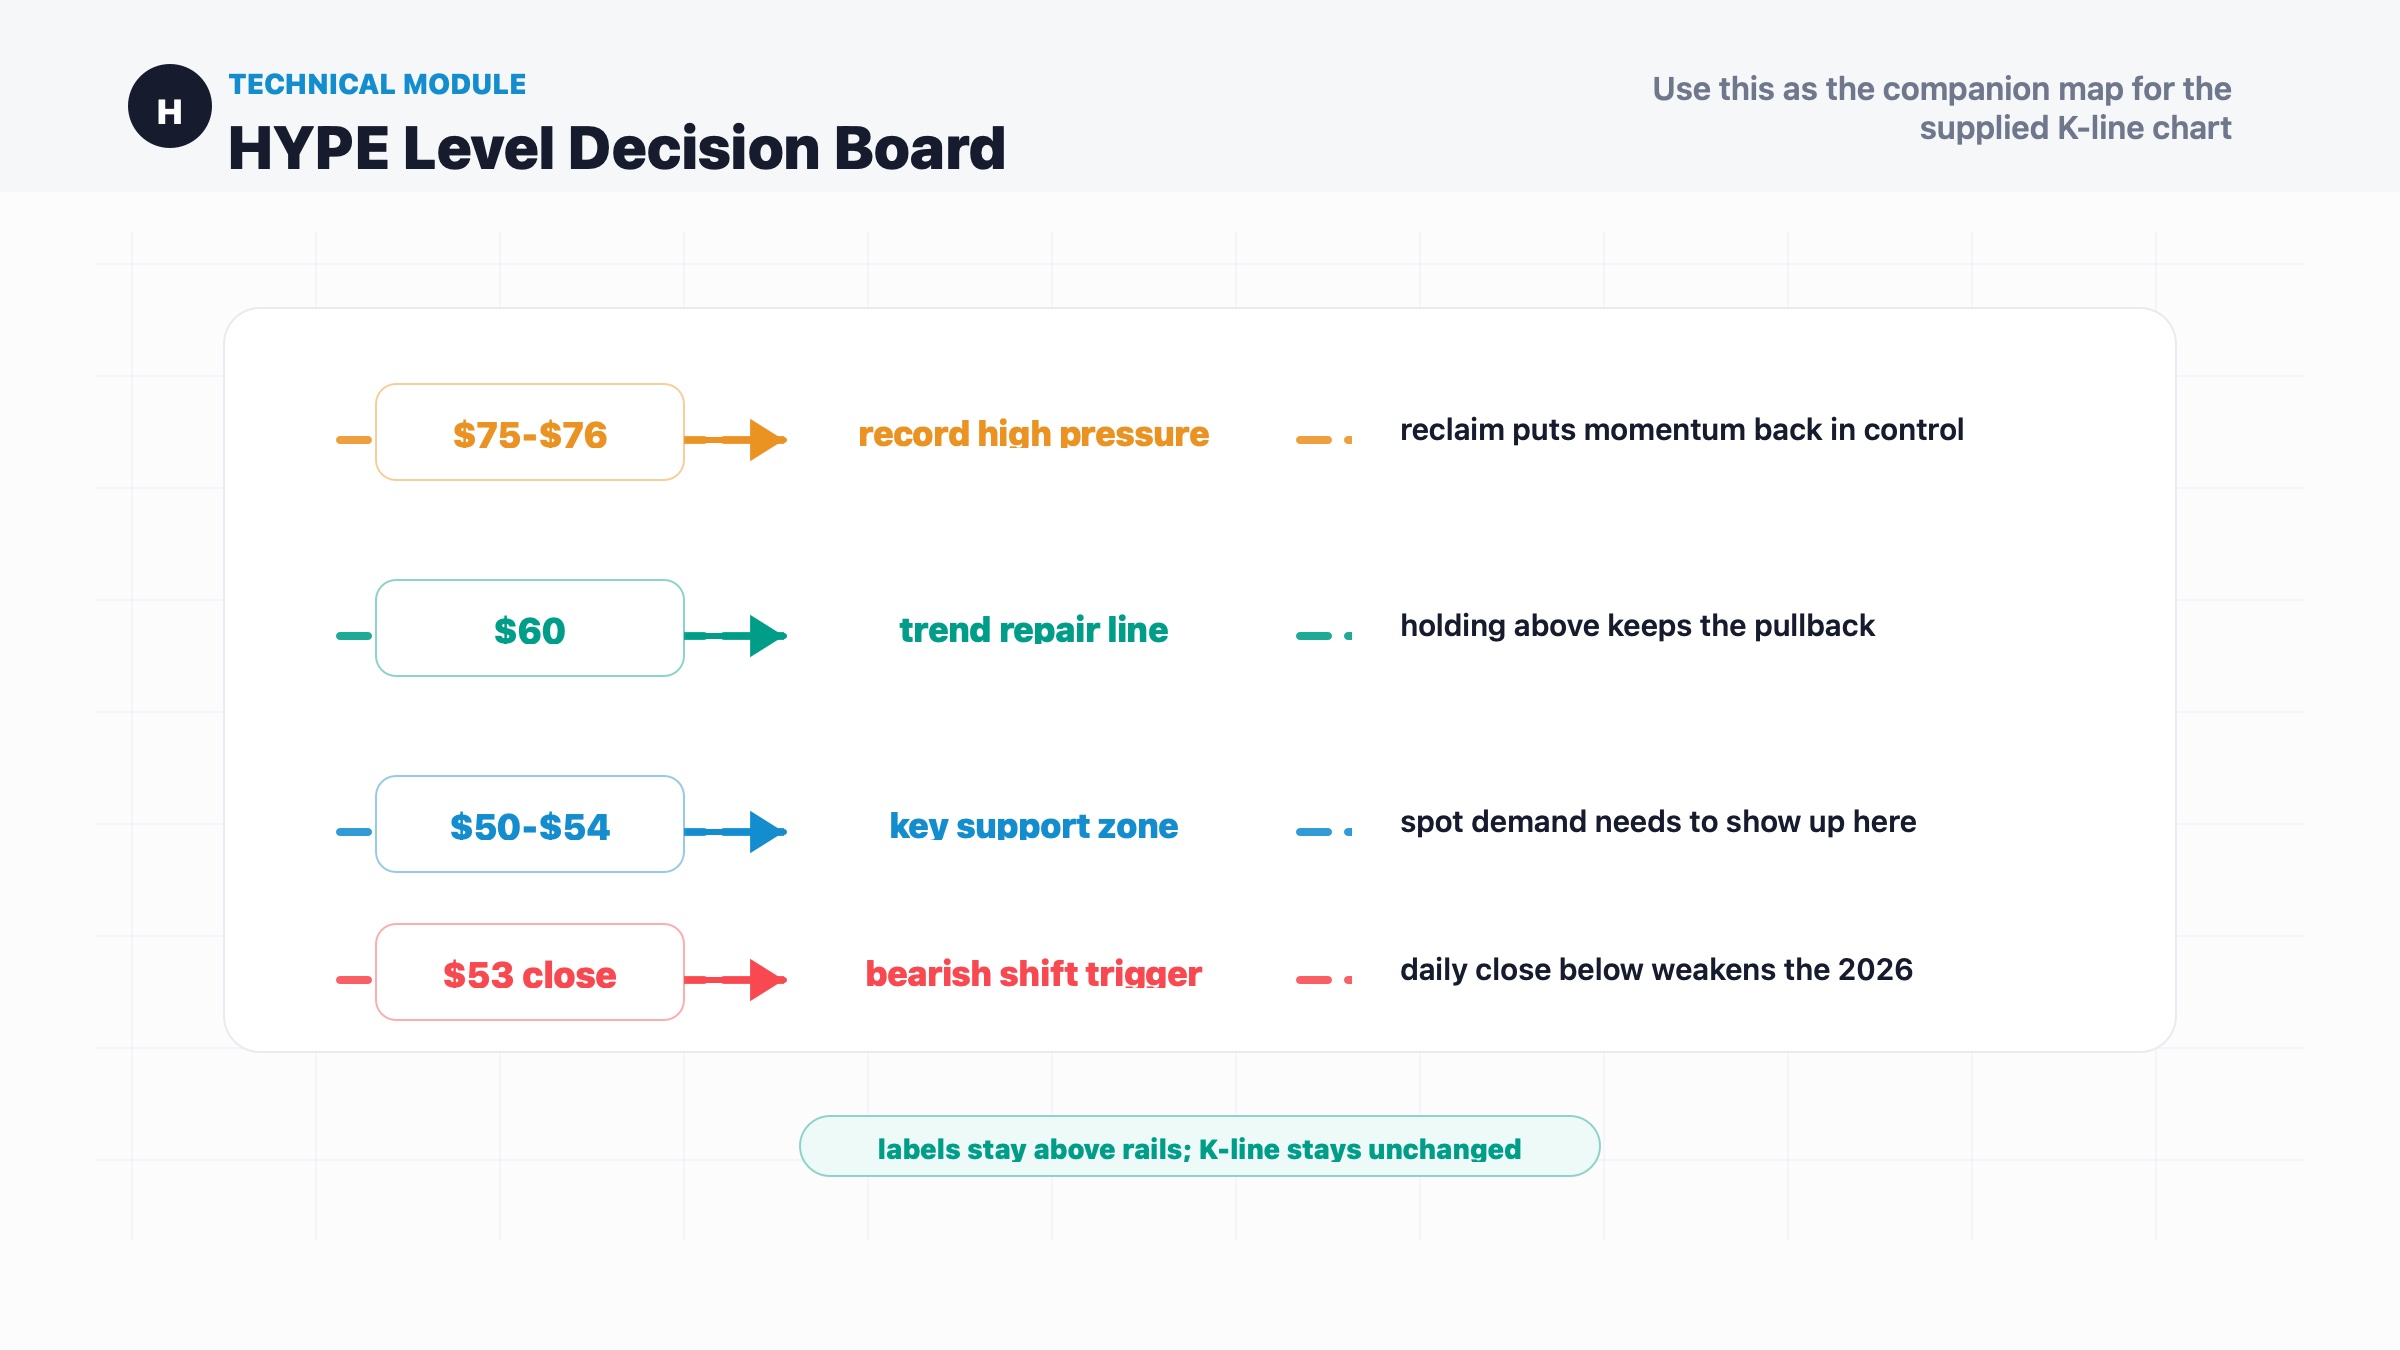
$75-$76: Record high pressure. A reclaim would put momentum back in control.
$60: Trend repair line. Holding above it keeps the current pullback from becoming a deeper structural problem.
$50-$54: Key support zone. This is where spot demand needs to show up if the 2026 uptrend is still intact.
$53 daily close: Bearish shift trigger. A close below this level would weaken the higher-high, higher-low structure that has defined the year.
$38: Deeper support area if the $50-$54 zone fails and traders start pricing a larger retracement.
Conditional Forecast
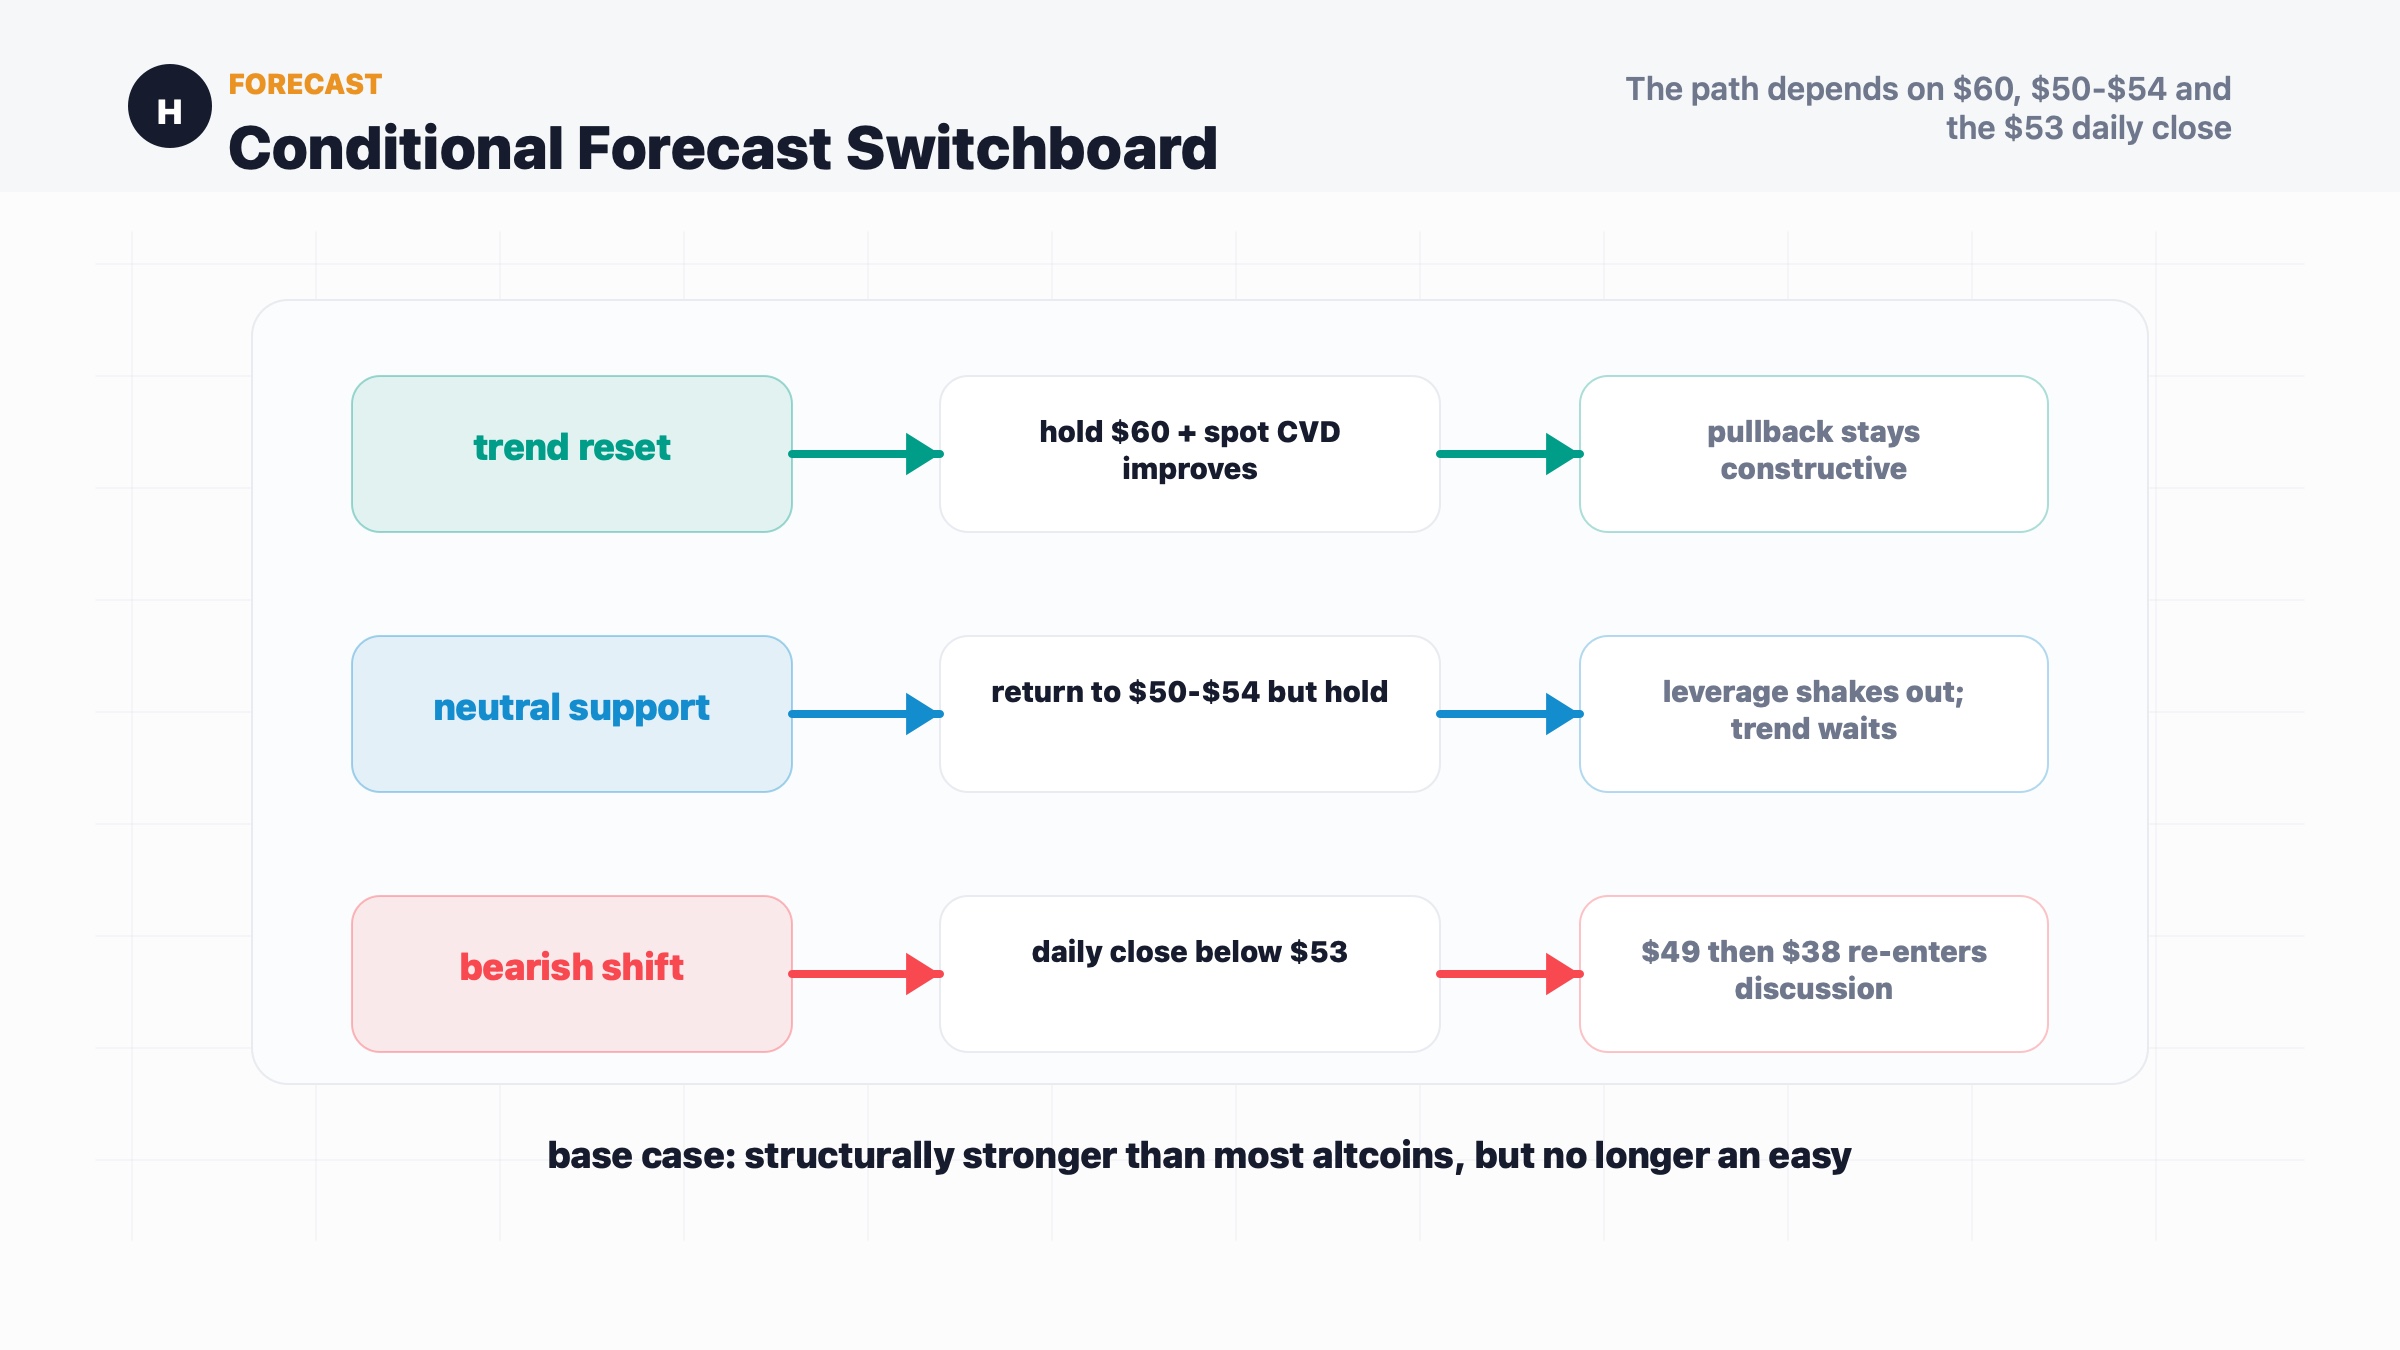
If HYPE holds above $60 and spot CVD continues improving, the pullback can still resolve as a healthy reset. In that scenario, the market would likely treat the move from $75-$76 as a cooling phase, not a trend failure.
If HYPE drifts back into $50-$54 but holds that zone on daily candles, the setup becomes more neutral. It would be ugly enough to shake out leverage, but still constructive enough to preserve the broader 2026 trend.
If HYPE closes below $53, the market's interpretation changes. That would turn the support test into a structural warning and put the lower fair-value-gap area near $49, then the broader $38 support region, back into the conversation.
The base case is mixed: HYPE is still structurally stronger than most altcoins, but the easy upside phase has ended. From here, the chart needs proof, not applause.
Investment Takeaway
HYPE is still one of the more interesting altcoin charts, but it is no longer a clean momentum chase.
The useful question is not "Is Hyperliquid a strong story?" It probably is. The useful question is whether that story is still attracting enough spot demand after a crowded rally and a 22% pullback.
For traders, $60 is the first line. $50-$54 is the real exam. Below $53 on a daily close, caution becomes more than a personality trait; it becomes the chart's message.
For investors, the takeaway is similar but slower: strong projects can still have bad entries. HYPE's long-term story may remain intact, but the market is now asking buyers to prove it at support instead of assuming the next high is automatic.
Sources
- Cointelegraph: HYPE down 22% from record highs: Will spot demand revive the uptrend? (https://cointelegraph.com/markets/hype-down-22-from-record-highs-can-spot-demand-retain-the-uptrend)
- TradingView: HYPEUSD daily chart (https://www.tradingview.com/chart/?symbol=HYPEUSD&interval=1D)
- Velo: Crypto market data platform (https://velo.xyz/)
- Hyperliquid: Official site (https://hyperliquid.xyz/)
|
DISCLAIMER:
1. All content on this website (including but not limited to articles, data, charts, and analyses) is for general informational purposes only and does not constitute any form of investment advice, trading recommendation, or financial guidance. 2. Cryptocurrencies and digital assets are subject to extreme price volatility and high investment risk; you may lose part or all of your principal. Past performance does not predict future results. 3. The information on this website is based on sources we believe to be reliable, but we do not guarantee its accuracy, completeness, or timeliness. Any investment decisions made based on this website’s information are at your own risk. 4. We strongly recommend that you conduct your own thorough research and consult an independent, licensed financial advisor before making any investment decisions. |
Recommended reading
Latest News