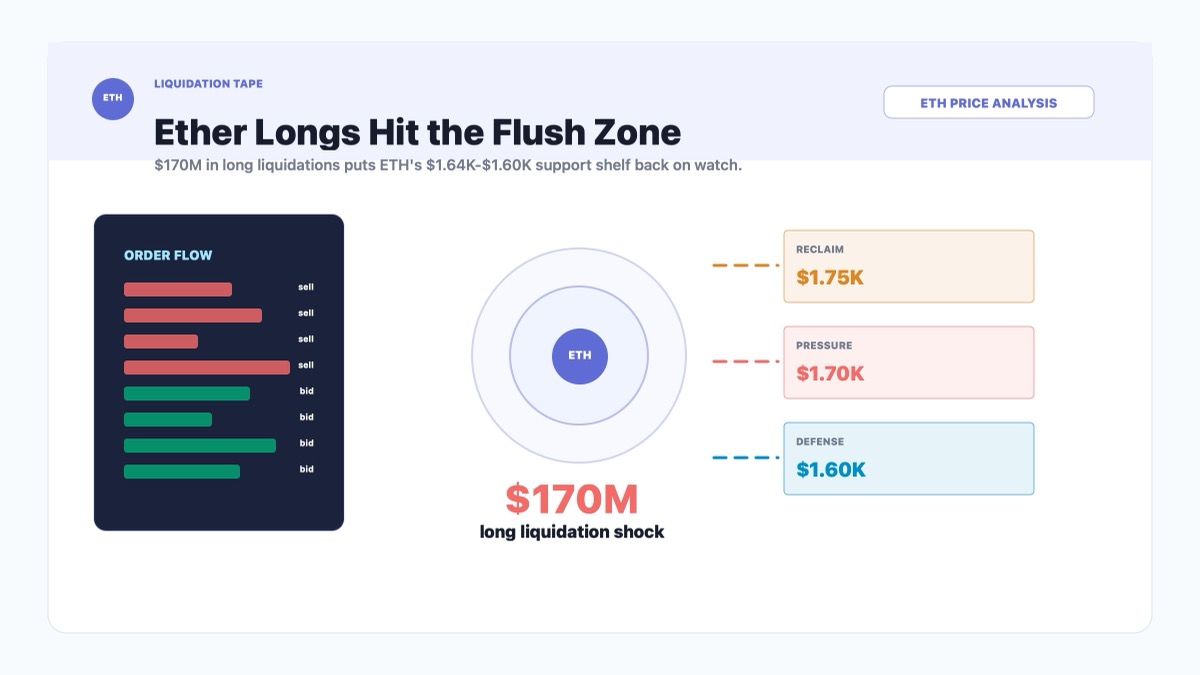
The tempting version of this story is simple: companies are buying ETH, therefore ETH should go up.
The market is giving us the less comfortable version. Companies are buying ETH, yes. But the larger door is still the exit door. Spot Ether ETFs are leaking capital, Ethereum network revenue is soft, and the chart is sitting near the kind of support level that makes traders stop talking about the long-term thesis and start staring at the next candle.
That is the useful frame here: BitMine and Sharplink buying ETH matters, but it does not automatically control the price. Treasury accumulation is a bid. ETF outflows are a sell pressure channel. The question is which pipe is wider.
Key Takeaways
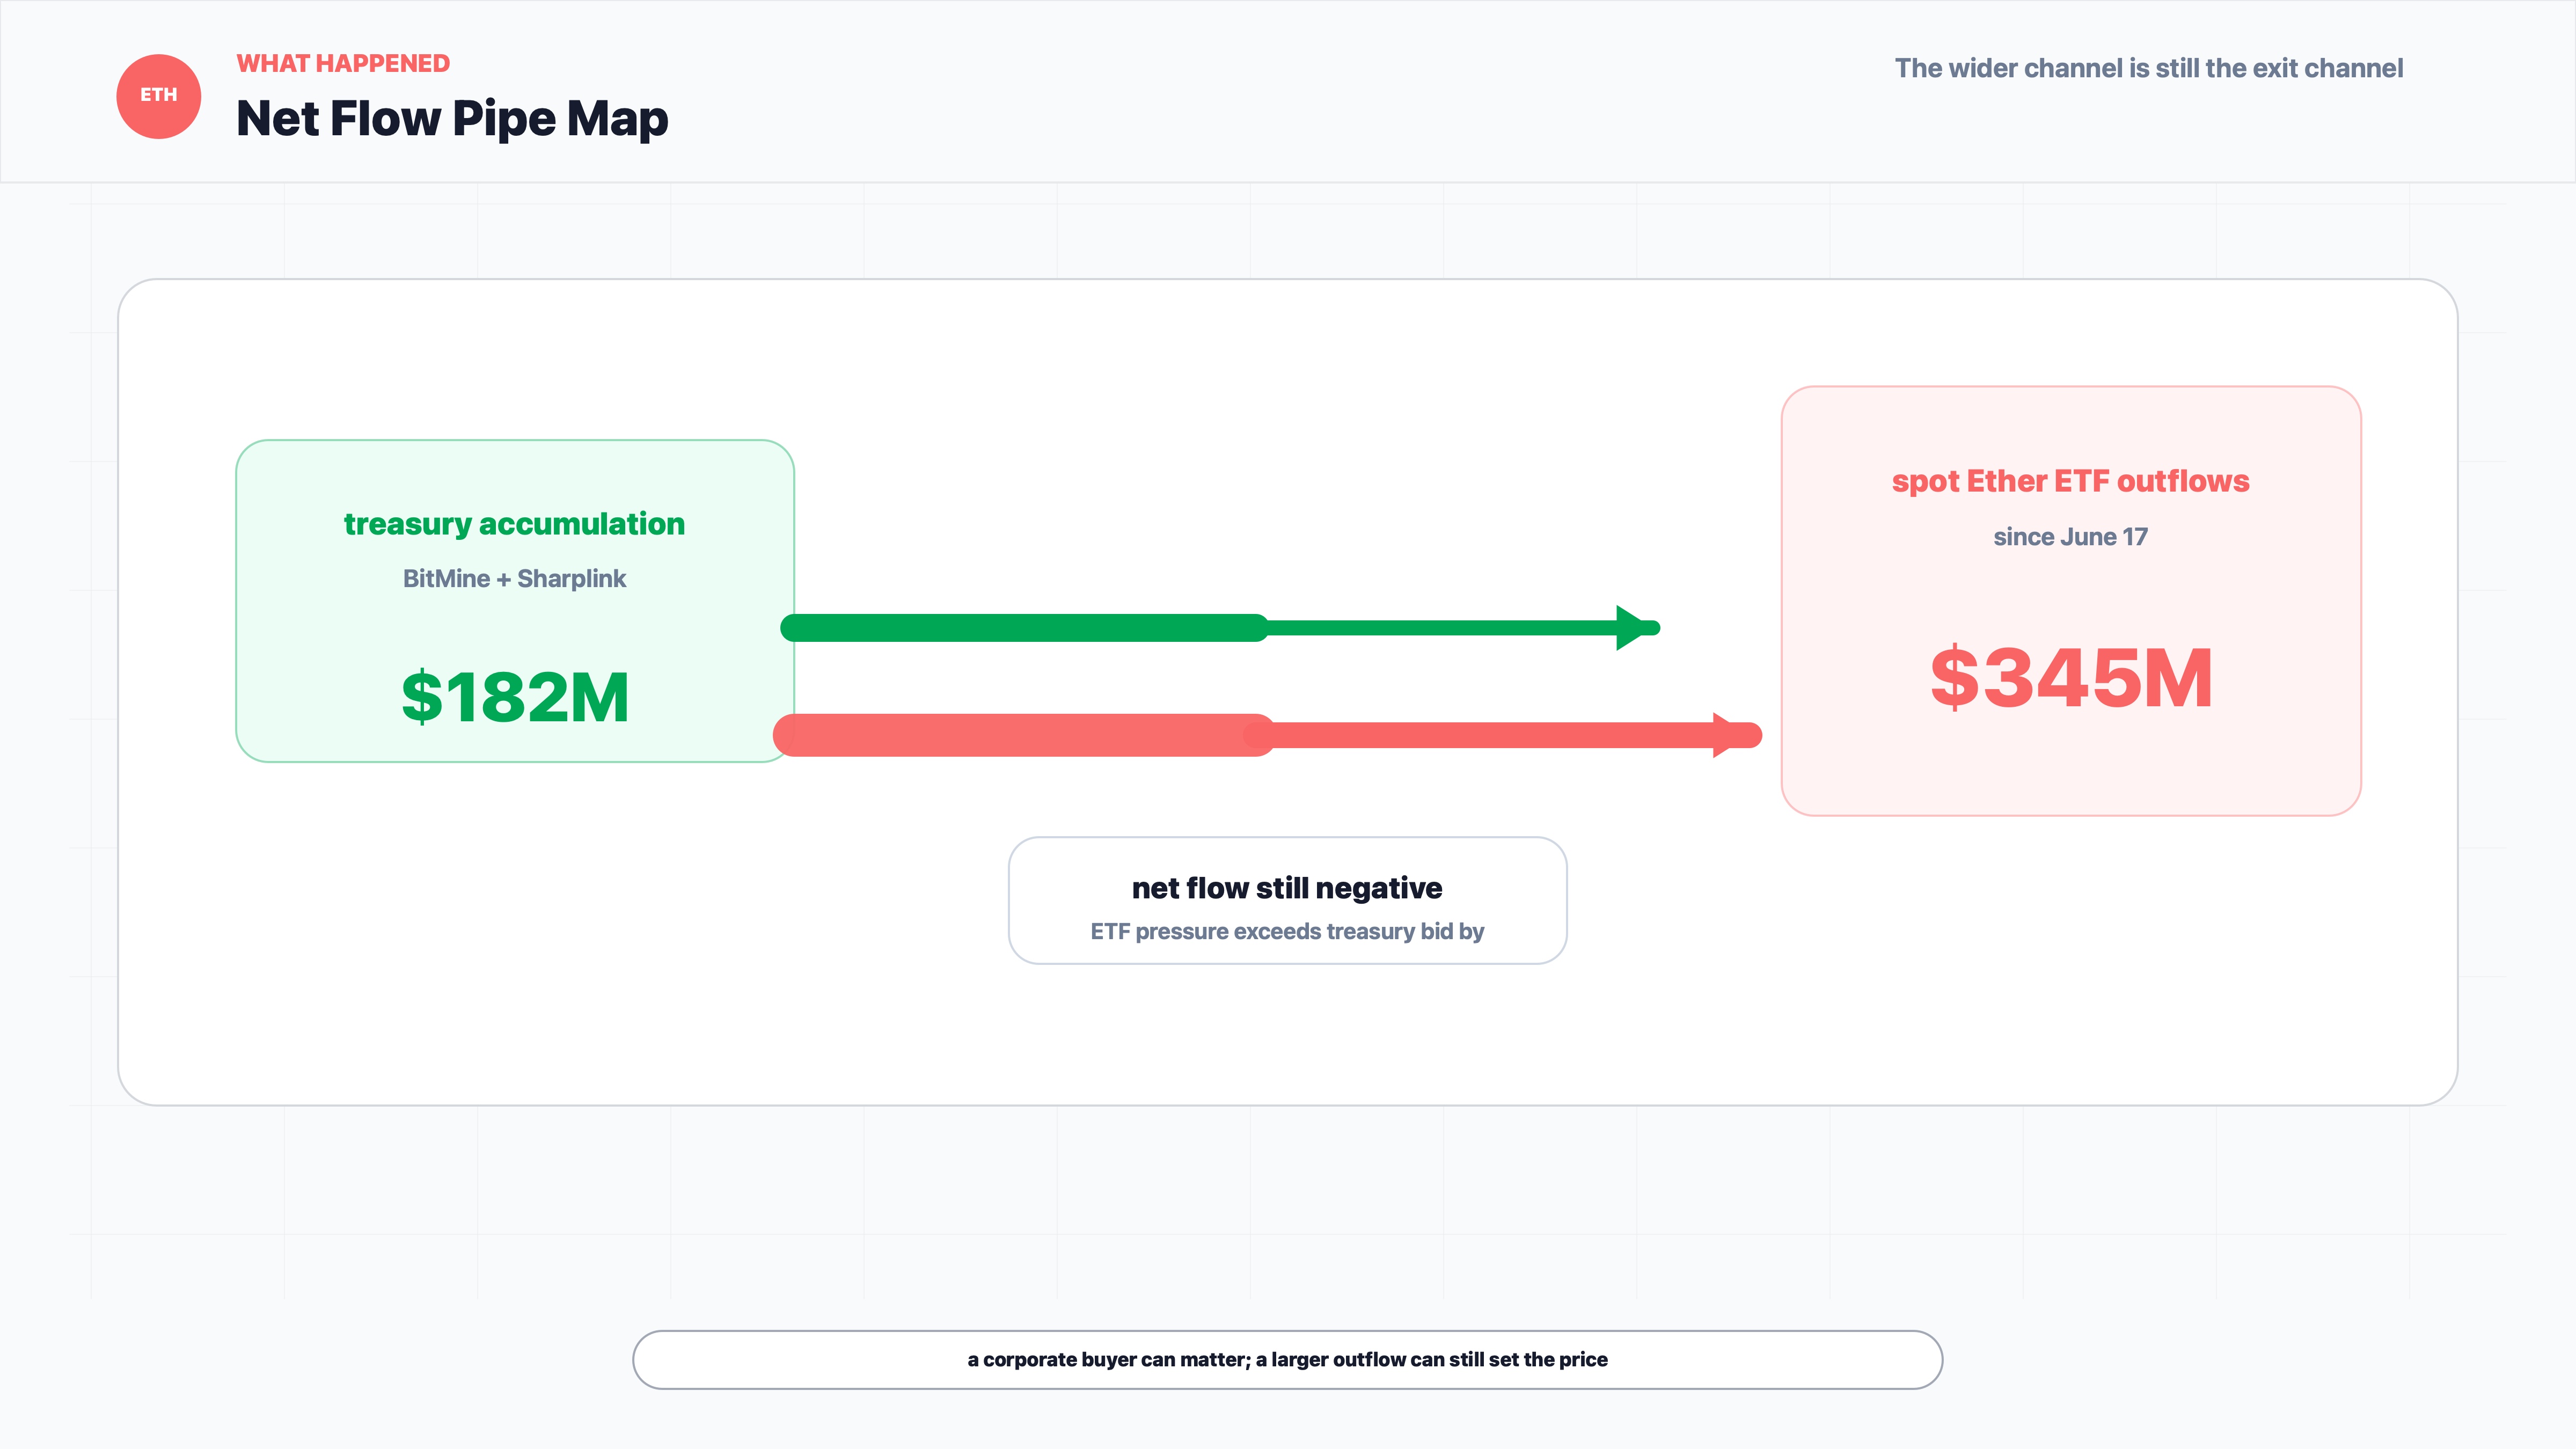
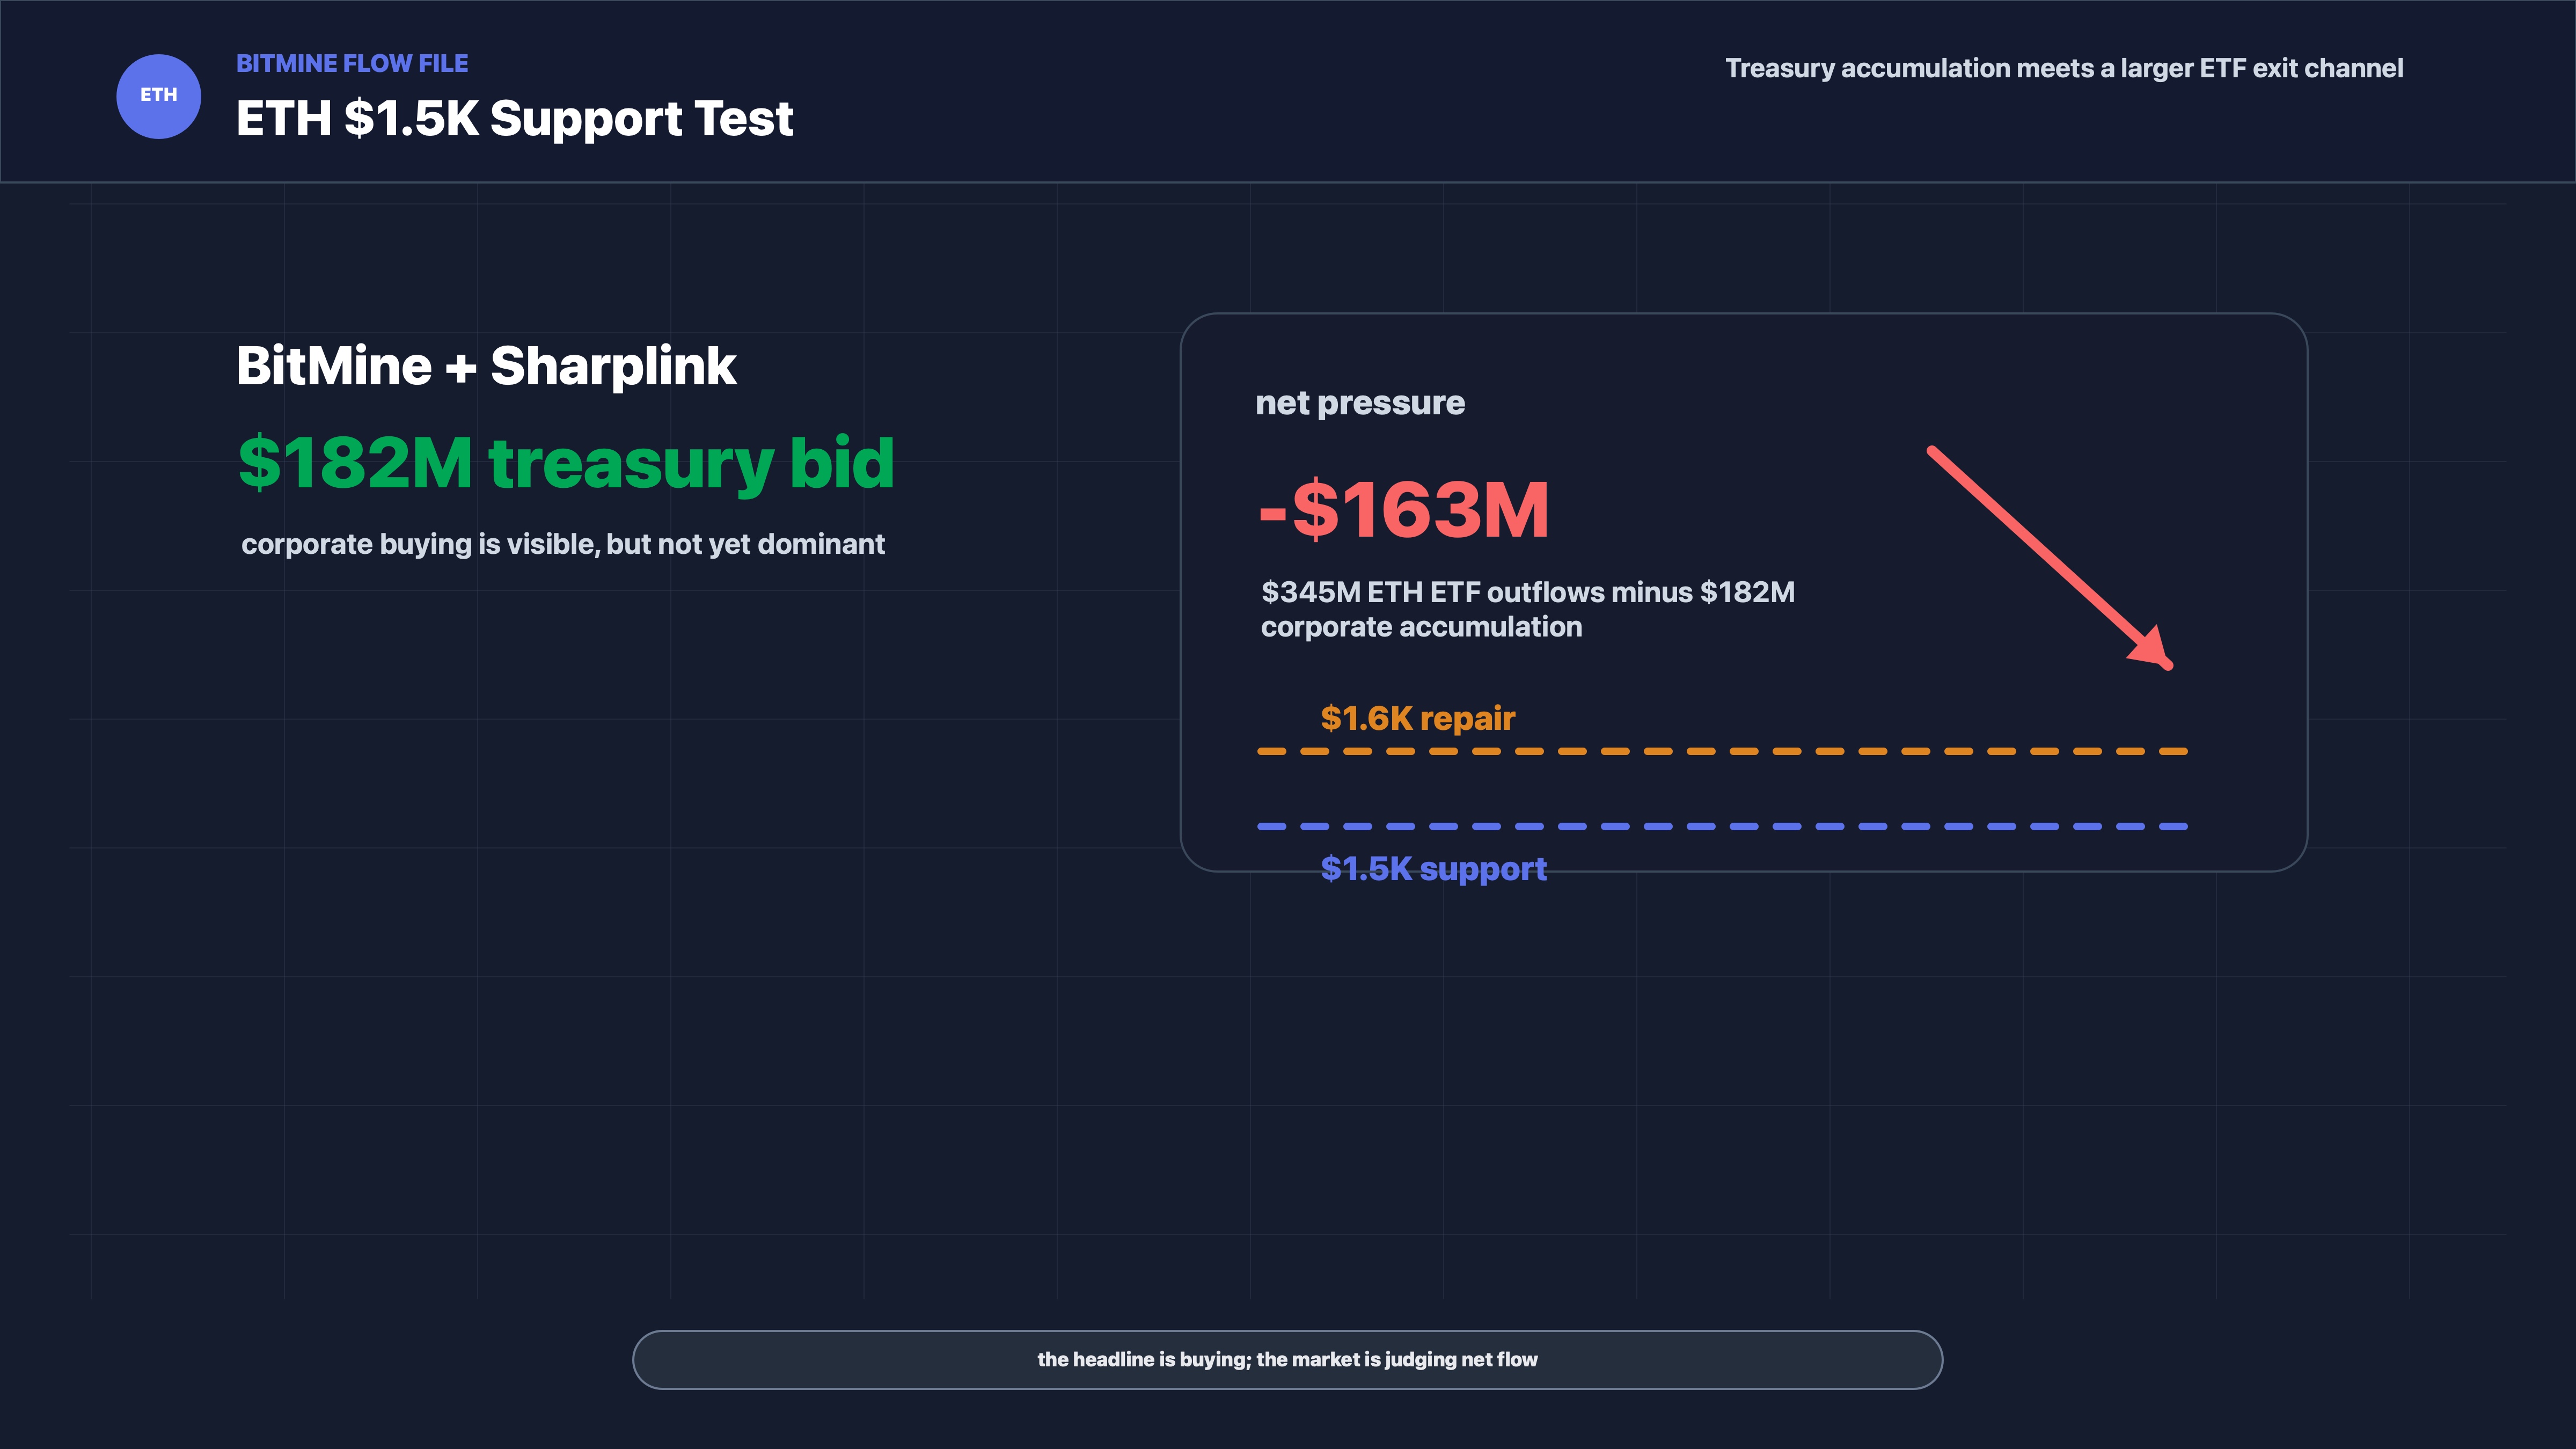
- Cointelegraph reported that US-listed spot Ether ETFs saw $345 million in net outflows since June 17, more than offsetting $182 million in ETH accumulation from BitMine and Sharplink over the same period.
- ETH has failed to hold above $1,600, while traders are watching whether the $1,500 support area can survive another test.
- Ethereum still has a real long-term tokenization and RWA story, but June network fees, DApps revenue and staking yields are not yet showing enough demand to rescue the near-term chart.
- The market needs a clean reclaim of $1.6K before the treasury-buying story can look like trend repair rather than a buyer trying to slow a falling tape.
What Happened
Cointelegraph's Marcel Pechman reported that BitMine's ETH accumulation was being overshadowed by a much larger pressure point: spot Ether ETF outflows. Ether had failed to sustain prices above $1,600 since Thursday, and traders were increasingly focused on whether the $1,500 support level would hold.
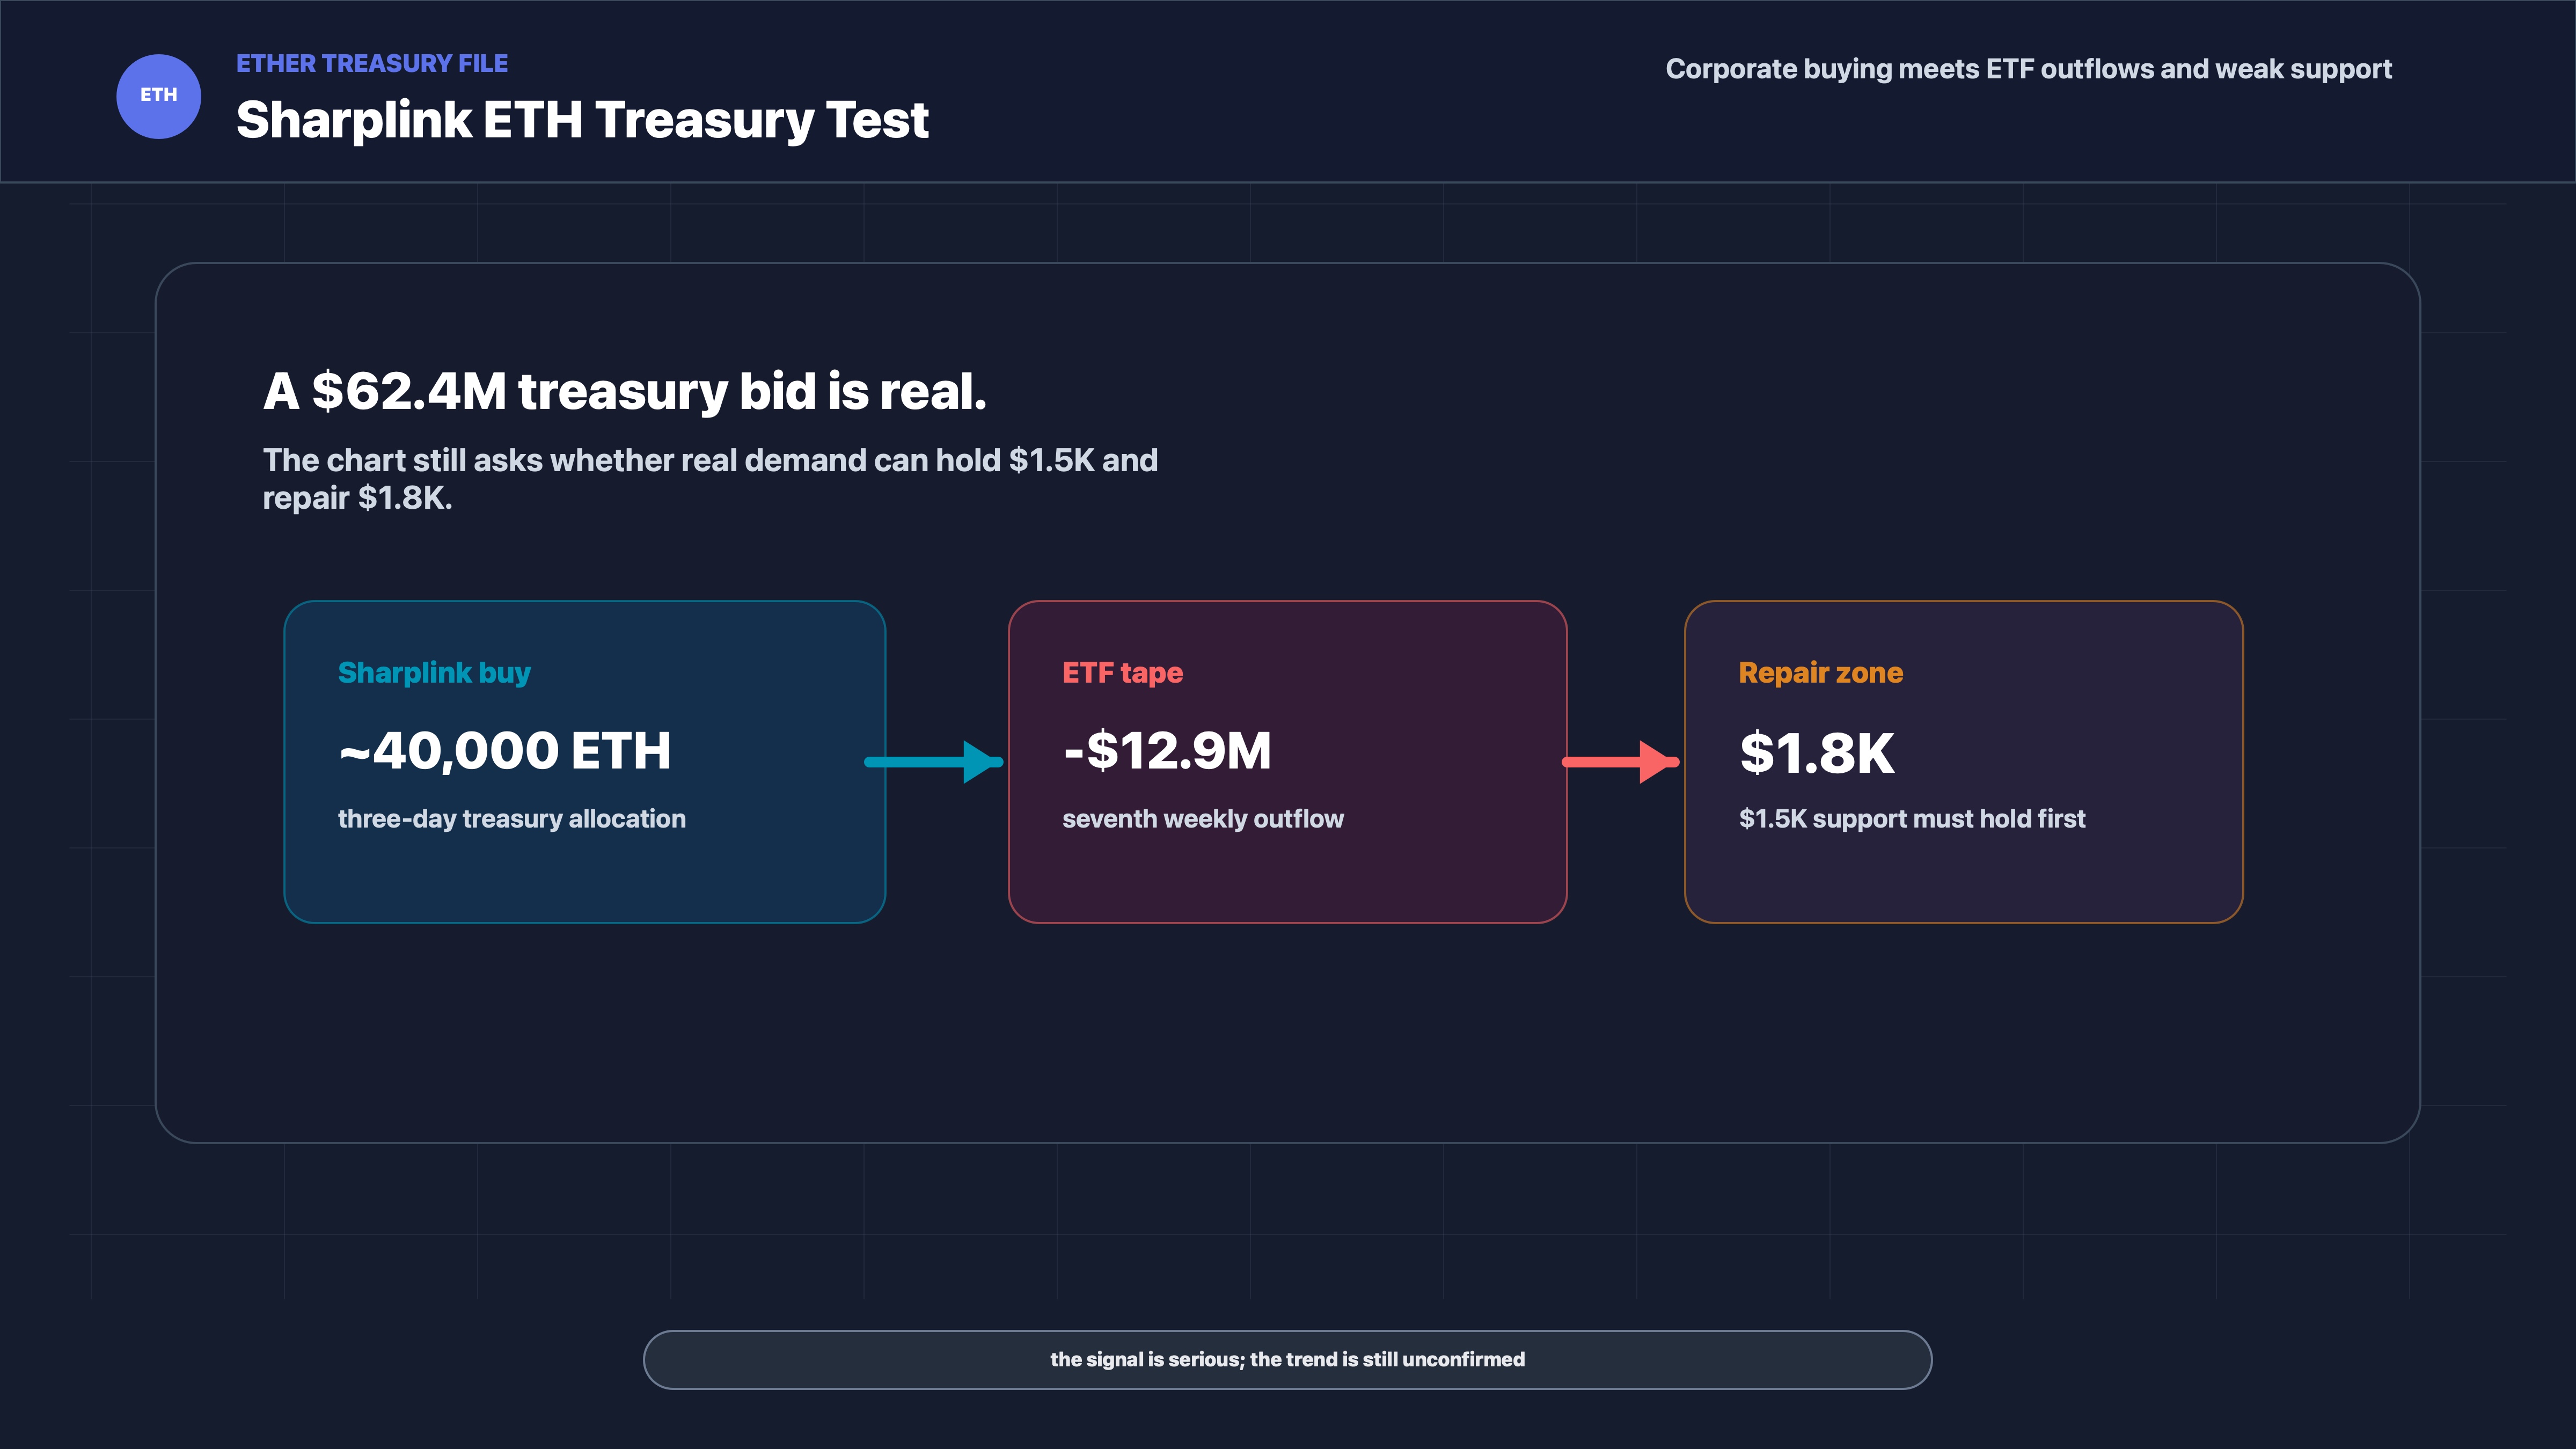
The numbers explain the tension. According to the article, US-listed spot Ether ETFs recorded $345 million in net outflows since June 17. During the same period, BitMine Immersion and Sharplink accumulated about $182 million worth of ETH. That is not a small corporate bid, but it is smaller than the ETF outflow.
This is where the story gets less heroic. A treasury buyer can create a headline. ETF outflows create a flow-of-funds problem. If one set of buyers is adding $182 million while another channel is removing $345 million, the market does not have to applaud the buyer. It can do the math.
The article also pointed to a broader weakness in ETH's market setup. Ether was down 31% since May and had underperformed the total crypto market capitalization by 8% over that period. That matters because ETH was not merely lagging its own idealized story. It was lagging the broader crypto basket.
Why This Matters for Bitcoin and Crypto Markets
Ethereum is often sold to investors as the place where the future gets financial plumbing: tokenized assets, DeFi, stablecoins, staking, application revenue, and settlement for things that do not want to live in traditional databases.
That story is not fake. It is just not the same thing as a bid today.
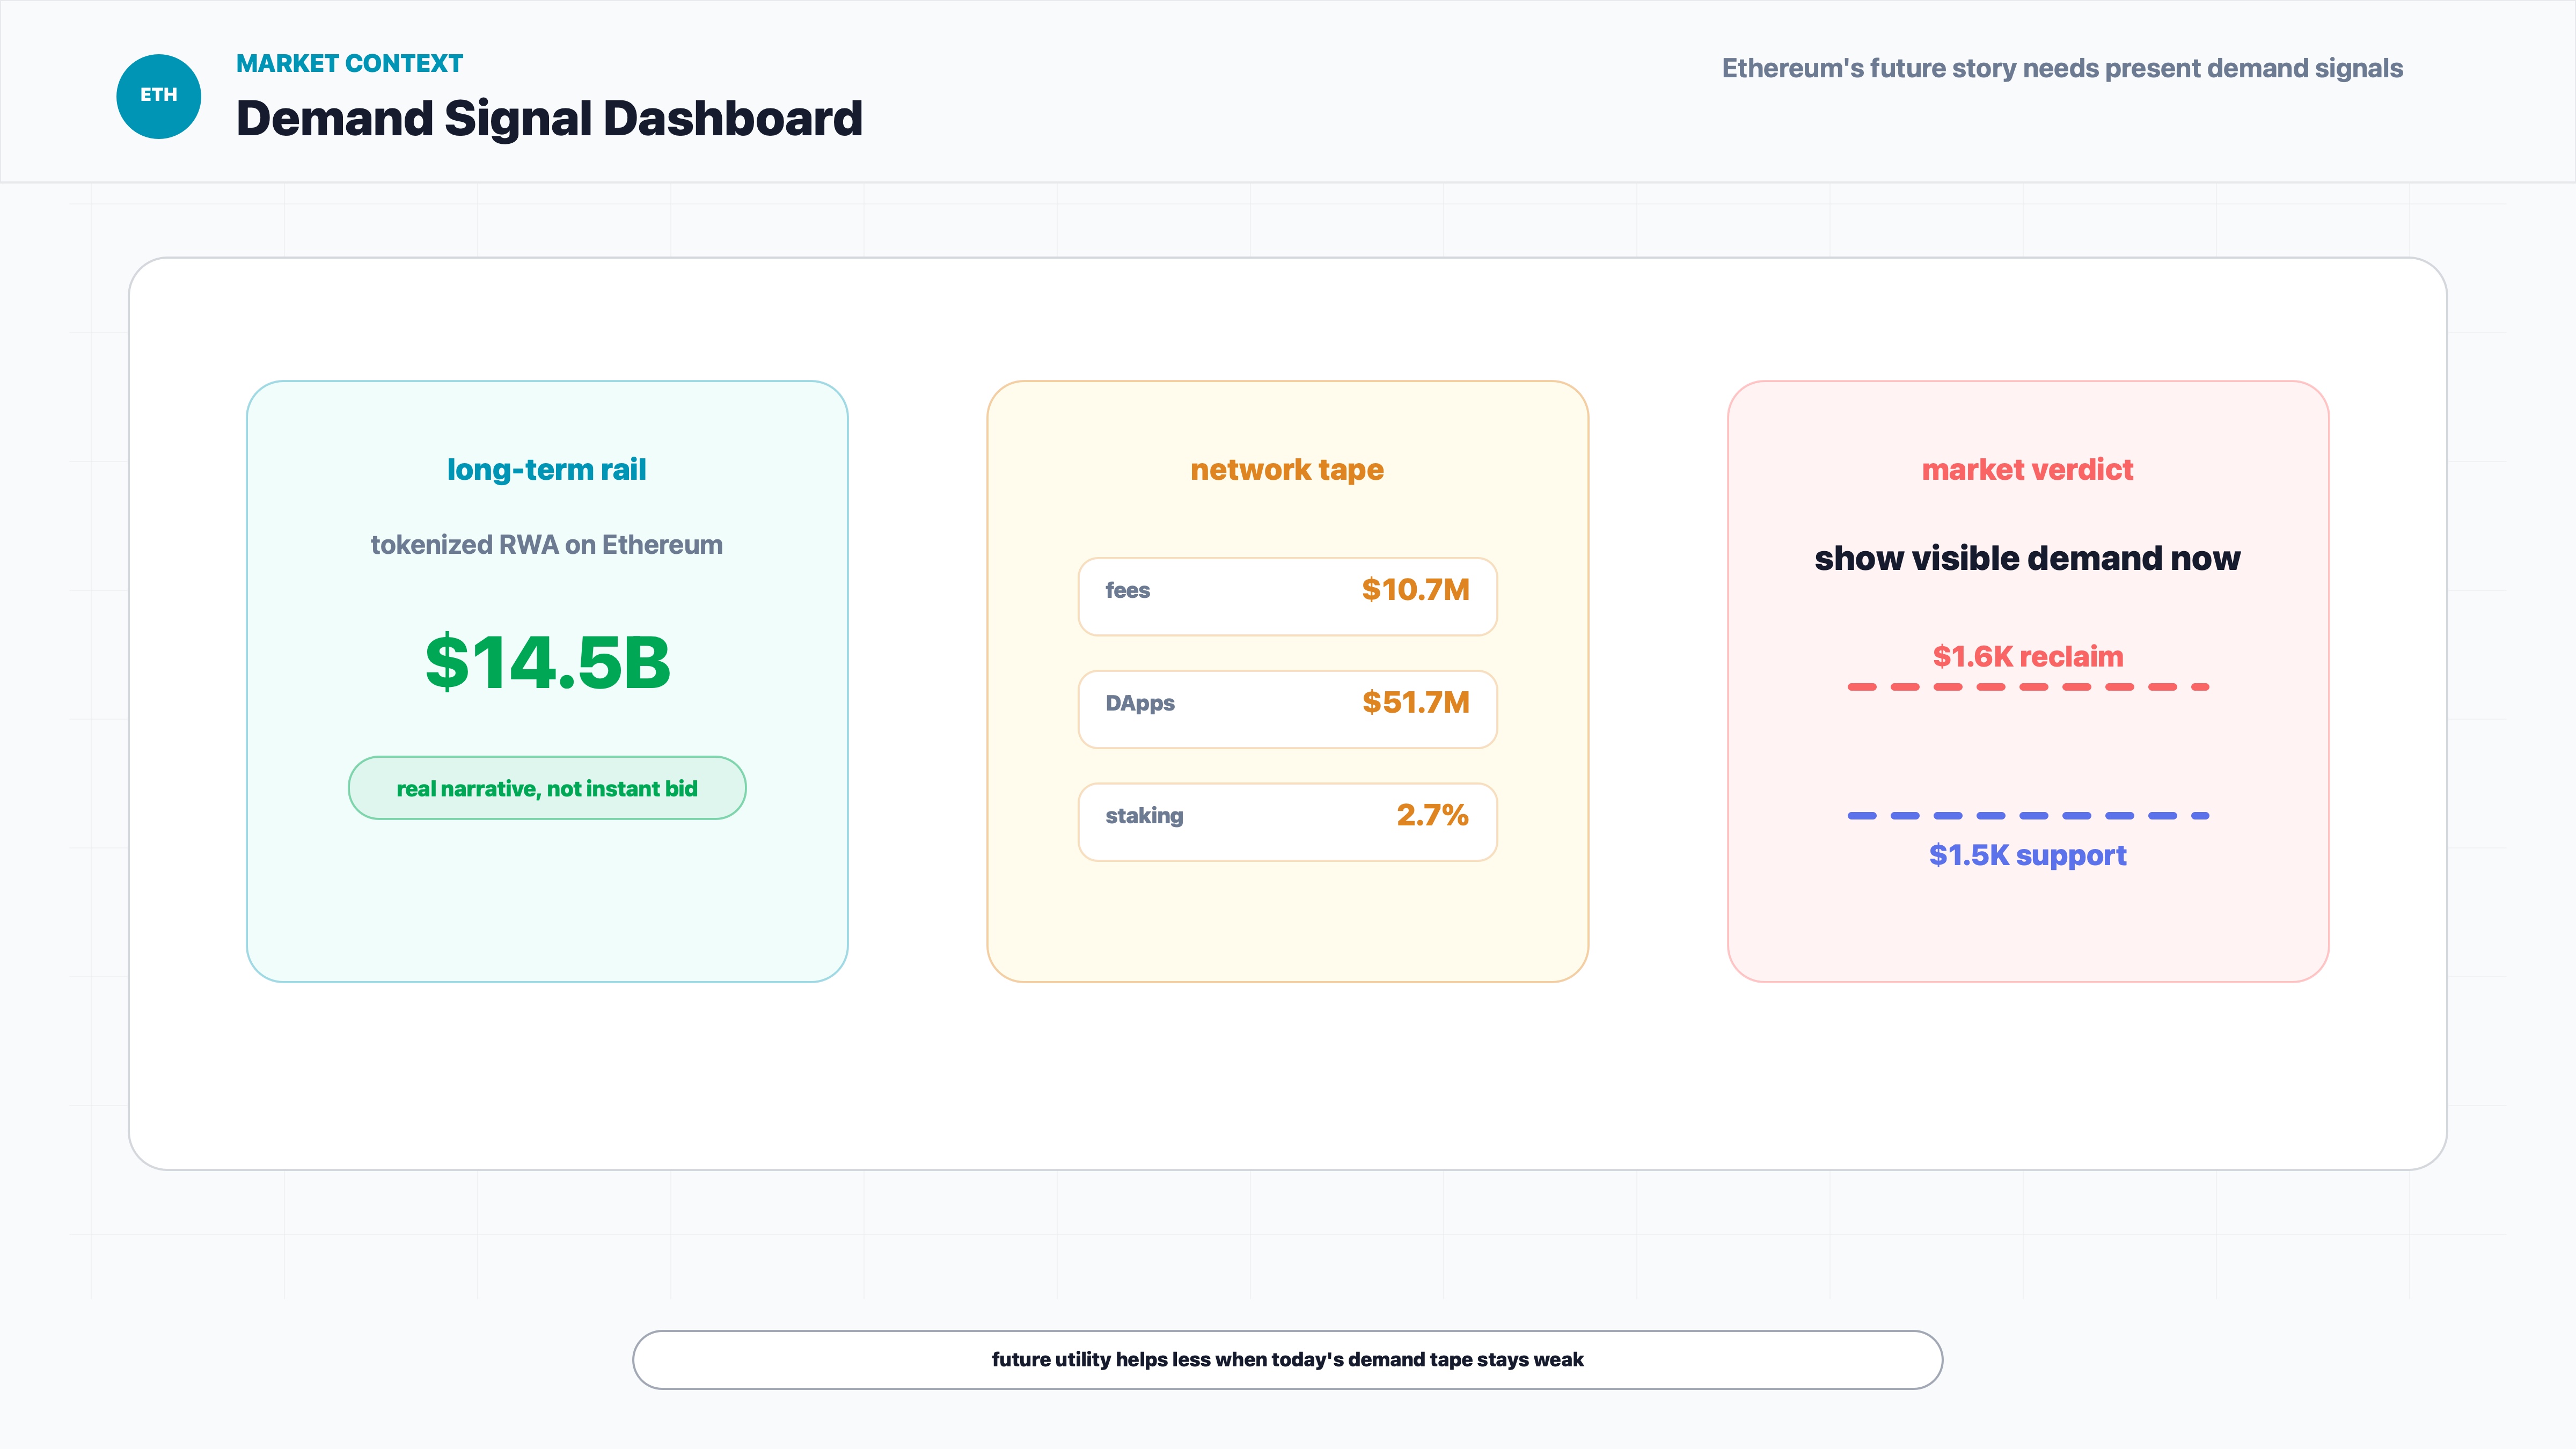
The current ETH problem is a timing problem. Long-term Ethereum supporters can point to tokenization and real-world assets. Cointelegraph cited $14.5 billion in tokenized RWA market capitalization on Ethereum. That sounds impressive, and in structural terms it is. But if the activity does not yet translate into stronger fees, stronger DApps revenue or a clear premium for holding ETH, traders can treat it as a future story parked next to a present price problem.
That distinction matters for Bitcoin and the wider crypto market because capital is choosing between narratives. Bitcoin has the "hard money and ETF benchmark" story. AI equities have the "earnings and infrastructure spend" story. Ethereum has the "programmable settlement and tokenization" story. When risk appetite is strong, investors may fund all of them. When it tightens, they ask a less romantic question: which asset is producing visible demand right now?
For ETH, the recent answer has been awkward. Ethereum network fees reportedly reached only $10.7 million in June, down from $24.4 million in April. DApps revenue fell to $51.7 million from $64.8 million two months earlier. Staking yield near 2.7% is not nothing, but it is not enough by itself to make investors ignore ETF outflows and a weak chart.
So the market is not rejecting Ethereum as an idea. It is refusing to pay full price for the idea before the cash-flow-like signals improve. Different problem. Same red candles.
Historical Parallel
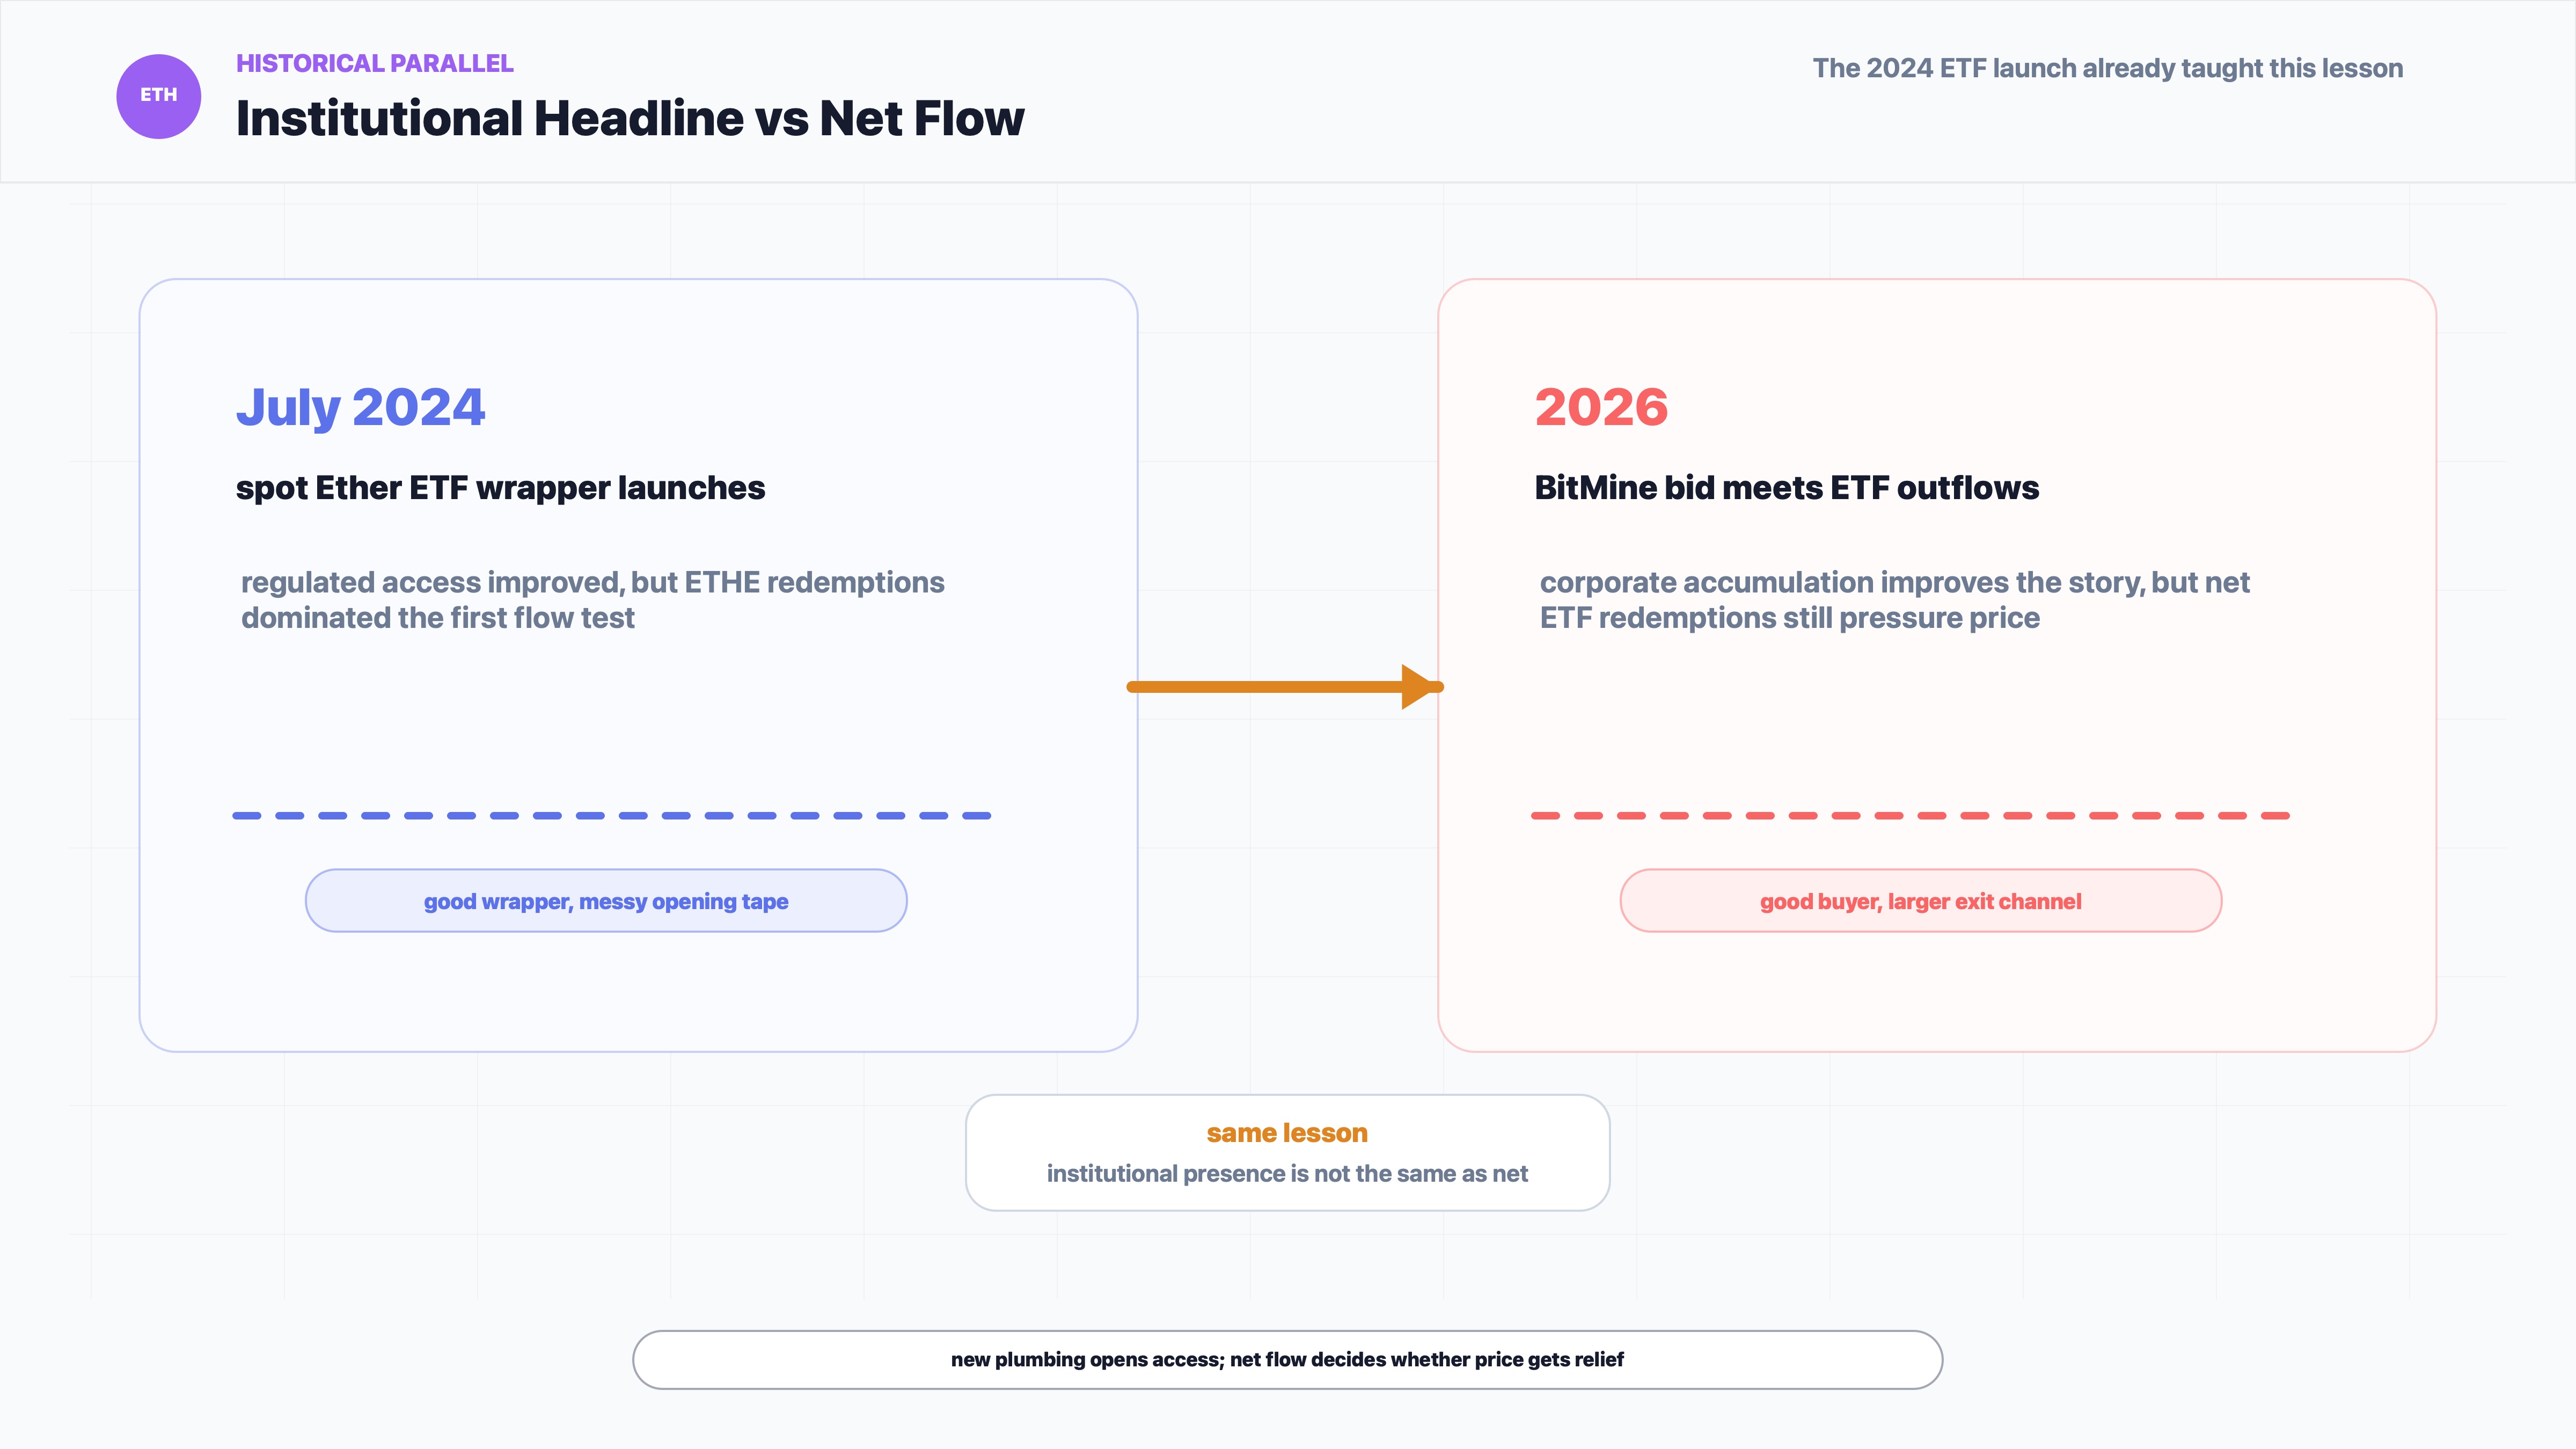
A useful comparison is the launch of US spot Ether ETFs in July 2024. At the time, the simple headline was bullish: ETH finally had a regulated ETF wrapper, which meant traditional investors had an easier way to get exposure. That was the official story, and it was not wrong. The plumbing improved.
But the first market reaction was messier. Grayscale's converted Ethereum Trust, ETHE, saw heavy outflows after the products launched, while inflows into newer spot Ether ETFs were not enough to fully absorb that selling pressure at first. Investopedia reported positive first-day net inflows for the new group of spot Ether ETFs, but also noted large ETHE outflows on that same opening day. Crypto Briefing later reported that Grayscale ETHE outflows had topped $1.5 billion during the first week, leaving the broader ETF complex under pressure.
The similarity to the current BitMine story is the mechanism. In both cases, investors had a good institutional adoption headline, but the market cared more about net flow. A new wrapper, a corporate treasury buyer or a respected institutional participant can all improve the story. None of them repeals arithmetic. If forced sellers, ETF redemptions or legacy holders are larger than the new bid, price can still fall.
The difference is also important. The 2024 ETF episode was largely a launch-structure problem: a converted trust with fees, legacy holders and redemption pressure. Today's setup is broader. It is not only ETF mechanics. It is also weaker Ethereum fees, softer DApps revenue, low staking yield, regulatory uncertainty around the CLARITY Act, and competition for investor attention from AI and equities.
The lesson for today's BTC and ETH judgment is blunt: institutional presence is not the same as institutional demand. The signal to watch is not who is buying in a press release. It is whether the net flow and the chart confirm that the buying is large enough to matter.
Ethereum Price Reaction and K-Line Analysis
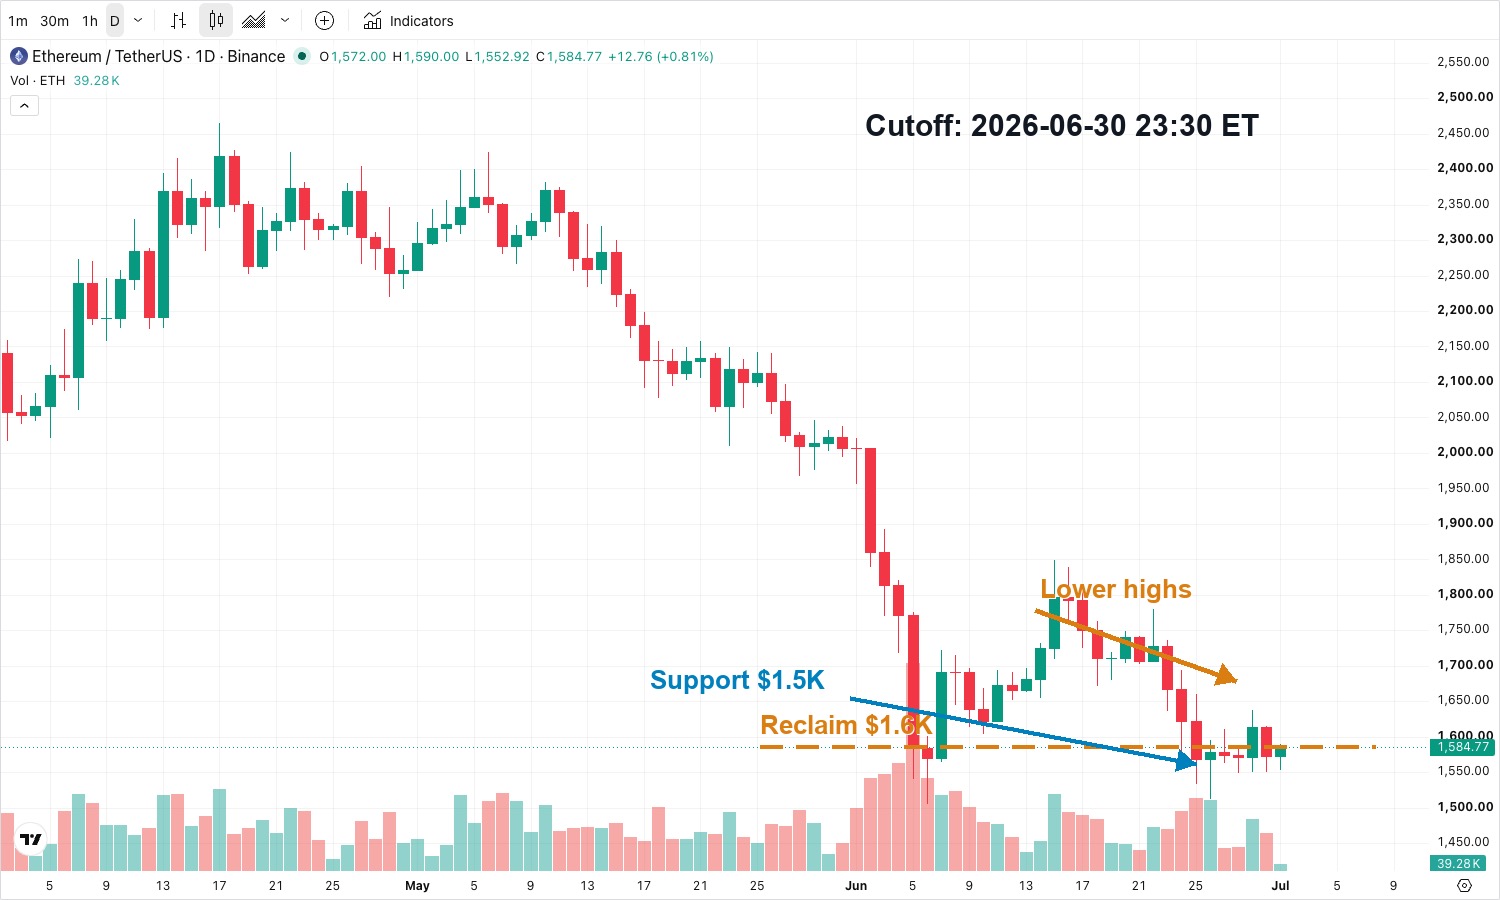
ETHUSDT's daily chart shows a market that has not earned the right to sound optimistic yet. The April-to-May area held a much higher range, but the June breakdown changed the conversation. After the sharp early-June selloff, ETH bounced, failed to rebuild a higher range, and then rolled back toward the $1.5K support zone.
The important chart detail is not merely that ETH is near $1,500. It is how it got there. The recovery attempt into mid-June produced lower highs, which means buyers were able to create rallies but not a new structure. That is a different thing from strength. It is more like the market standing up, looking around, and sitting down again.
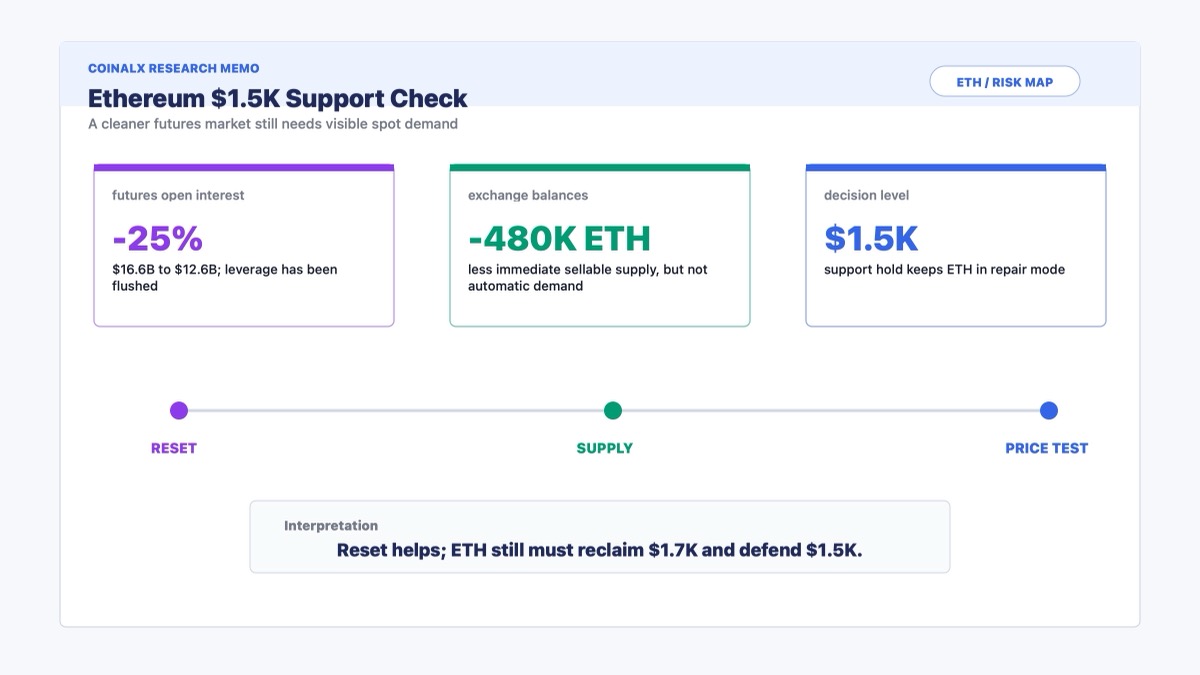
The first repair level is $1.6K. A clean daily reclaim above that area would not make the whole Ethereum thesis bullish again, but it would show that buyers can at least absorb the latest pressure. Until that happens, the $1.5K area is less a foundation than a line being repeatedly tested.
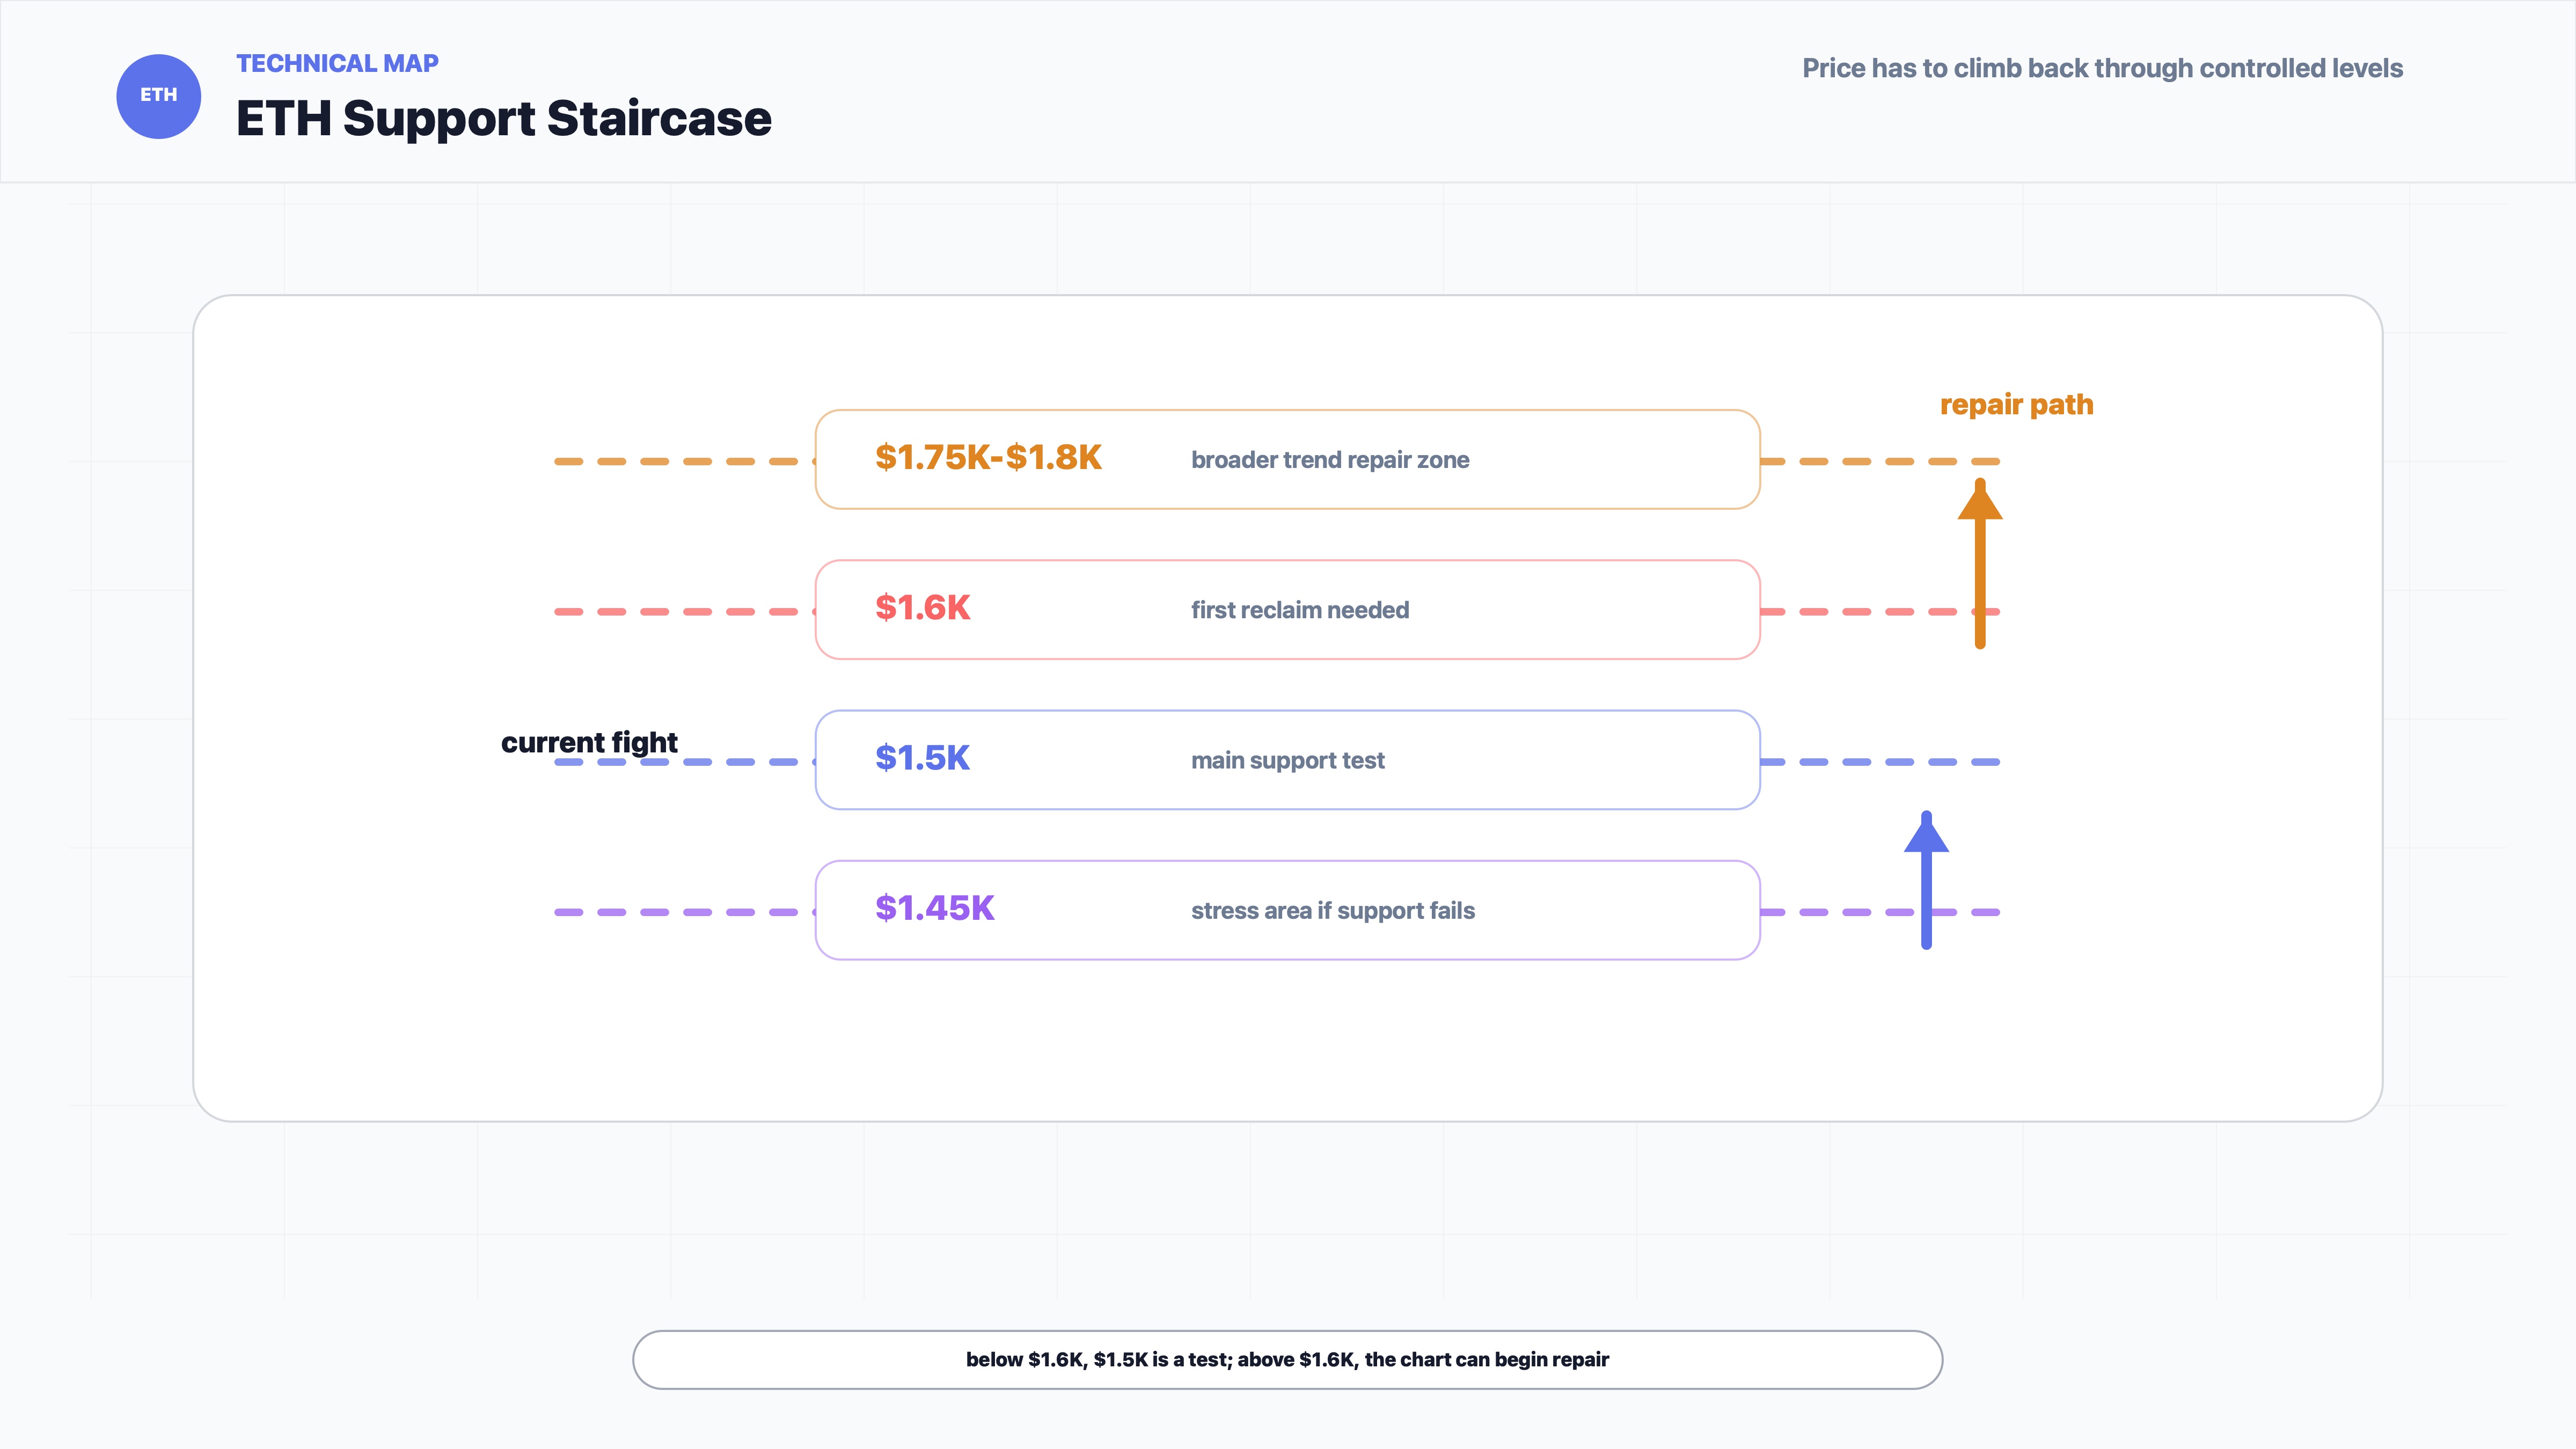
The chart also fits the news. A corporate treasury bid should matter most when price is already stabilizing. Here, the chart is still asking for proof. If ETH cannot reclaim $1.6K while ETF outflows continue, traders may assume that BitMine and Sharplink are cushioning the market rather than reversing it.
Key Levels to Watch
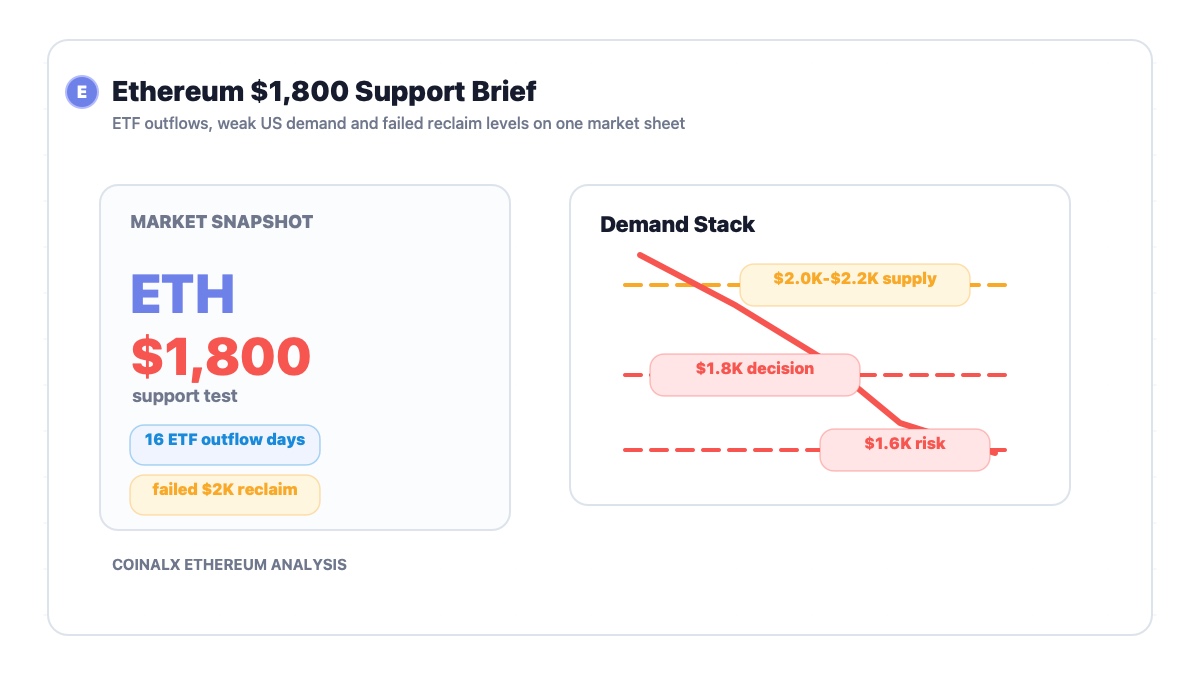
- $1.6K: The first repair level. ETH needs to reclaim and hold this area before the chart can stop looking like a failed rebound.
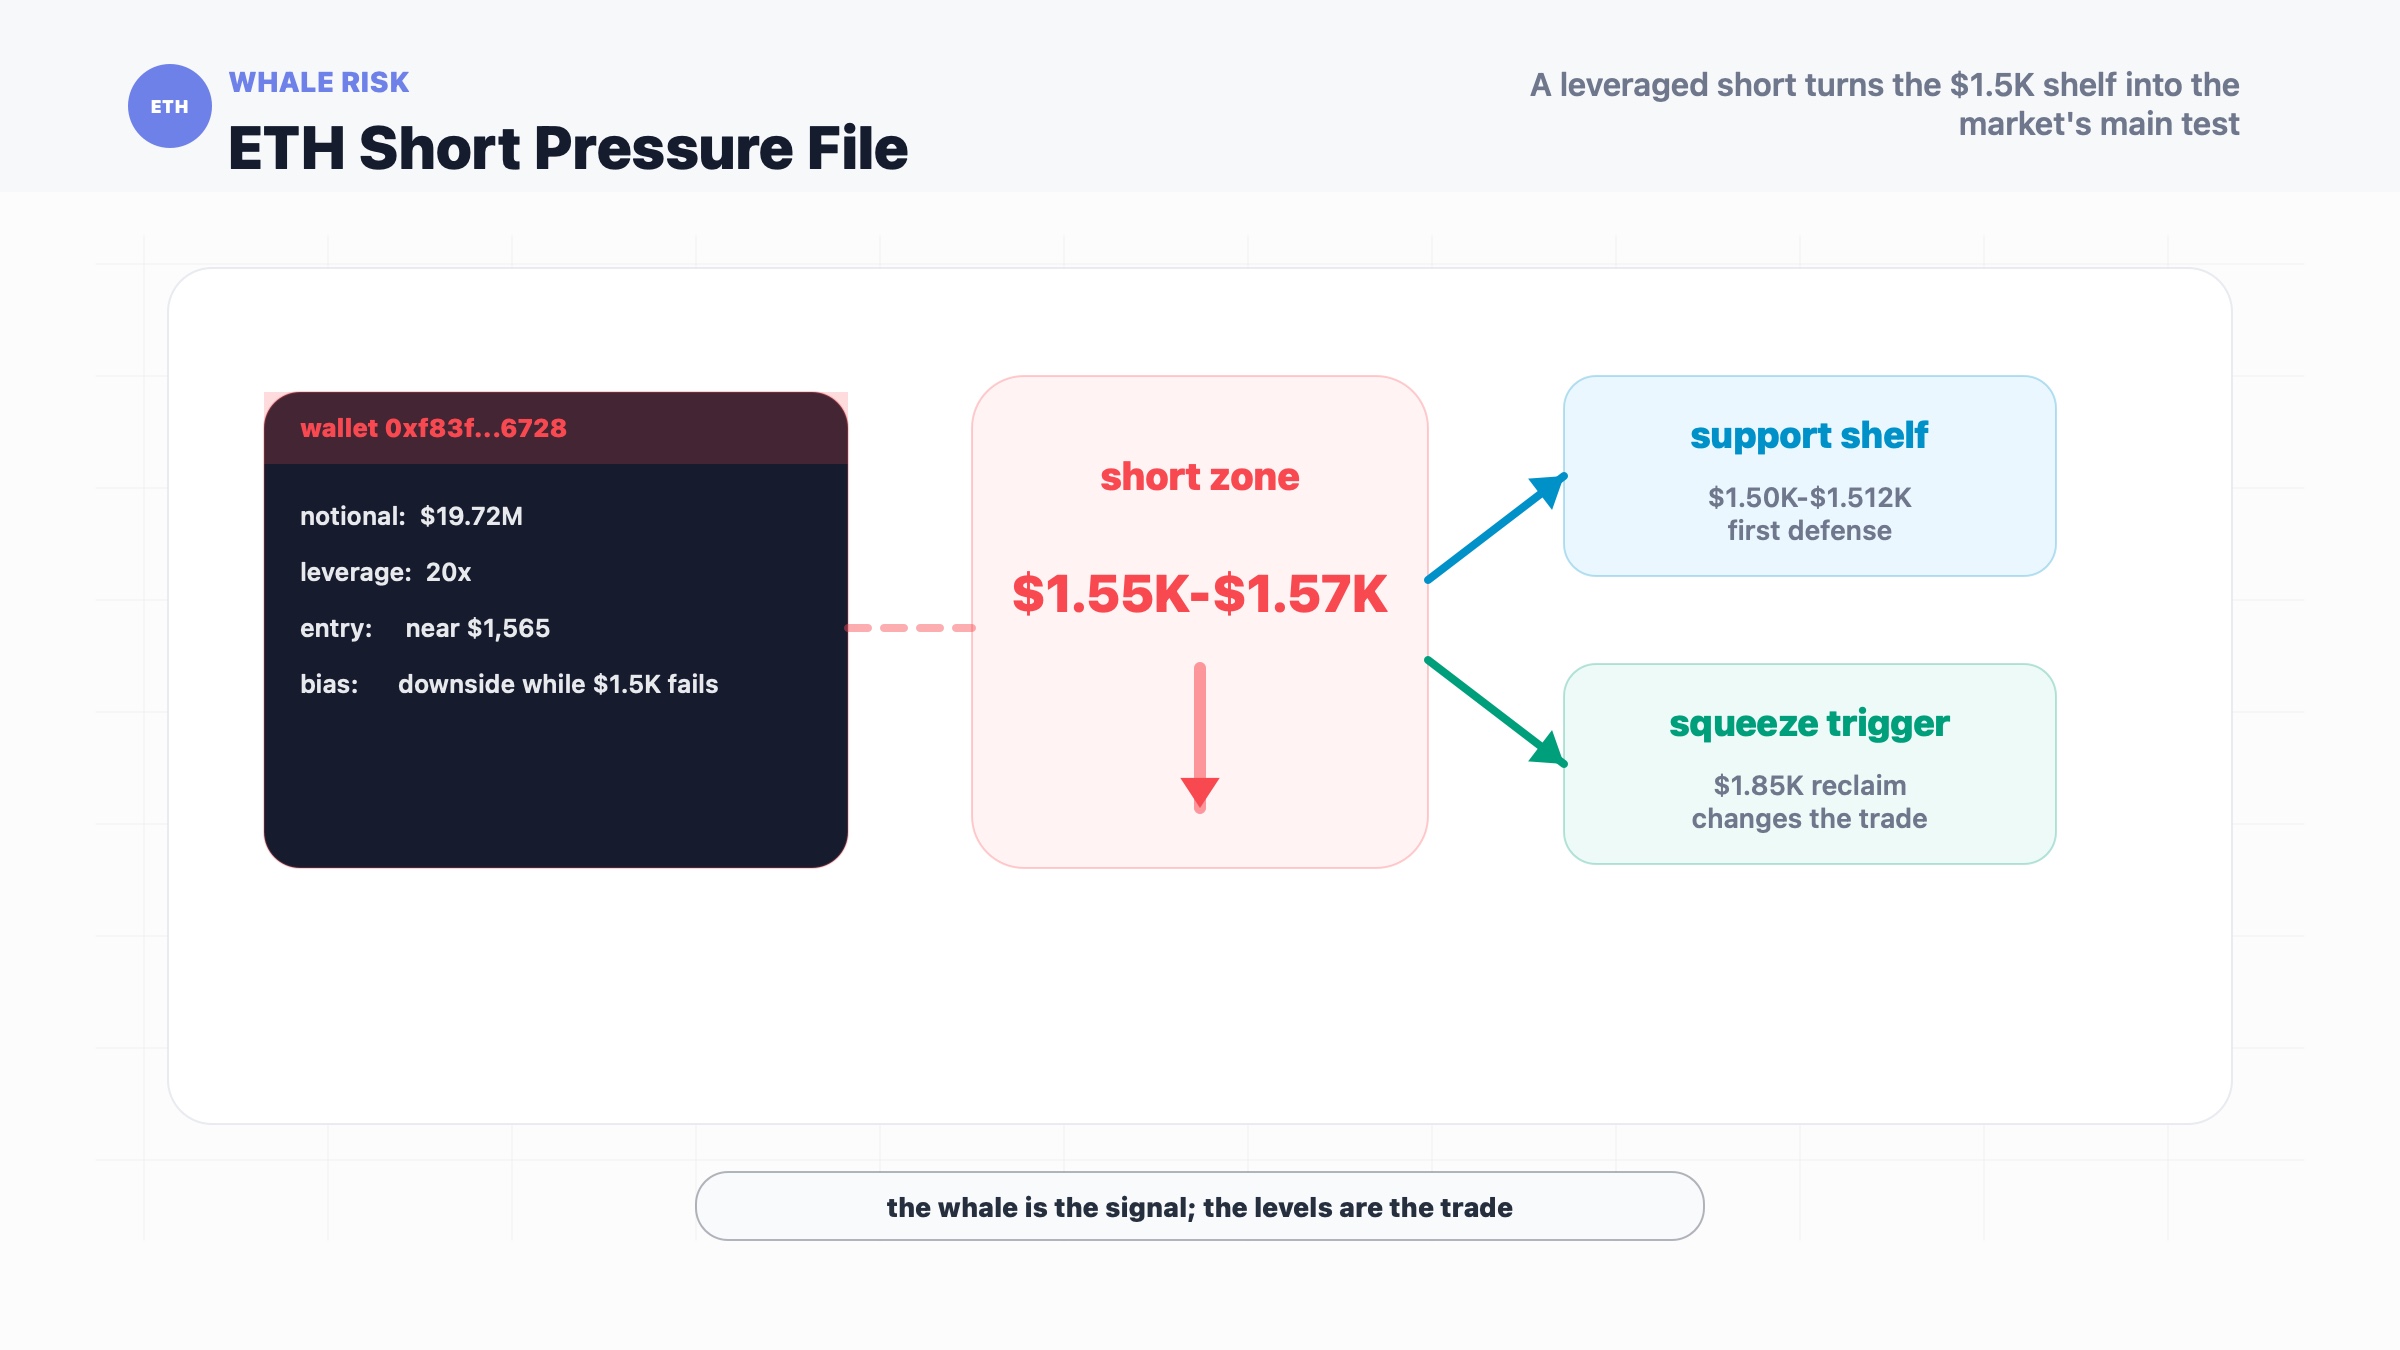
- $1.5K: The main support zone. A clean daily break would strengthen the case for another downside leg.
- $1.45K: The next stress area if $1.5K fails and ETF outflows remain negative.
- $1.75K-$1.8K: The broader trend repair zone. A move back into this area would suggest buyers are doing more than defending the lows.
Conditional Forecast
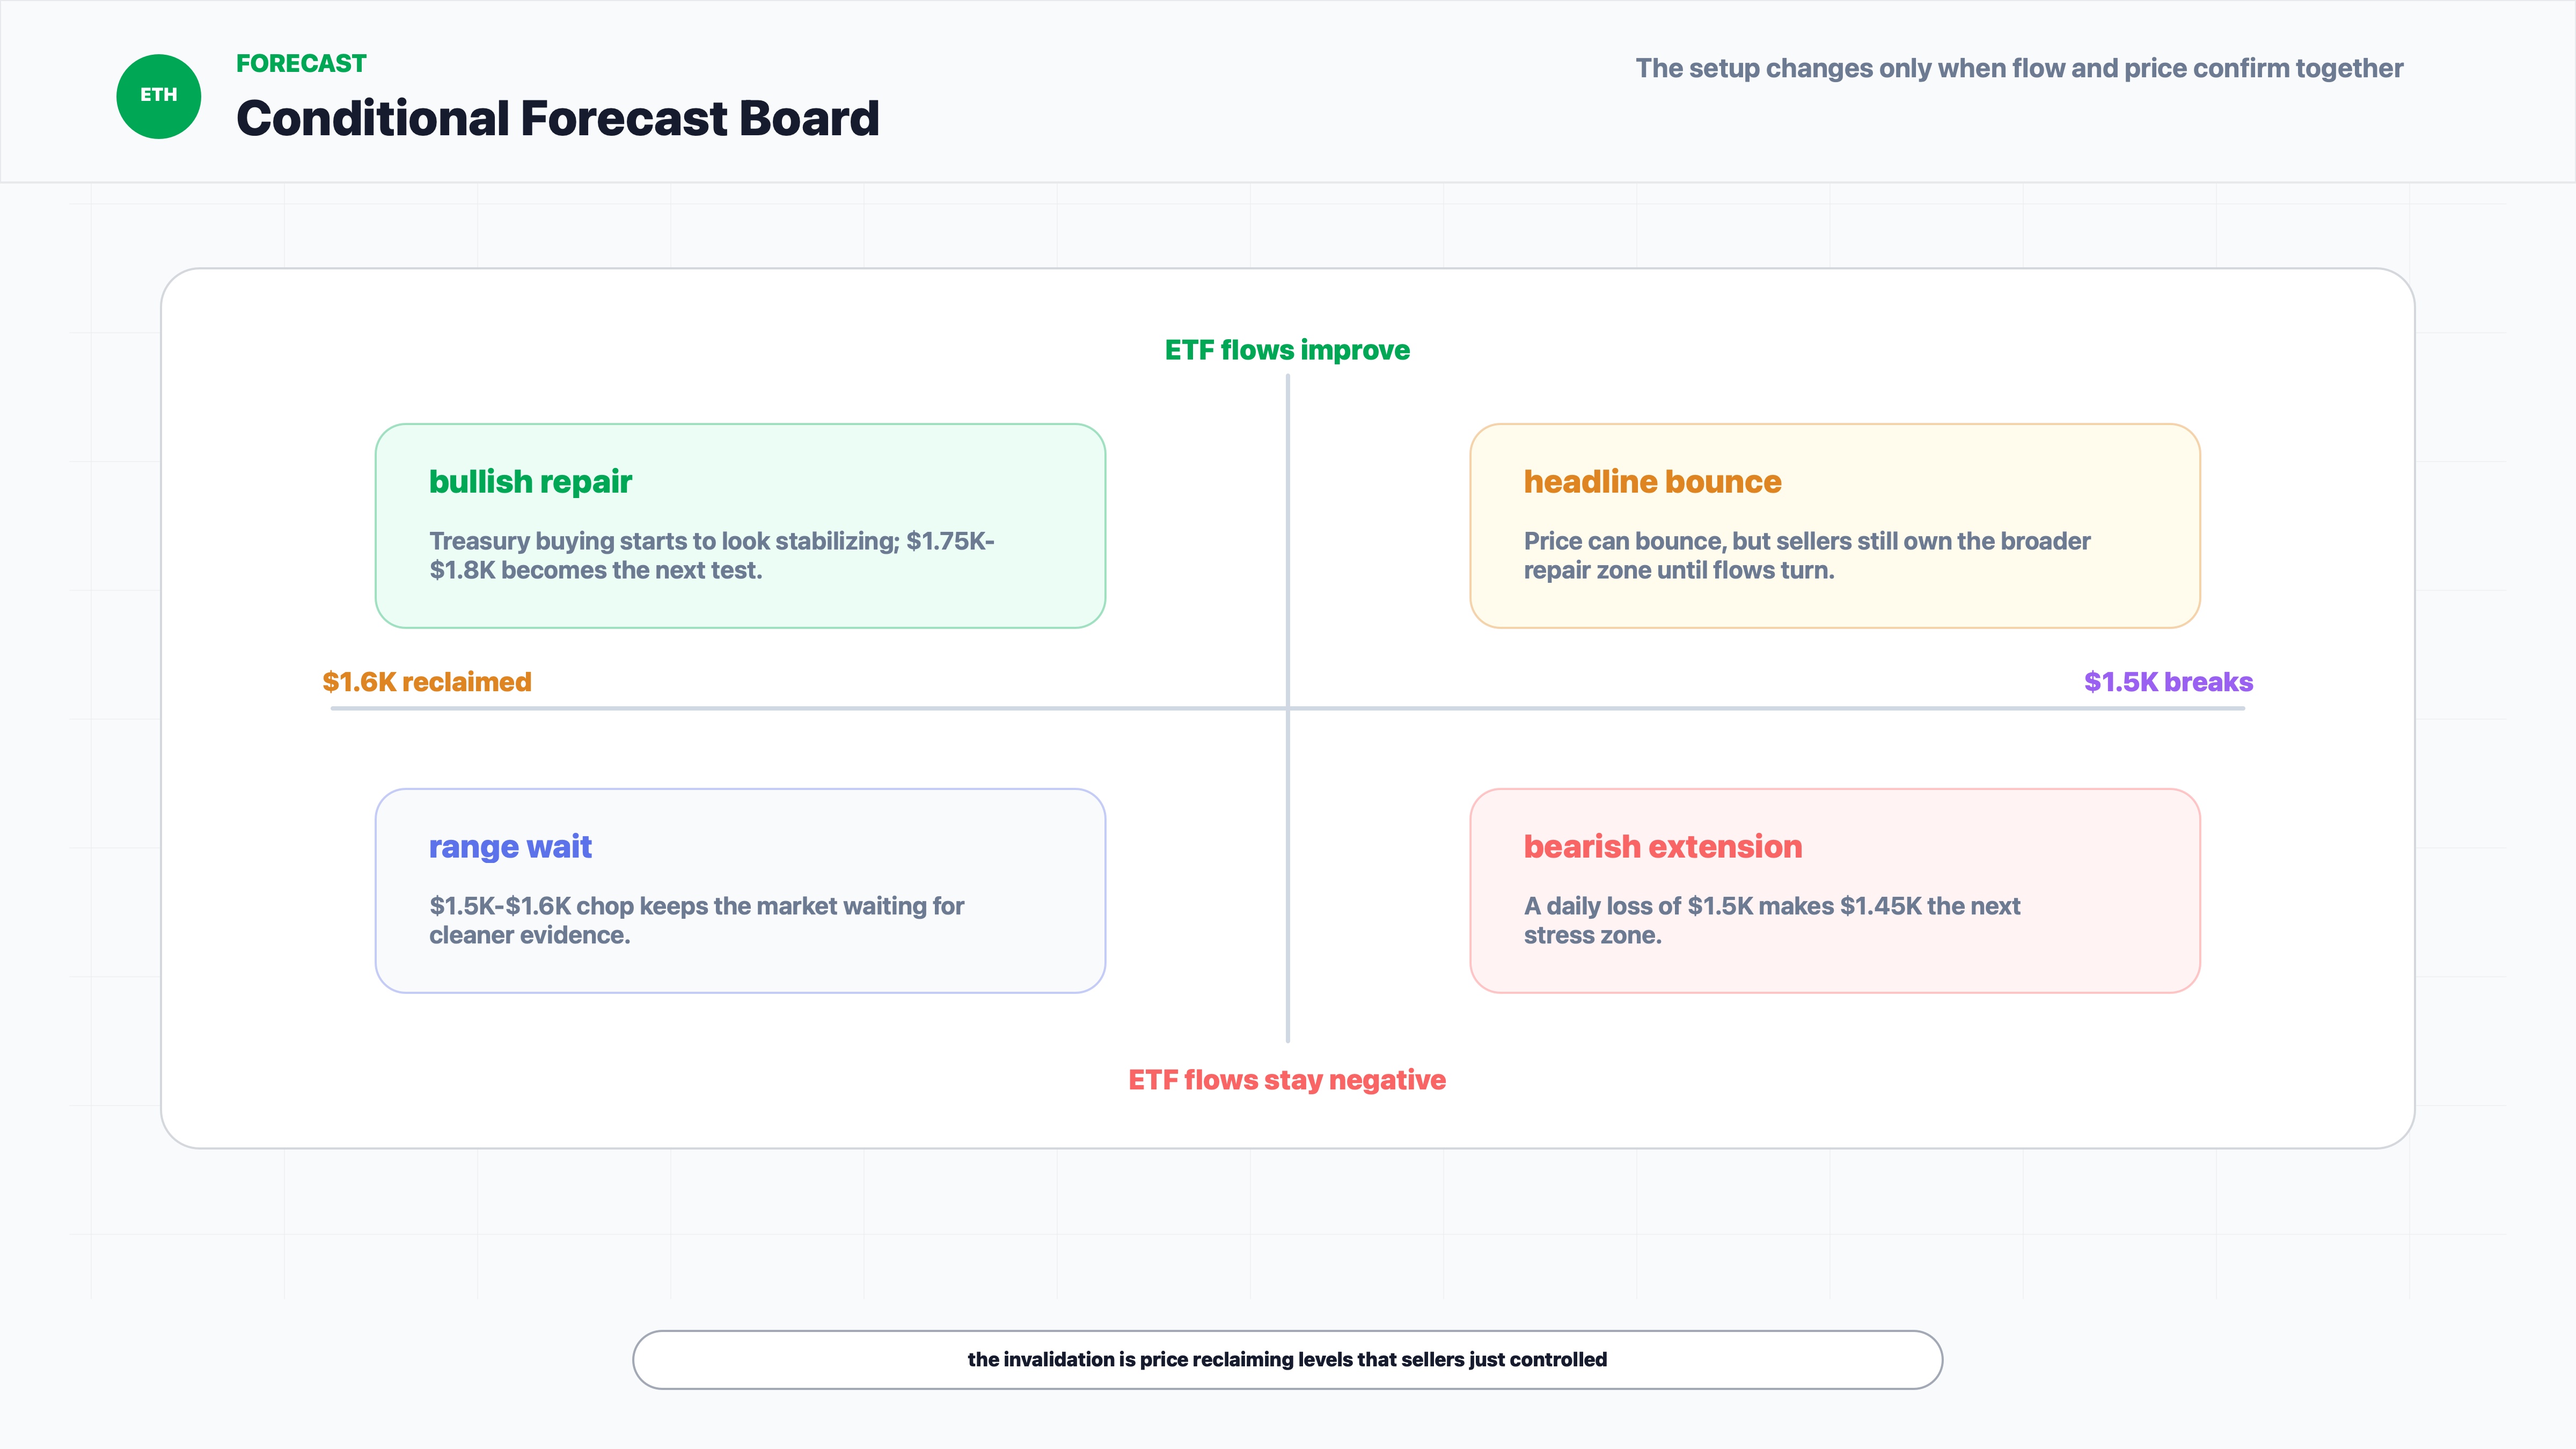
Bullish scenario: If ETH reclaims $1.6K and holds it on stronger volume, the market may start treating treasury accumulation as a stabilizing bid rather than a symbolic headline. In that case, $1.75K-$1.8K becomes the next repair zone.
Neutral scenario: If ETH stays between $1.5K and $1.6K, the market is probably waiting for cleaner evidence. That evidence could come from ETF flows turning positive, network activity improving, or BTC-led risk appetite lifting the broader crypto market.
Bearish scenario: If ETH loses $1.5K on a daily closing basis, the market may treat the corporate buying as too small to offset redemptions and weak onchain revenue. In that case, $1.45K becomes the next area to watch, and the RWA/tokenization story remains long-term background rather than short-term support.
The invalidation point for the bearish setup is not a speech, a treasury announcement or a hopeful chart annotation. It is price reclaiming levels that sellers just controlled.
Investment Takeaway
The investment takeaway is not "ignore BitMine." That would be too easy. Treasury buying matters because it shows that some institutional actors still want ETH exposure at depressed prices.
But the harder truth is that visible buyers are not enough when the rest of the market is voting with redemptions. ETH needs net demand, not just famous demand. It needs ETF flows to stop bleeding, network metrics to look less tired, and the daily chart to reclaim $1.6K before the $1.5K support test can become a credible bottoming argument.
Until then, this is a conditional setup. Long-term Ethereum bulls can keep their tokenization thesis. Short-term traders need to respect the chart. Those are not contradictory positions. They are just different time horizons refusing to pretend they are the same thing.
Sources
- Cointelegraph: Bitmine Ether buys eclipsed by $345M ETH ETF outflows (https://cointelegraph.com/markets/bitmine-ether-buys-eclipsed-by-345m-eth-etf-345m-outflows-is-sub-15k-next)
- TradingView: ETHUSDT chart (https://www.tradingview.com/chart/?symbol=BINANCE%3AETHUSDT&interval=D)
- Binance API: ETHUSDT daily OHLCV (https://api.binance.com/api/v3/klines?symbol=ETHUSDT&interval=1d&limit=160)
- DefiLlama: Ethereum fees and revenue (https://defillama.com/fees/chain/Ethereum)
- Farside Investors: Ethereum ETF flow data (https://farside.co.uk/eth/)
- Investopedia: Spot Ether ETFs first day of trading (https://www.investopedia.com/spot-ether-etfs-see-net-inflows-on-first-day-of-trading-8682917)
- Crypto Briefing: Grayscale ETHE outflows during the first week of US spot Ether ETF trading (https://cryptobriefing.com/us-ethereum-etfs-challenge/)
|
DISCLAIMER:
1. All content on this website (including but not limited to articles, data, charts, and analyses) is for general informational purposes only and does not constitute any form of investment advice, trading recommendation, or financial guidance. 2. Cryptocurrencies and digital assets are subject to extreme price volatility and high investment risk; you may lose part or all of your principal. Past performance does not predict future results. 3. The information on this website is based on sources we believe to be reliable, but we do not guarantee its accuracy, completeness, or timeliness. Any investment decisions made based on this website’s information are at your own risk. 4. We strongly recommend that you conduct your own thorough research and consult an independent, licensed financial advisor before making any investment decisions. |
Recommended reading
Latest News