
Key Takeaways
- An Ethereum wallet tied to a profitable October 2025 ETH short opened a new 20x short position worth about $19.72 million near the $1,500 support zone.
- The position was reportedly opened around $1,565, with ETH trading near $1,550 at press time and the bear-case target sitting near $1,375.
- The trade is large and interesting, but it is not magic. ETH still has a possible double-bottom setup around $1,500-$1,512 and a key neckline near $1,850.
- The ETHUSDT 4H chart remains under lower highs; bulls need to reclaim $1,850, while a clean loss of $1,500 would keep the $1,375 downside scenario alive.
What Happened
The simple version is this: a trader with a very memorable ETH shorting history has come back, and the market is paying attention because the new bet is large, leveraged and placed right where ETH bulls least want to see confidence on the other side.
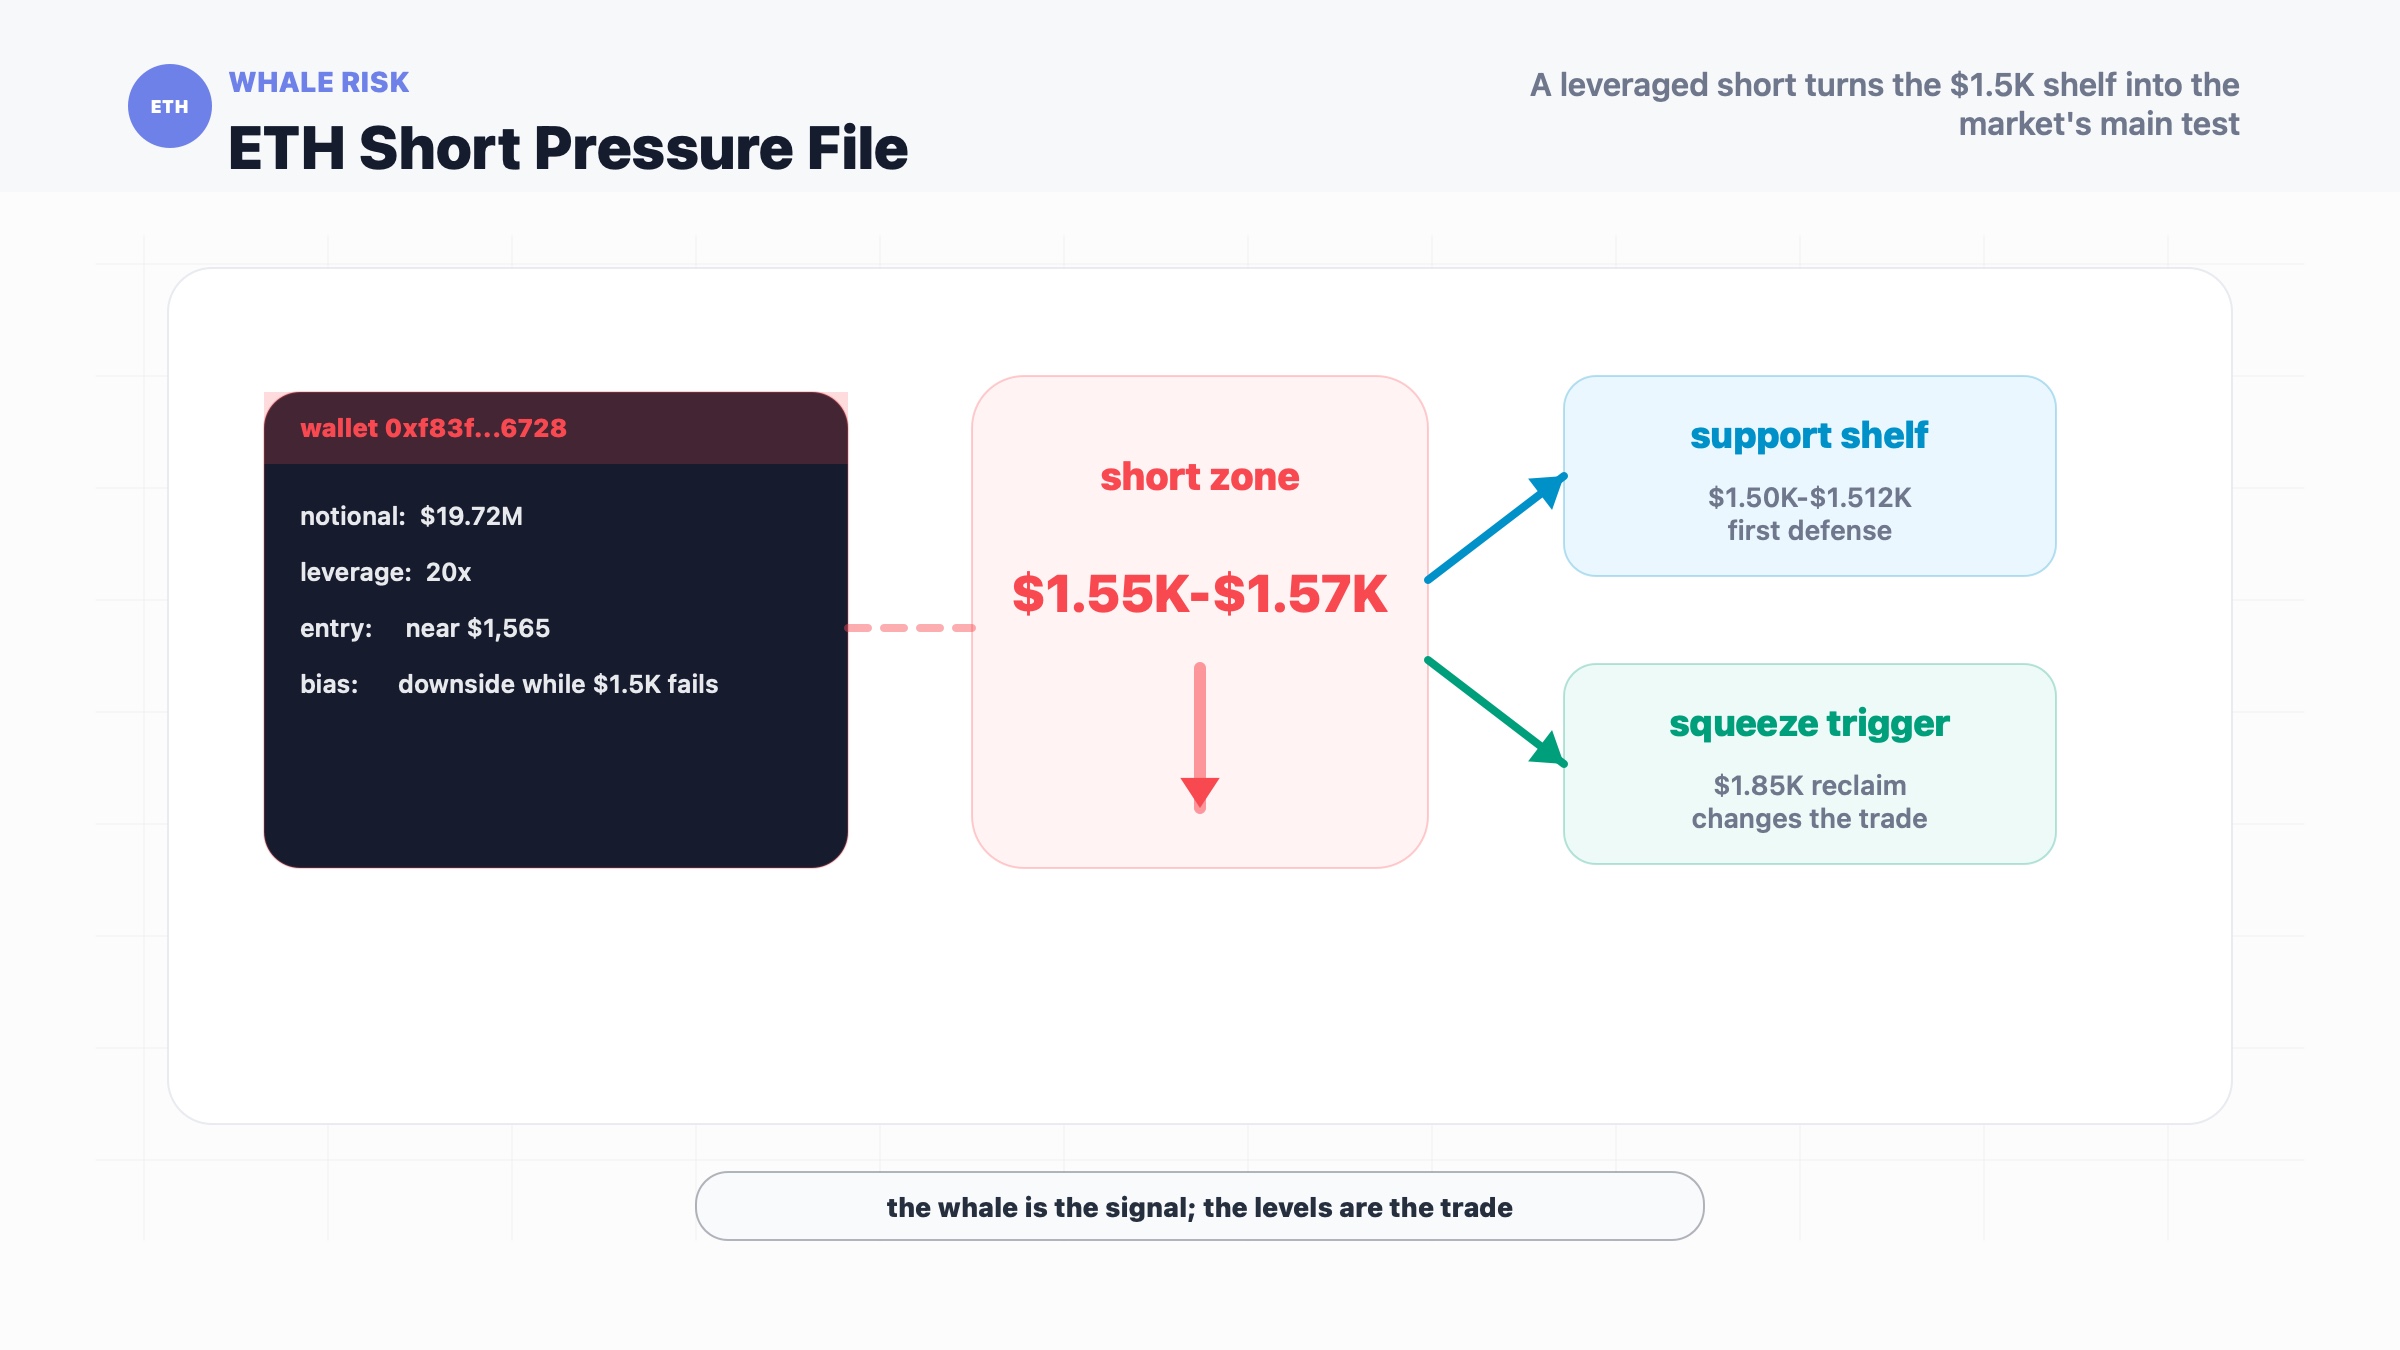
According to Cointelegraph, wallet 0xf83f...6728 opened a 20x-leveraged Ether short worth about $19.72 million on Friday as ETH fell toward the $1,500 support area. The position was opened at an average price of around $1,565, citing Hyperbot data. At the time of the article, ETH was trading near $1,550, giving the position about $106,500 in unrealized profit.
That is the first layer: a big short near a fragile level.
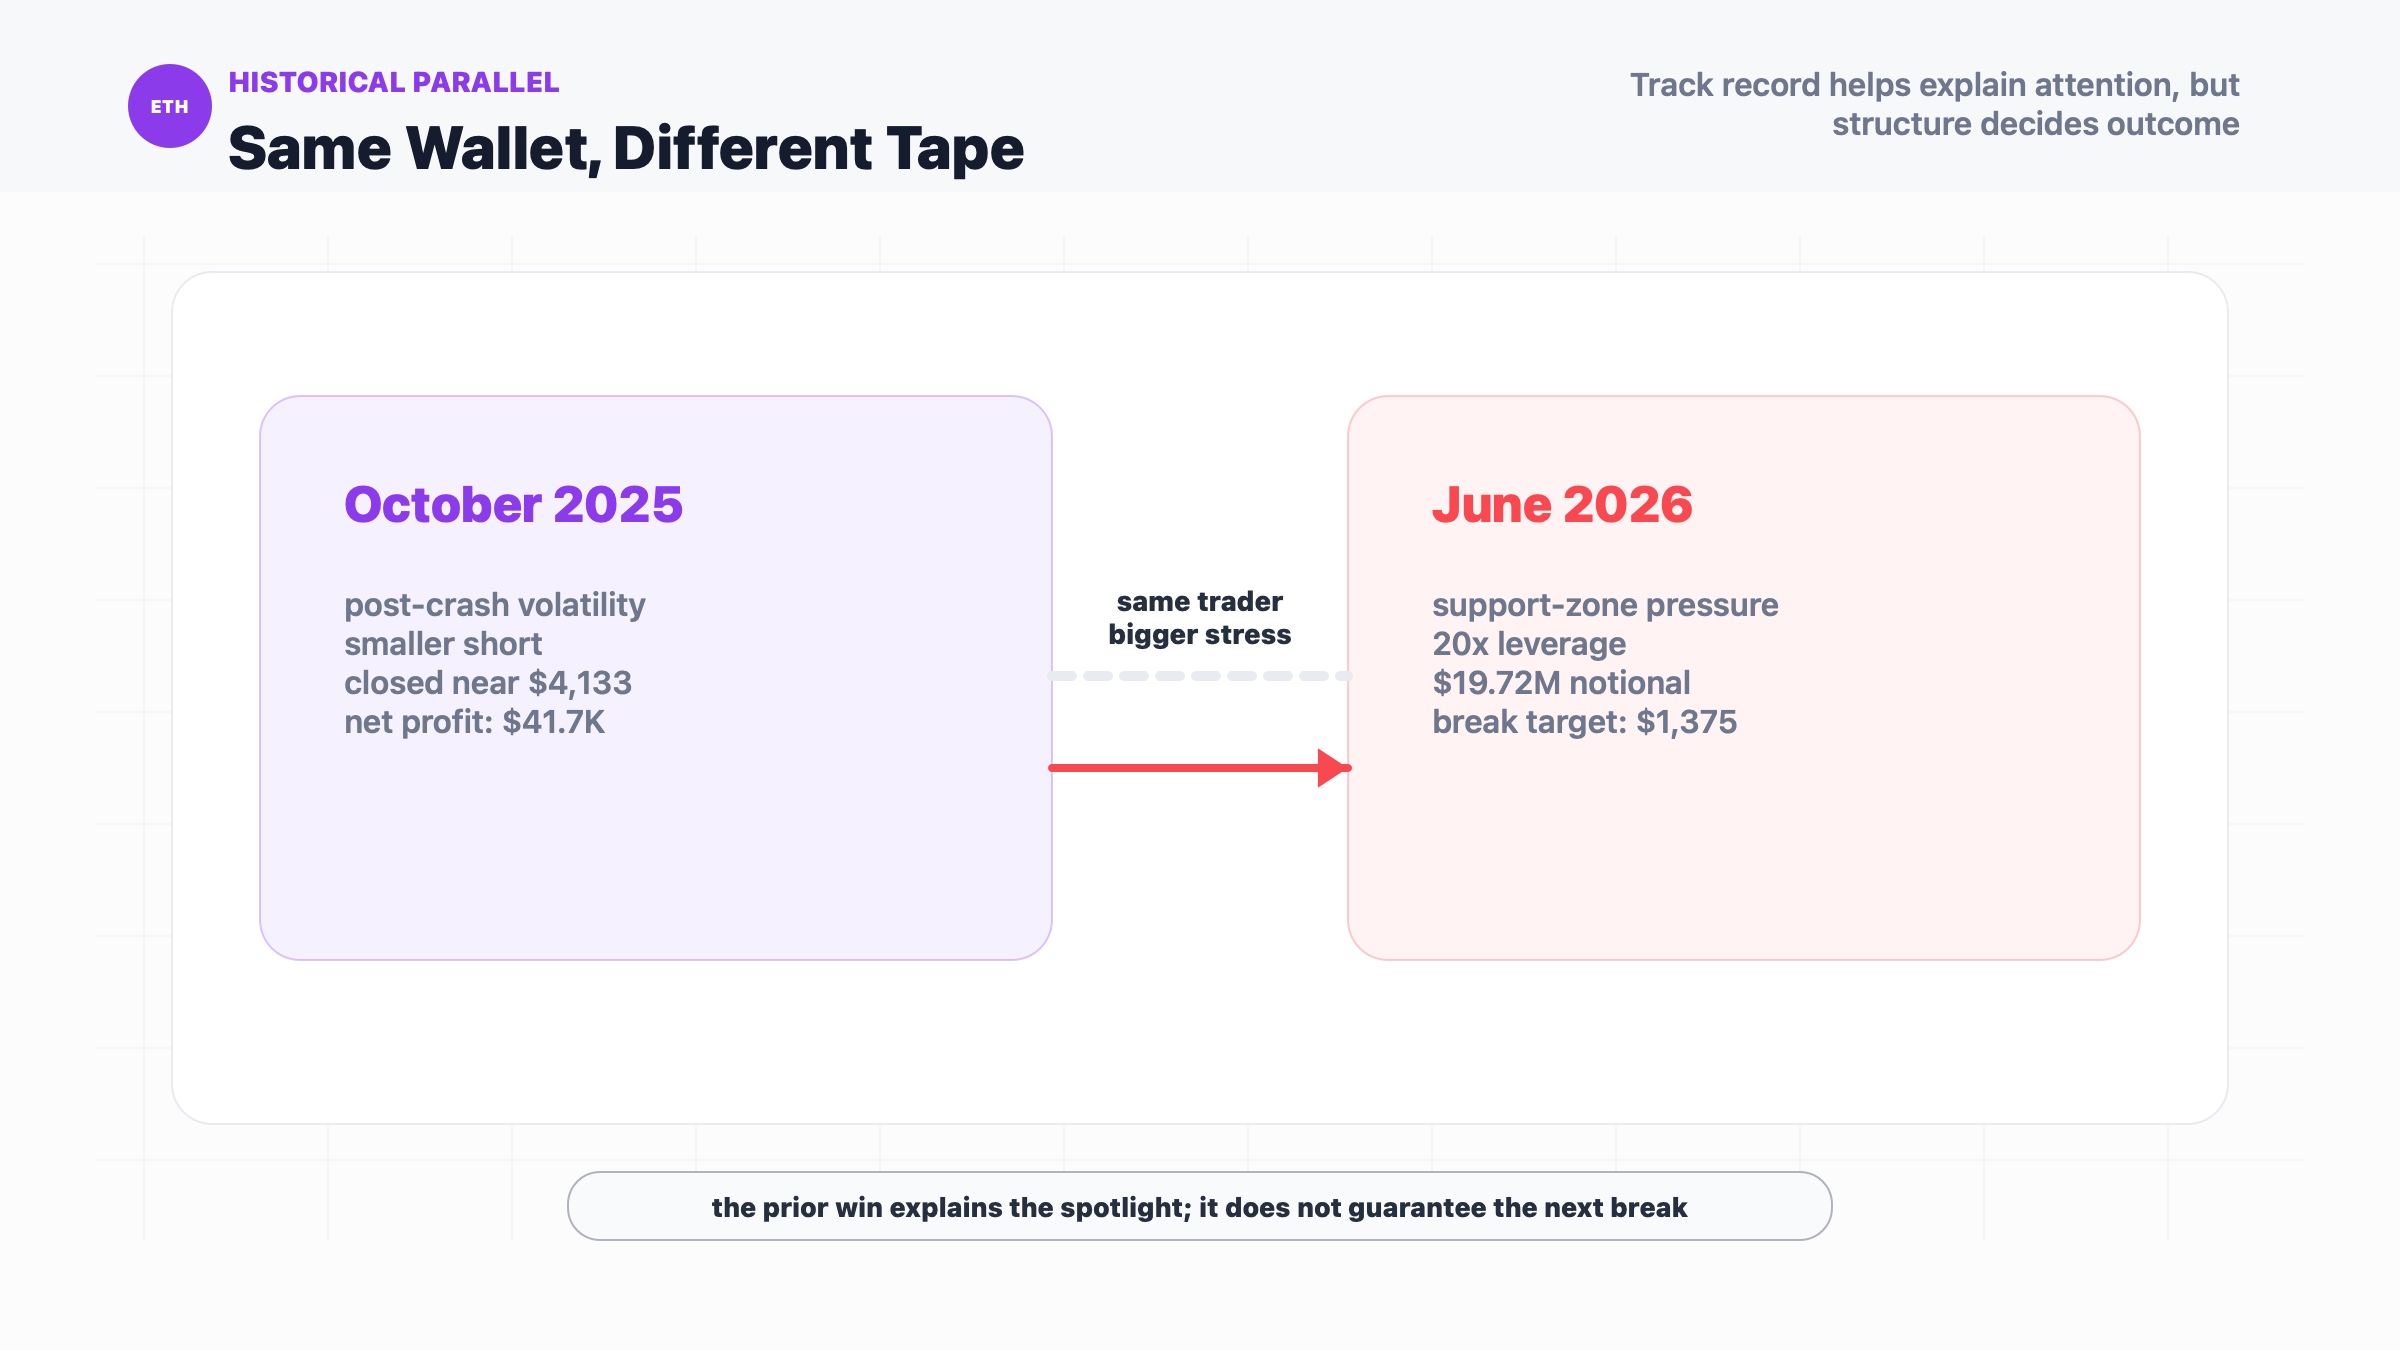
The second layer is the trader's history. The same wallet last became active on October 27, 2025, when it opened an ETH short near $4,172 as volatility from the October crypto crash was easing. It later closed that position near $4,133, booking $41,693 in net profit after $5,263 in fees.
The current trade is much larger. The October position was useful as a track record signal. The new one is a market event people can actually trade around, which is where things get more dangerous.
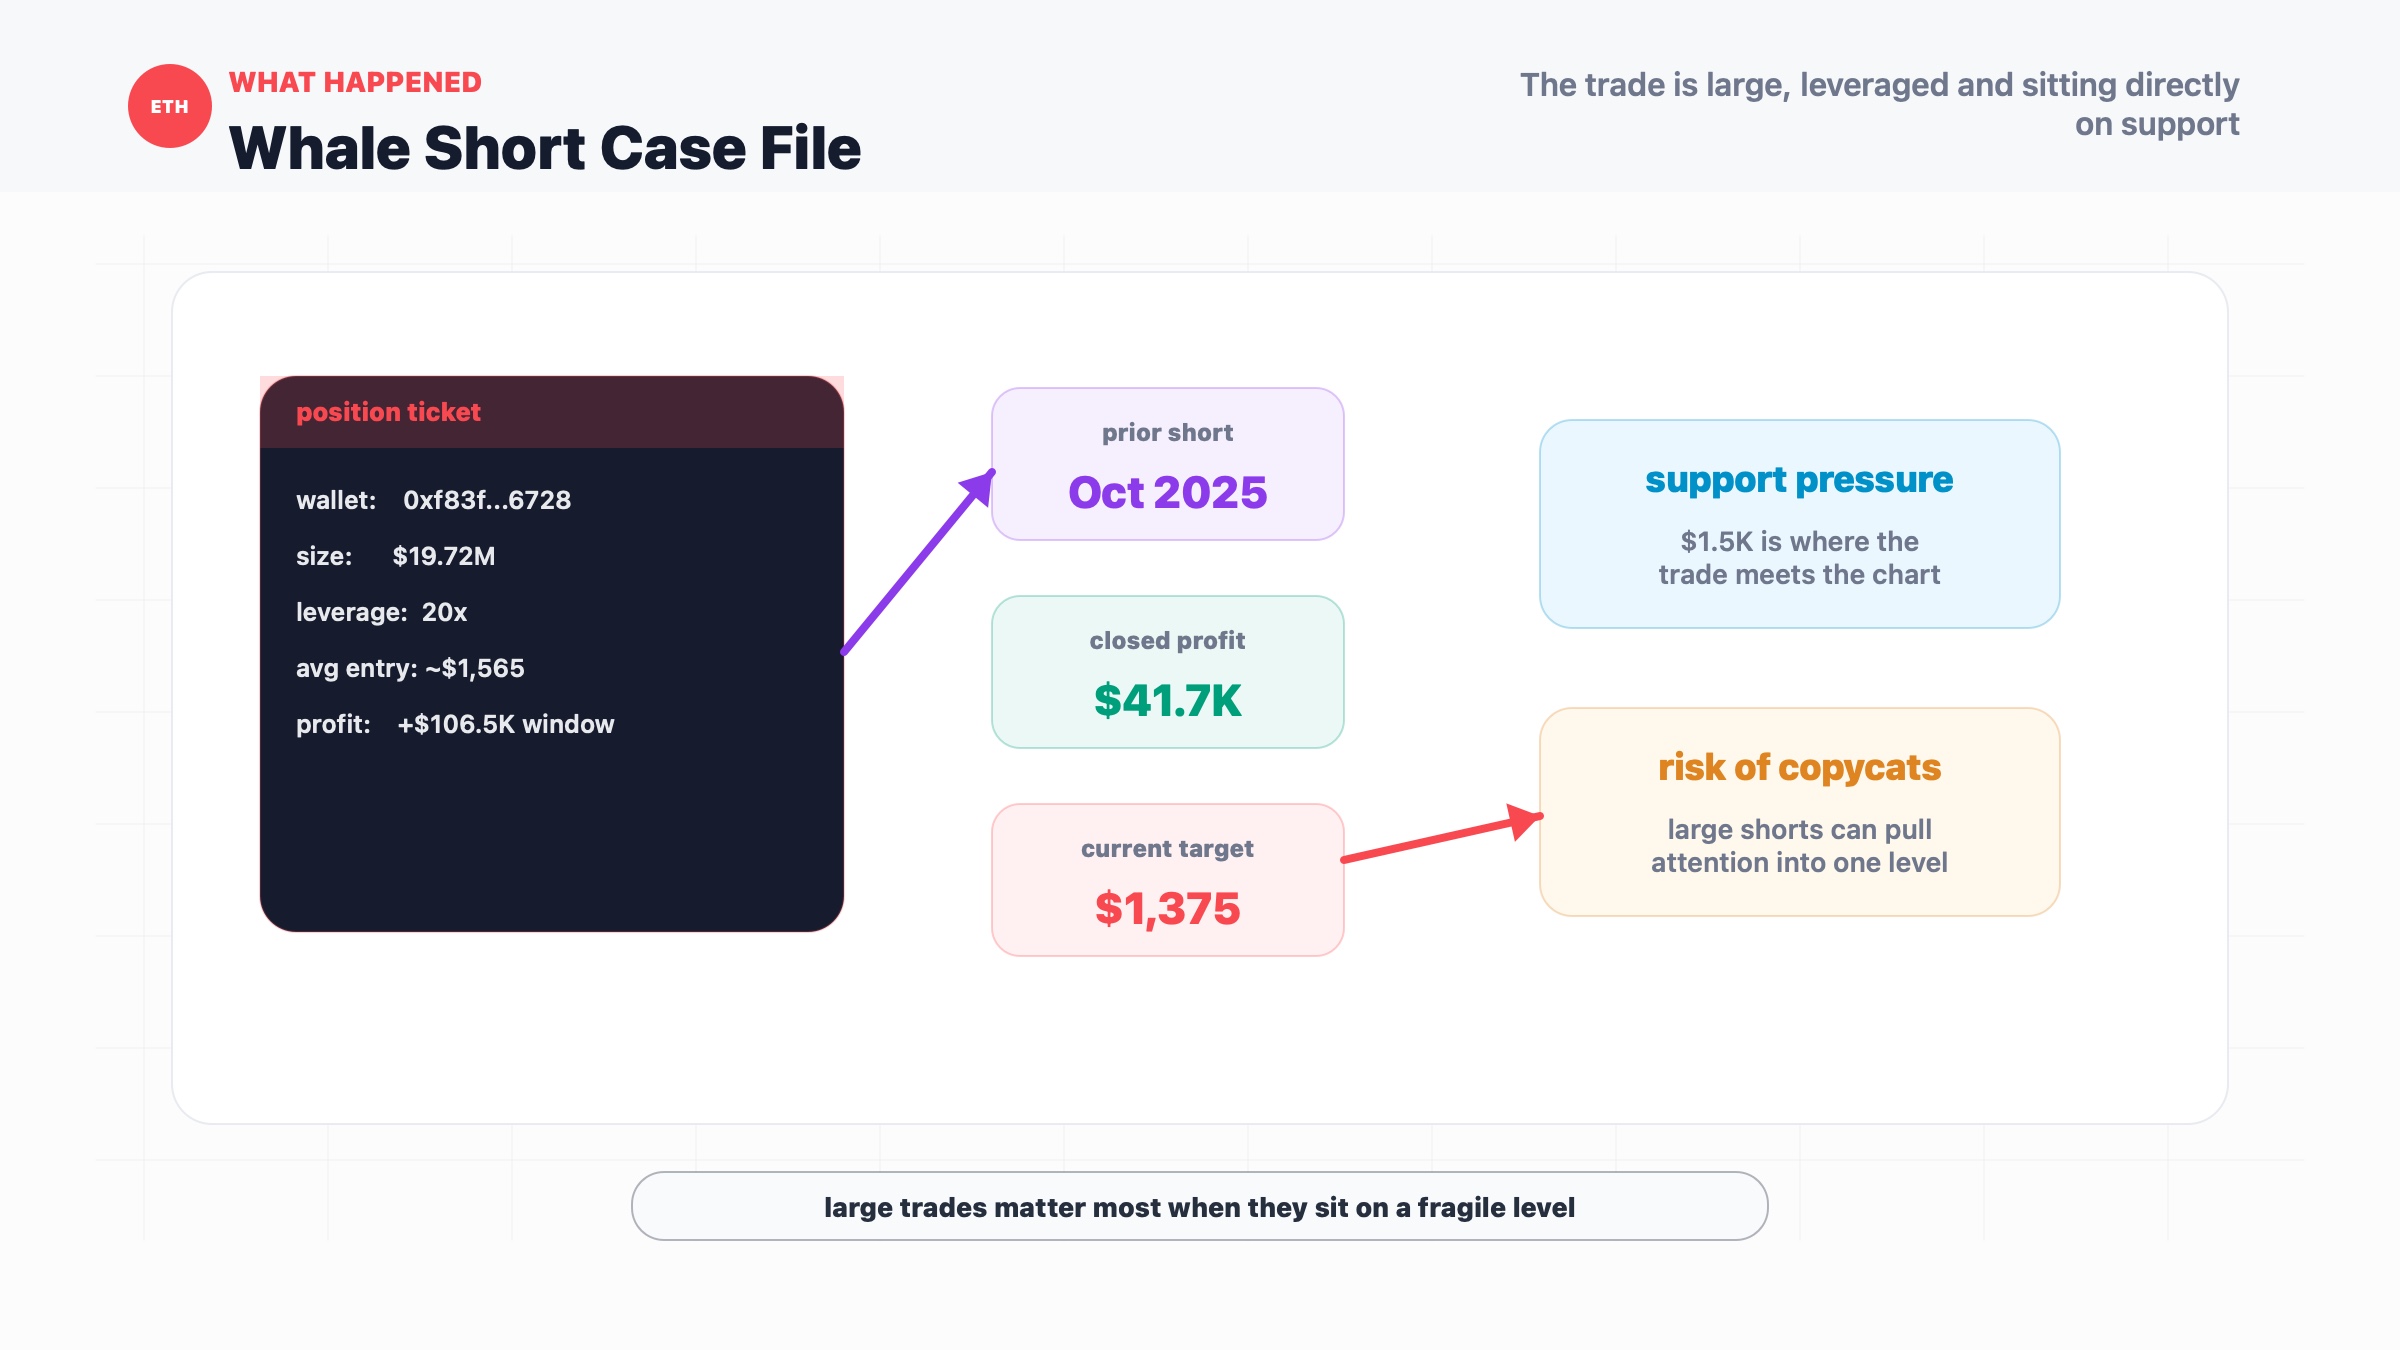
Cointelegraph also framed the downside setup through ETH's technical structure. If Ether continues breaking down from its bear flag, the article points to a possible decline toward $1,375. At that level, the whale's unrealized profit could rise to roughly $2.39 million before fees and funding.
But the bearish case is not clean. ETH is also sitting near a possible double bottom around $1,500-$1,512. If ETH rebounds strongly and closes above the $1,850 neckline, the article argues that the bullish reversal could point toward roughly $2,190, close to the whale's liquidation zone near $2,150.
So this is not just "a whale is short ETH." It is a leveraged bet sitting between a breakdown target and a squeeze trigger.
That is the useful part.
Why This Matters for Ethereum and Crypto Markets
Large leveraged trades matter because they turn price levels into incentives.
If you are the whale, the trade is simple enough: ETH is weak, broader tech risk is soft, Ethereum-specific sentiment has been hurt by foundation scrutiny, and the chart is hovering near a level that could break. A 20x short makes that view much more efficient. It also makes it much more fragile. Leverage is a way of saying, "I would like the market to be right quickly, please."
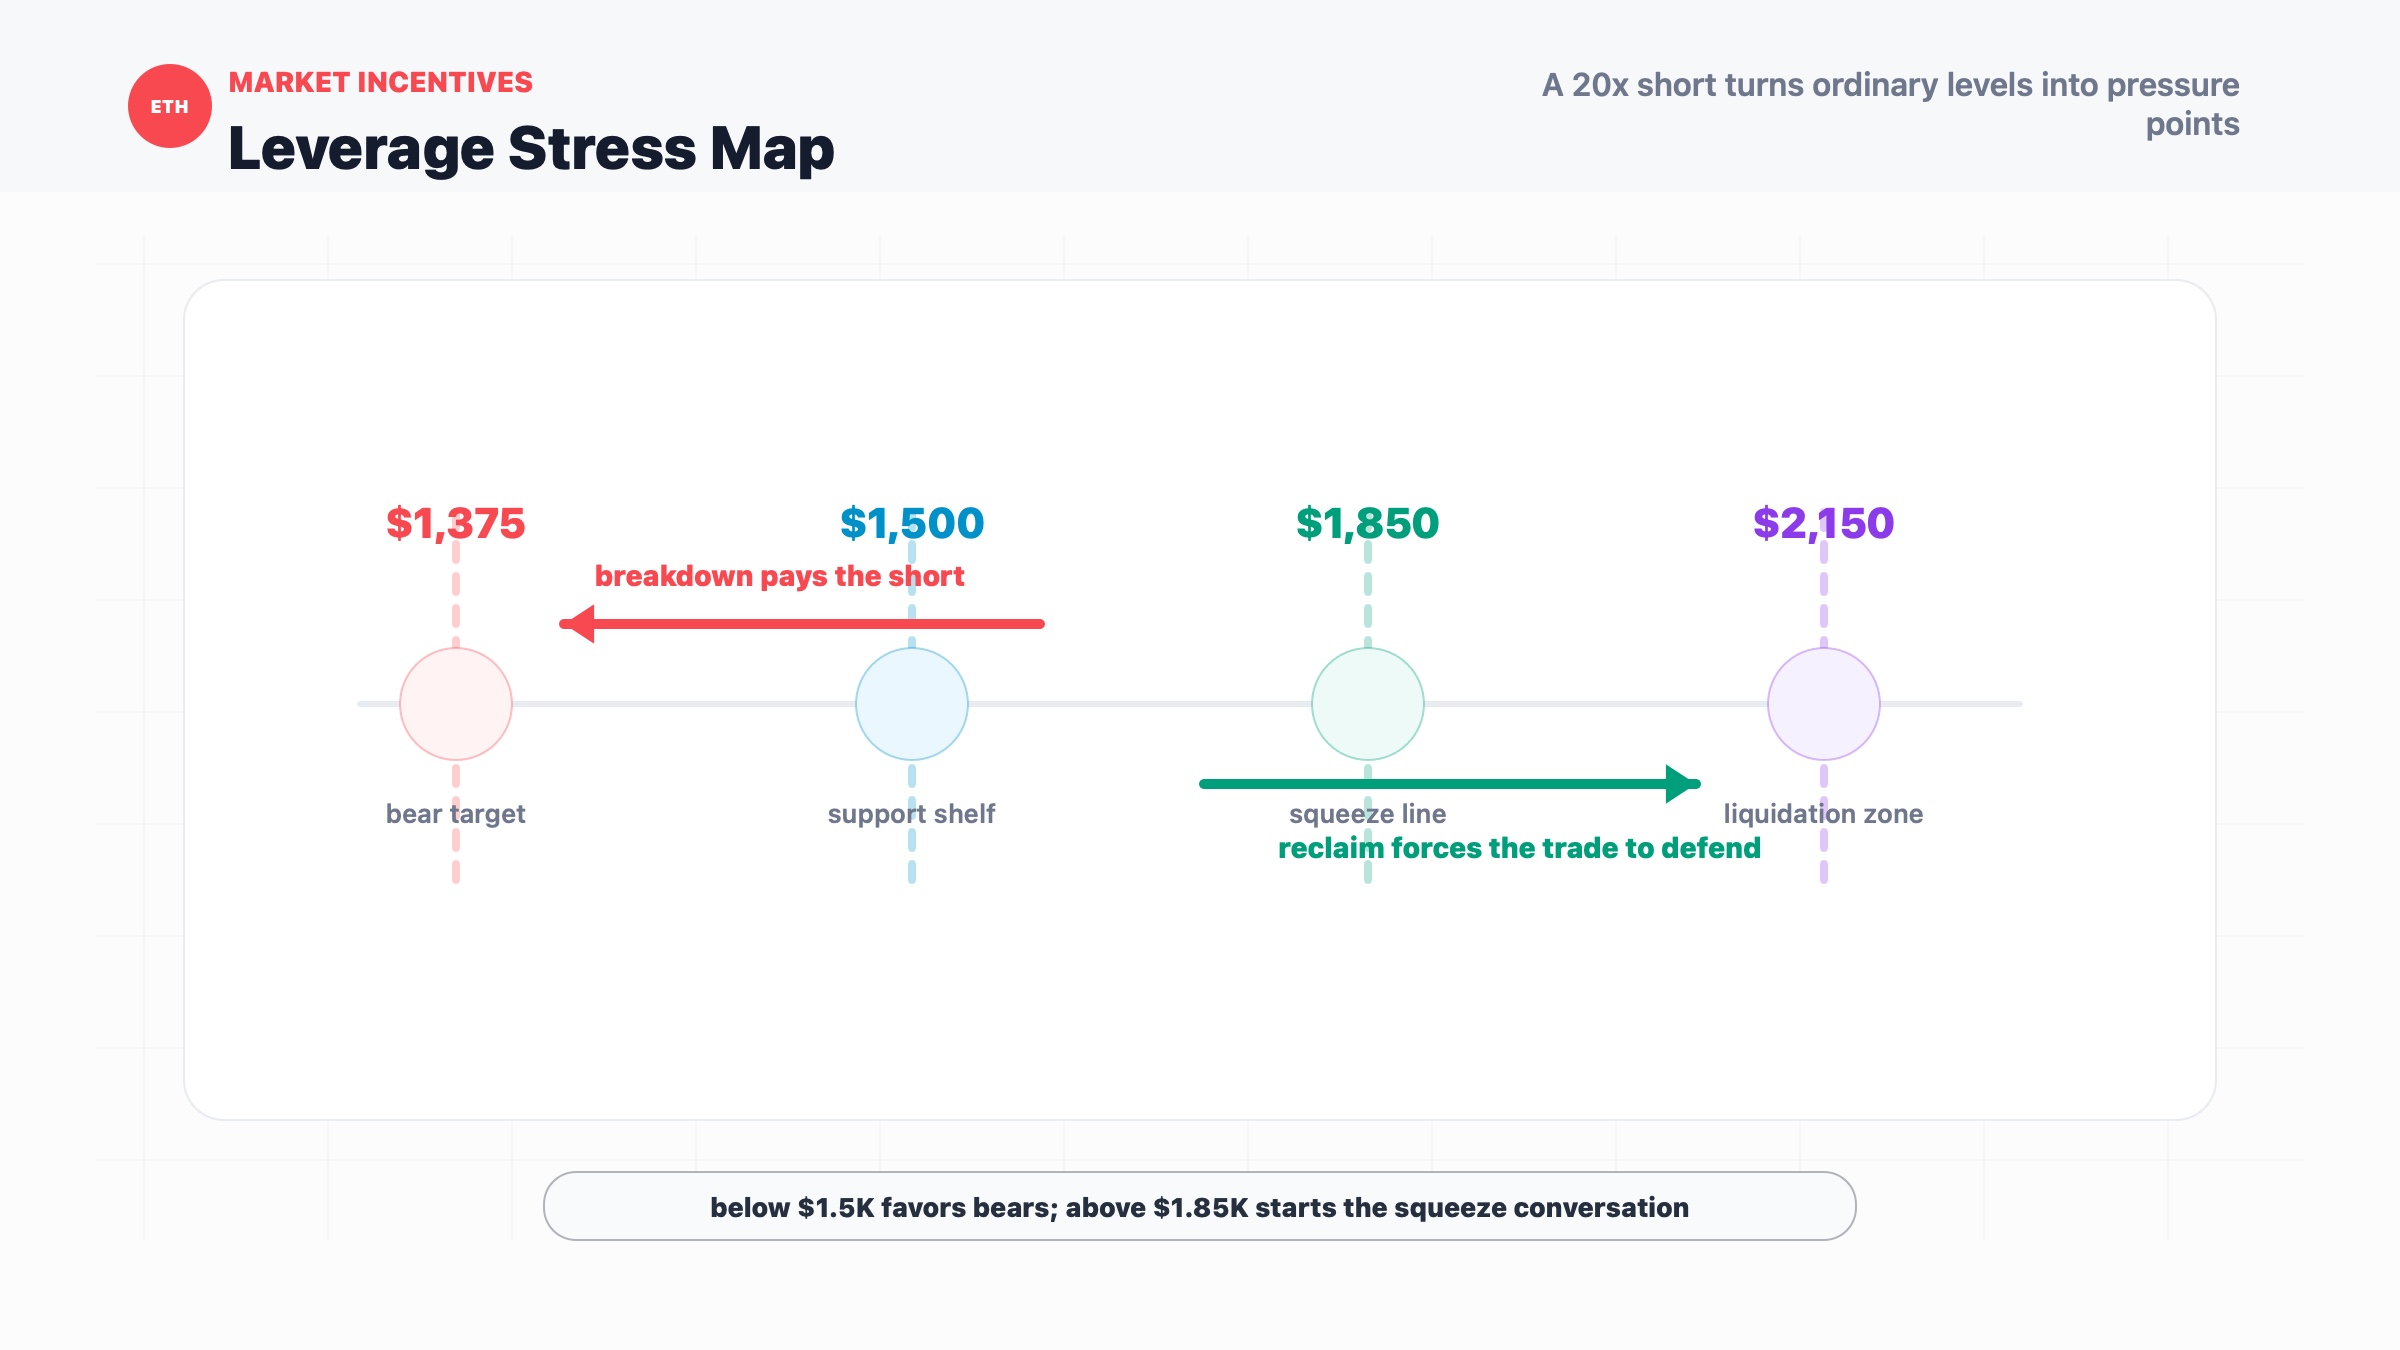
If you are watching ETH from the outside, the trade does not prove the bearish case. It makes the bearish case more visible. The market already knew ETH was under pressure. What the whale position adds is a focal point: traders can now anchor around the entry zone, the $1,500 support level, the $1,375 extension target and the $1,850 squeeze line.
That changes the conversation.
The bearish interpretation is straightforward. ETH has fallen 18.25% over two weeks, speculative assets are under pressure from a tech-led risk selloff, and the Ethereum Foundation headlines have made the asset's own story feel heavier. In that environment, a high-conviction short from a wallet with a past winning trade becomes easy to believe.
The bullish counterargument is just as mechanical. A crowded short near support can become fuel if price stops going down. If ETH holds $1,500-$1,512 and reclaims $1,850, the same leverage that made the short attractive can turn into pressure on the trader to reduce risk, add collateral or face liquidation closer to $2,150.
This is why the trade matters: not because one wallet controls Ethereum, but because a large leveraged position can reveal the market's stress points. The chart now has a scoreboard. Below $1,500, bears keep the story. Above $1,850, the story starts arguing with itself.
Markets enjoy doing that. It keeps everyone humble, eventually.
Historical Parallel
The closest historical parallel is the October 2025 crypto crash and the same wallet's earlier ETH short.
In October 2025, crypto markets went through a sharp liquidation event after a broader risk shock hit speculative assets. Bitcoin and major altcoins sold off quickly, leverage was forced out of the system, and ETH moved through a much more violent environment than an ordinary support test. Cointelegraph says wallet 0xf83f...6728 became active again on October 27, 2025, opening an ETH short near $4,172 as the crash volatility was easing. The wallet later closed near $4,133, earning $41,693 in net profit after $5,263 in exchange fees.
The similarity is obvious: the same wallet is again leaning into downside momentum after ETH has already weakened. Both trades use the same broad logic. ETH is falling, sentiment is bad, liquidity is nervous, and the trader decides that the path of least resistance is still lower. The new trade also borrows credibility from the old one. Markets love a returning character, especially when the character made money last time.
But the difference matters more than the similarity. October 2025 was a market-wide crash environment. The current setup is narrower. ETH is down sharply, but the fight is concentrated around a technical zone: $1,500-$1,512 support, a $1,375 bear-flag target and a $1,850 neckline that could threaten the short if reclaimed. The new position is also much larger in notional terms and uses 20x leverage, which makes it more sensitive to a sudden rebound.
The lesson is not that the whale must be right again. That would be too easy, and markets do not usually offer the easy version for free. The better lesson is that a good prior trade can make traders overfocus on the trader and underfocus on the structure. In this case, the structure is simple: if ETH loses $1,500, the downside target gains credibility. If ETH reclaims $1,850, the old hero trade can become today's squeeze risk.
ETH Price Reaction and K-Line Analysis
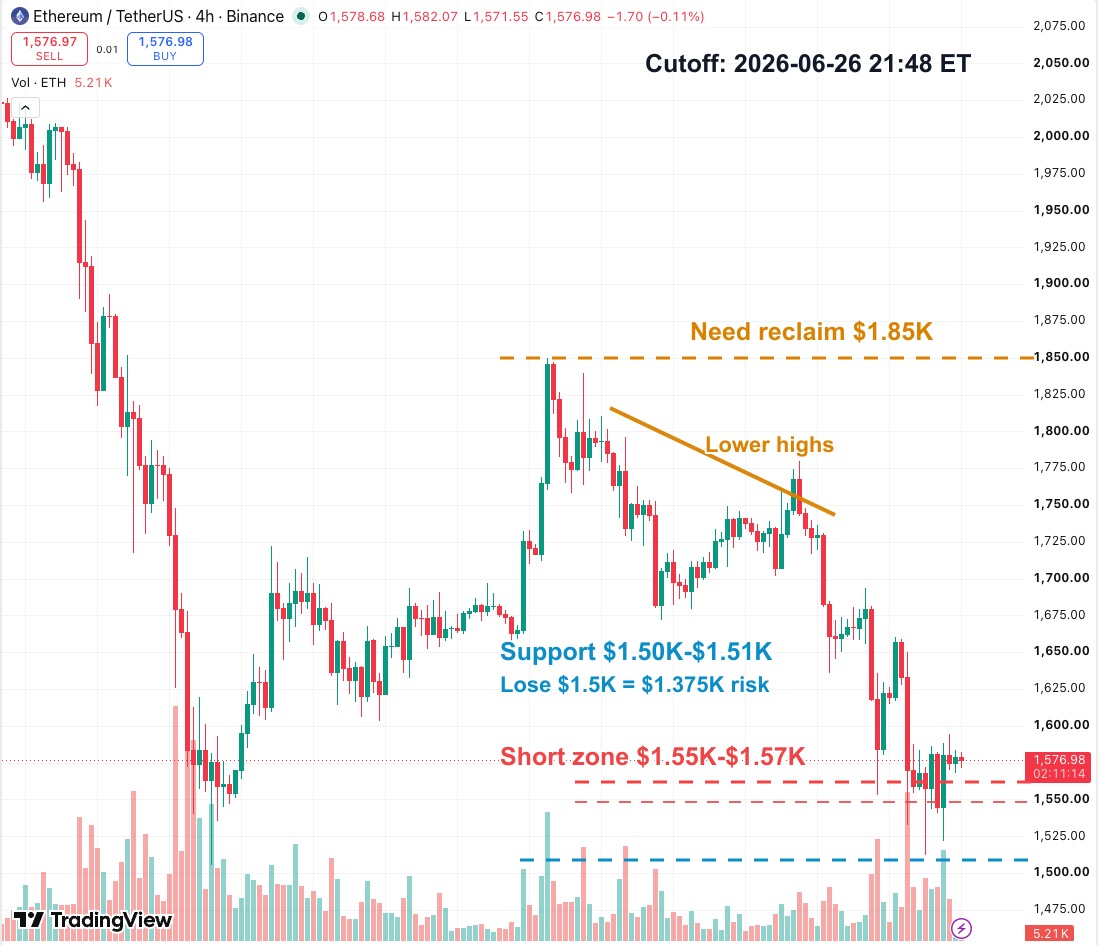
The 4-hour ETHUSDT chart shows a market that is not merely weak, but organized in a very specific way.
ETH has been stepping down through lower highs after failing to hold the mid-June rebound. The $1,850 area now acts like the clean reclaim level because it lines up with the neckline discussed in the article. A move back above that level would not just make the chart look better. It would directly challenge the logic of the whale short.
The short entry zone around $1,550-$1,570 is now the immediate battlefield. That is roughly where the whale opened the position and where ETH was trading during the article window. If ETH keeps rejecting below this area and then loses $1,500, the trade looks aligned with price structure. The bear-flag target near $1,375 becomes more plausible because the support shelf would have failed.
The $1,500-$1,512 support zone is the first real test for bulls. The chart shows repeated pressure into that area, but not a clean surrender yet. That distinction matters. A support zone can look terrible and still work if buyers defend it with enough force. It only becomes a breakdown after price accepts below it.
Above the market, $1,850 is the level that changes the tone. A strong close above it would create the opposite problem for the short: the bearish trade would no longer be sitting above a weakening support zone, but below a possible reversal structure.
That is why this setup is so clean. The argument has levels attached.
Key Levels to Watch
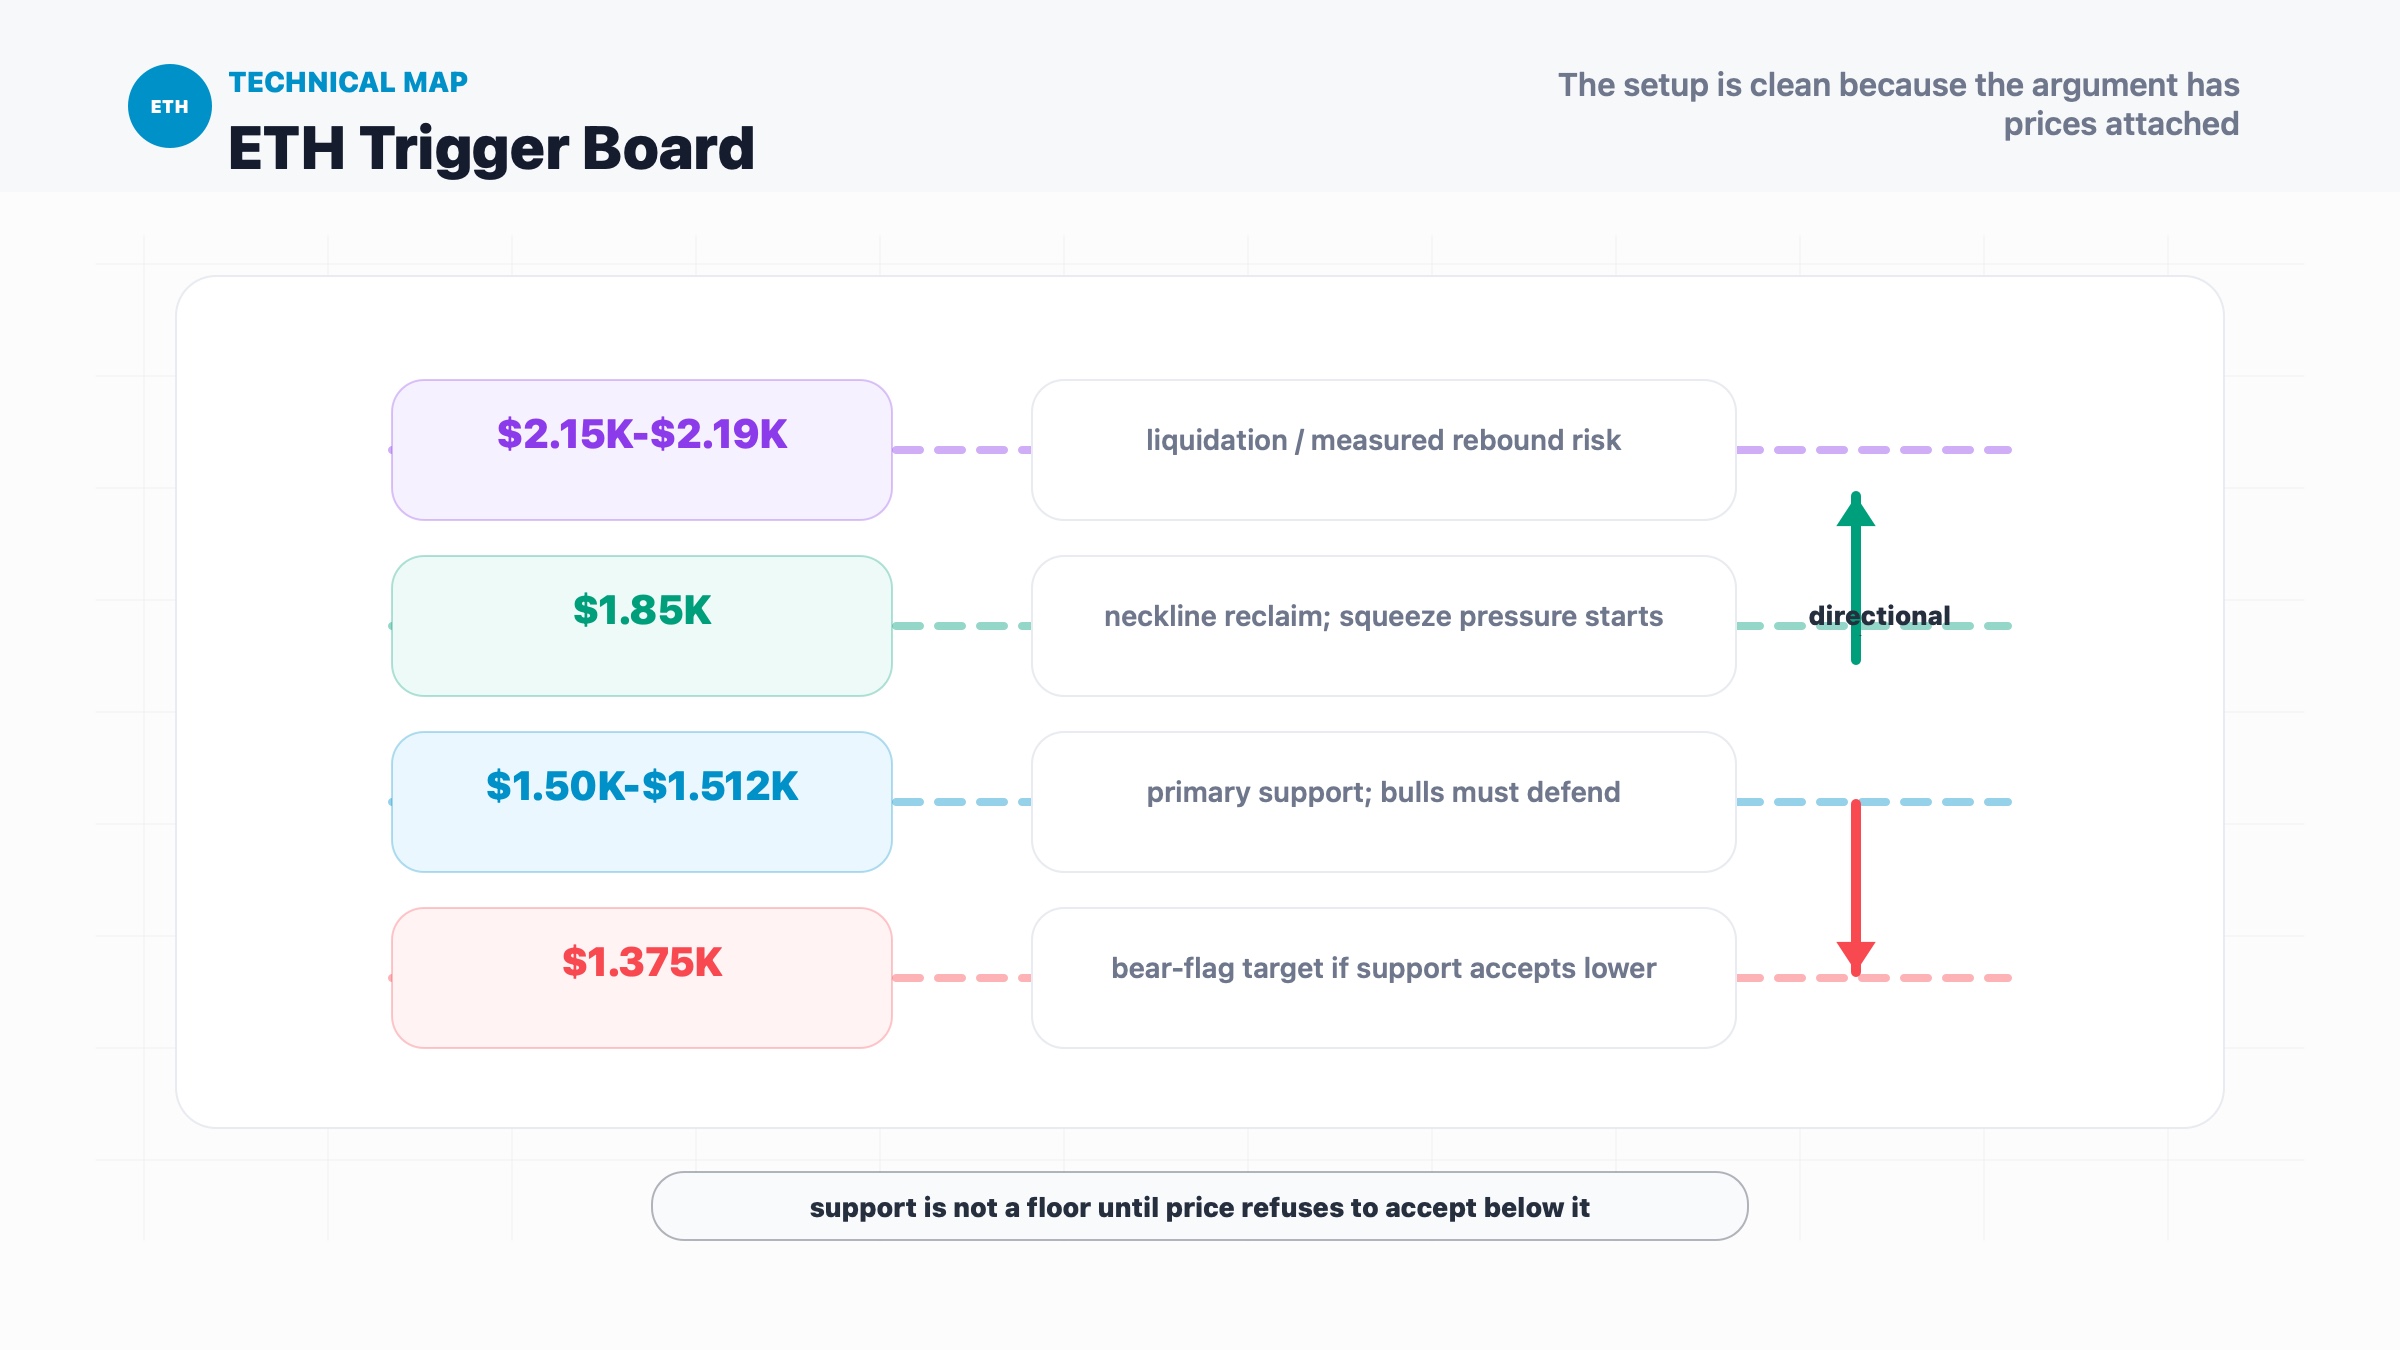
$1,850: Reclaim and double-bottom neckline. A decisive daily close above this area would weaken the short thesis and raise squeeze risk.
$1,550-$1,570: Whale short entry zone. Holding below this range keeps the position comfortable; reclaiming it makes the short less clean.
$1,500-$1,512: Primary support zone. This is where bulls need to prove the double-bottom idea is more than wishful chart geometry.
$1,375: Bear-flag downside target cited in the article. This level becomes more relevant if ETH accepts below $1,500.
$2,150-$2,190: Liquidation and measured-rebound risk area. It matters only if ETH first reclaims $1,850 with strength.
Conditional Forecast
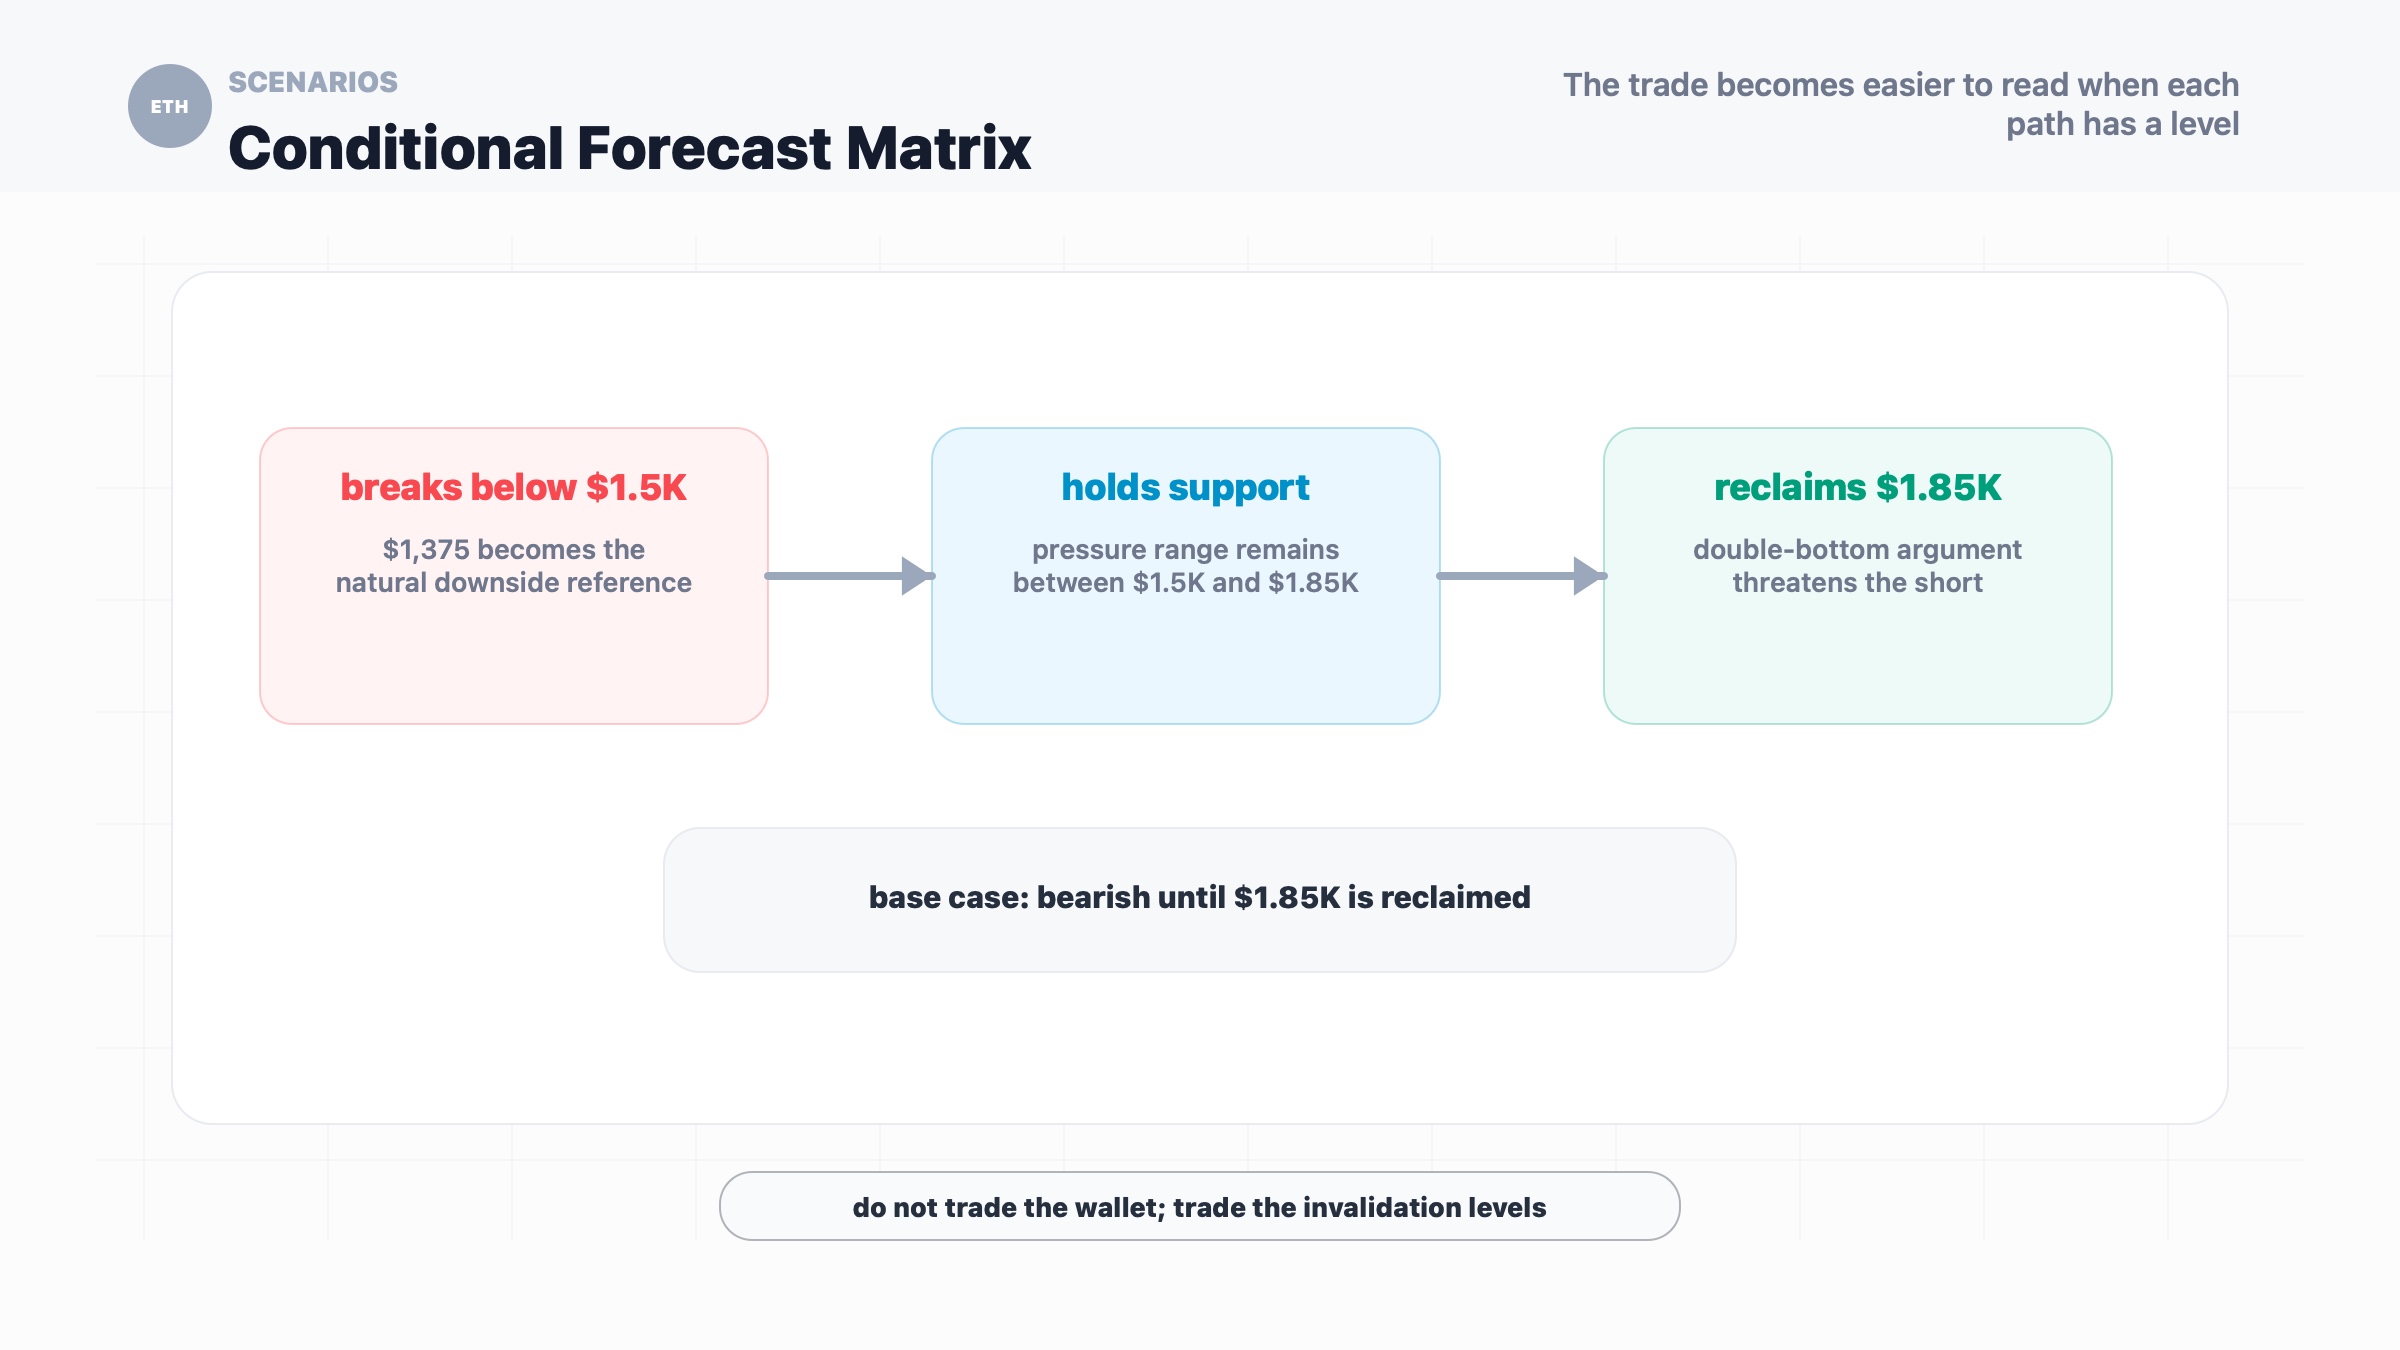
If ETH loses $1,500-$1,512 with expanding volume, the market may treat the whale short as aligned with the broader breakdown. In that scenario, the $1,375 target becomes the natural downside reference, and bulls would need a fast reclaim of $1,500 to avoid a deeper momentum flush.
If ETH holds $1,500-$1,512 but remains below $1,850, the setup becomes a tense range rather than a confirmed reversal. The whale position can stay profitable, but the short becomes less comfortable because support is still alive.
If ETH reclaims $1,850 on a daily close, the bearish setup changes materially. That would confirm the double-bottom neckline discussed by Cointelegraph and shift attention toward the $2,150-$2,190 zone, where the whale's short could face liquidation or forced risk reduction.
My base case is cautious and level-driven: ETH has not invalidated the bearish structure, but the short is crowded around a support zone where mistakes can get expensive quickly.
Investment Takeaway
The tempting mistake is to treat the whale as the story.
The better way to read it is to treat the whale as a stress indicator. A large 20x ETH short near $1,500 tells us where a sophisticated trader sees weakness, where copycat traders may gather, and where the trade becomes wrong if the market pushes back.
For traders, the map is unusually clear. Below $1,500, the bearish case has momentum. Between $1,500 and $1,850, ETH is in a pressure zone where both sides can make a plausible argument. Above $1,850, the short thesis loses its cleanest technical support.
For longer-term ETH investors, the bigger question is not whether one wallet is right. The question is whether Ethereum can stop turning every rebound into a lower high while broader risk sentiment and foundation-related concerns weigh on the asset.
Until that changes, the chart deserves respect. So does the squeeze risk.
Sources
- Cointelegraph original URL from downloaded article: Ethereum Whale Who Shorted October 2025 Crash Returns With $19.7M Short ETH Bet (https://cointelegraph.com/markets/ethereum-whale-who-shorted-october-2025-crash-returns-with-a-197m-short-eth-bet)
- Cointelegraph via TradingView: Ethereum whale who shorted October 2025 crash opens $19.7M ETH short position (https://www.tradingview.com/news/cointelegraph%3A019ea6896094b%3A0-ethereum-whale-who-shorted-october-2025-crash-opens-19-7m-eth-short-position/)
- TradingView: BINANCE:ETHUSDT 4-hour chart (https://www.tradingview.com/chart/?symbol=BINANCE%3AETHUSDT&interval=240)
|
DISCLAIMER:
1. All content on this website (including but not limited to articles, data, charts, and analyses) is for general informational purposes only and does not constitute any form of investment advice, trading recommendation, or financial guidance. 2. Cryptocurrencies and digital assets are subject to extreme price volatility and high investment risk; you may lose part or all of your principal. Past performance does not predict future results. 3. The information on this website is based on sources we believe to be reliable, but we do not guarantee its accuracy, completeness, or timeliness. Any investment decisions made based on this website’s information are at your own risk. 4. We strongly recommend that you conduct your own thorough research and consult an independent, licensed financial advisor before making any investment decisions. |
Recommended reading
Latest News