
Key Takeaways
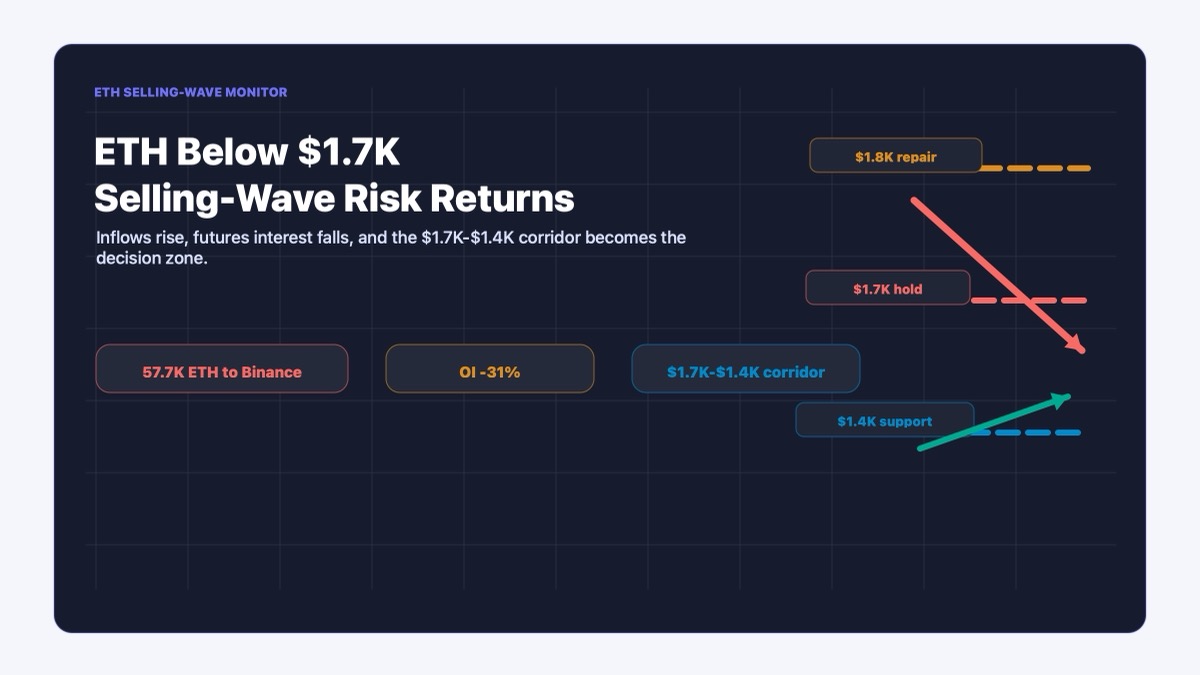
- ETH market data has weakened, with Binance seeing about 57,700 ETH in net inflows and Ether futures open interest falling 31% over the past month.
- The main danger is not just price weakness. It is the combination of more ETH moving toward exchanges, weaker new demand and less speculative conviction.
- ETH needs to hold the $1.7K area and reclaim $1.8K with volume; otherwise, the $1.4K region remains the obvious stress test.
What Happened
Ether is sitting in one of those market zones where everyone can see the same chart and still argue about what it means.
The hopeful version is simple: ETH has already fallen hard, leverage has cooled, RSI readings are washed out, and the market is near a major demand zone. That is the kind of setup where bottoms sometimes start forming.
The less comfortable version is also simple: ETH is still struggling around $1.7K, exchange inflows are rising, futures interest is falling, and analysts are warning that another selling wave could arrive if buyers fail to defend the current range.
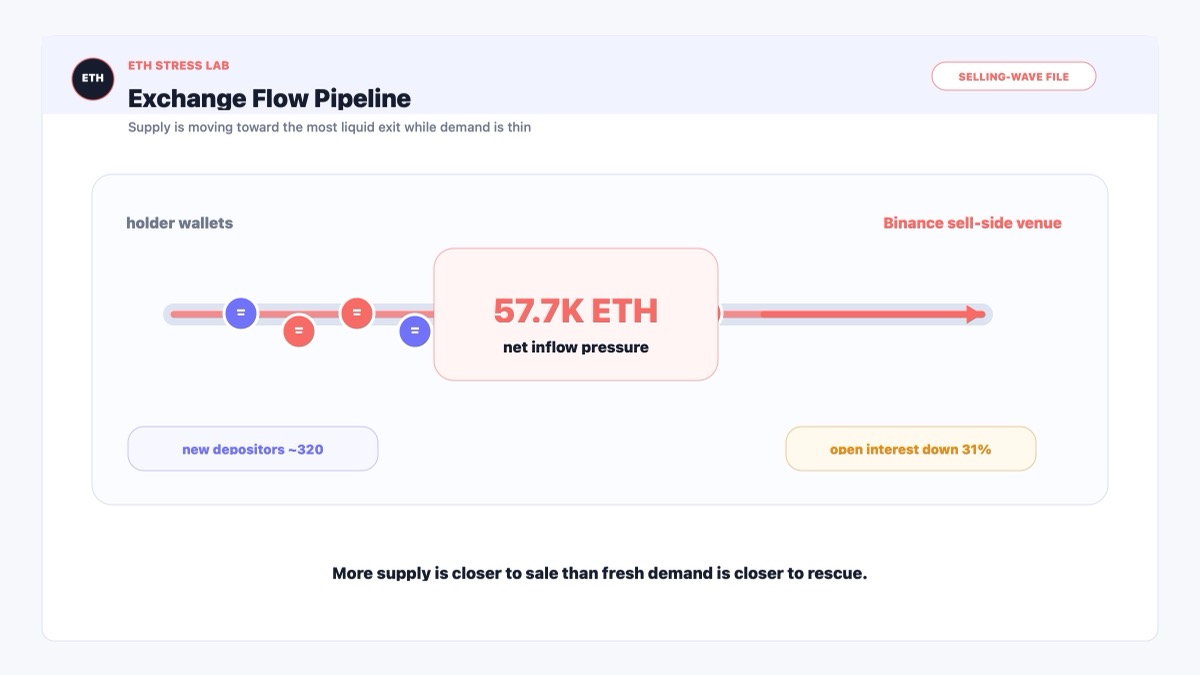
According to the Cointelegraph report, CryptoQuant analyst Pelin Ay noted that roughly 57,700 ETH flowed into Binance on a net basis over the past few days. That matters because large net inflows to a liquid exchange often mean supply is moving closer to a place where it can be sold.
At the same time, the number of new ETH depositors was around 320 addresses, well below levels seen during stronger demand phases. In plain English, more supply is arriving at the door, but the line of fresh buyers does not look especially crowded.
The derivatives side is not exactly cheering either. Ether futures open interest fell from $15 billion to $10.3 billion over the past month, a drop of roughly 31% and the lowest aggregate reading since April 2025. The estimated leverage ratio also fell to 0.83 from a June 2 high of 1.10.
Lower leverage can reduce forced-liquidation chaos. That part is good. But it can also mean traders are stepping back because conviction is fading. That part is less fun.
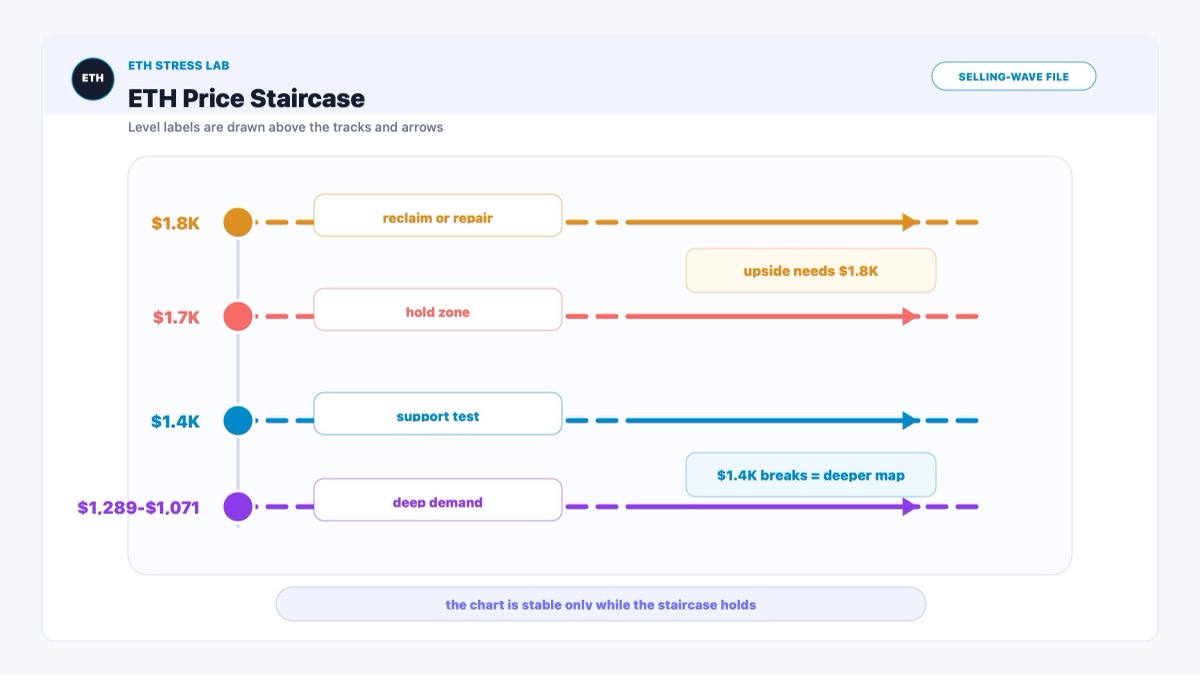
The chart zone now being watched is $1,700 to $1,400. Cointelegraph noted that the April 2025 low near $1,384 is the closest external liquidity target if ETH weakness continues. Below that, the broader demand zone from January 2023 sits between $1,289 and $1,071.
So the market is not asking an abstract question. It is asking a very practical one: are sellers running out of ammunition, or are buyers running out of patience?
Why This Matters for Bitcoin and Crypto Markets
ETH is not just another altcoin. It is the largest smart-contract asset, the center of a huge amount of DeFi collateral, and one of the main ways traders express risk appetite outside Bitcoin.
When ETH weakens in a clean, contained way, the market can usually digest it. Prices fall, leverage resets, buyers step in, and the system moves on after a bit of theatrical groaning.
But when ETH weakens while exchange inflows rise and open interest falls, the message becomes more complicated. The market is not only repricing ETH. It is also showing that some holders may be preparing to sell while leveraged traders are becoming less eager to fight the move.
That has two wider effects.
First, it can keep pressure on the broader altcoin market. Many altcoins behave like ETH with extra caffeine. If ETH cannot stabilize near a major demand zone, smaller assets often lose the permission structure they need to rebound.
Second, it can change how capital rotates inside crypto. Bitcoin may look relatively stronger if traders want crypto exposure but do not want the same smart-contract or altcoin beta. That does not automatically make Bitcoin bullish. It simply means Bitcoin can become the least complicated place to hide inside the same risky neighborhood.
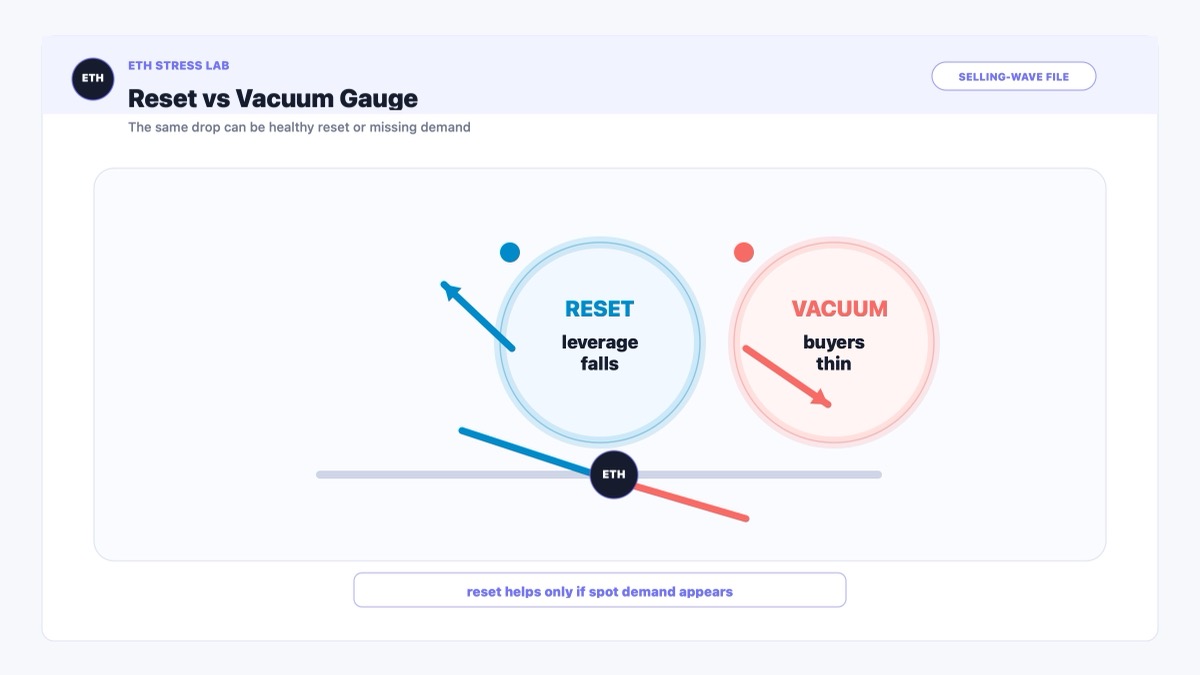
The important distinction is between a leverage reset and a demand vacuum. A leverage reset can be healthy. It removes excess. It gives the market room to breathe. A demand vacuum is different. It means price can look cheap and still keep sliding because the buyers who are supposed to rescue it are standing around with their hands in their pockets.
ETH is now trying to prove this is the first thing, not the second.
Historical Parallel
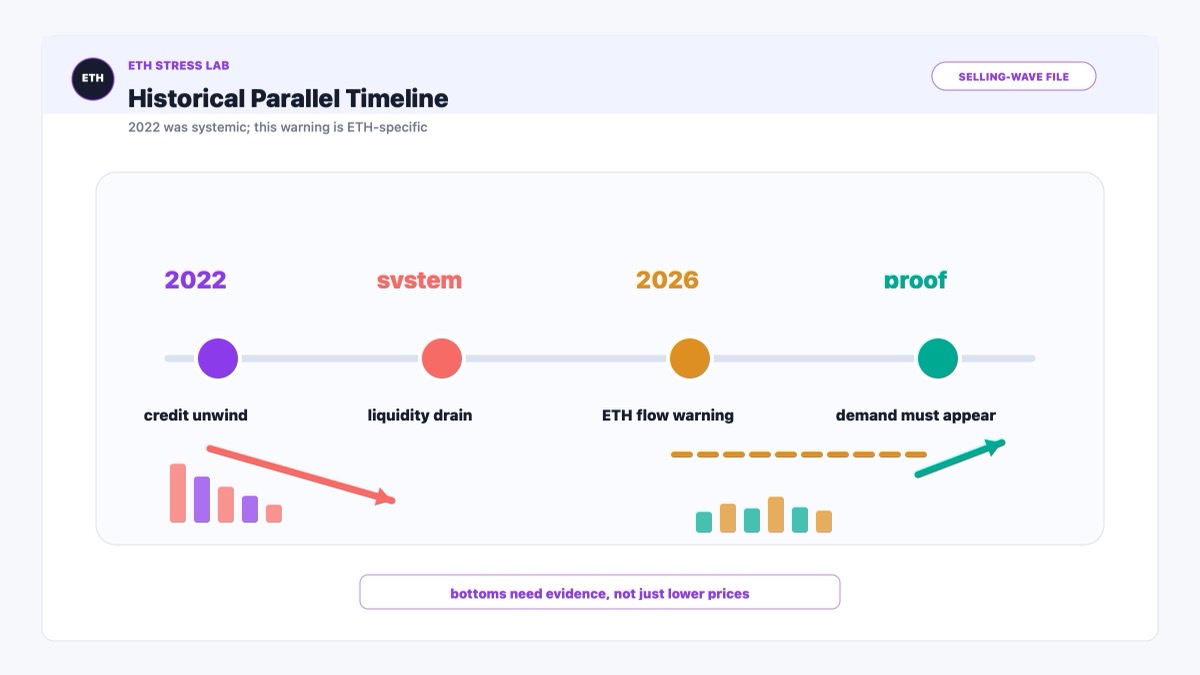
A useful historical parallel is the 2022 Ethereum drawdown after the broader crypto credit unwind. The exact catalysts were different, but the market mechanics rhyme in an uncomfortable way.
In 2022, ETH was not simply falling because a chart looked bad. It was falling because several layers of the crypto system were being forced to reduce risk at the same time. Leverage came down, liquidity got thinner, and coins that had been treated like long-term conviction positions suddenly became objects people might need to sell. In that environment, exchange flows and derivatives behavior mattered because they helped show whether price weakness was just fear on a screen or actual supply looking for an exit.
That is the similarity with the current setup. The present story also involves ETH near a major demand zone, cooling leverage and concern that exchange inflows could become sell pressure. The market is again trying to separate two very different ideas: a healthy washout and a new leg lower. They can look weirdly similar at the beginning, which is why this kind of zone is so annoying to trade.
The difference is that 2022 was a systemic deleveraging cycle, while the current report points to a more specific ETH market structure problem. There is no need to assume the same kind of industry-wide forced unwind. The present warning is narrower: Binance inflows are elevated, new demand looks muted, open interest has dropped, and ETH is sitting near a technically important range.
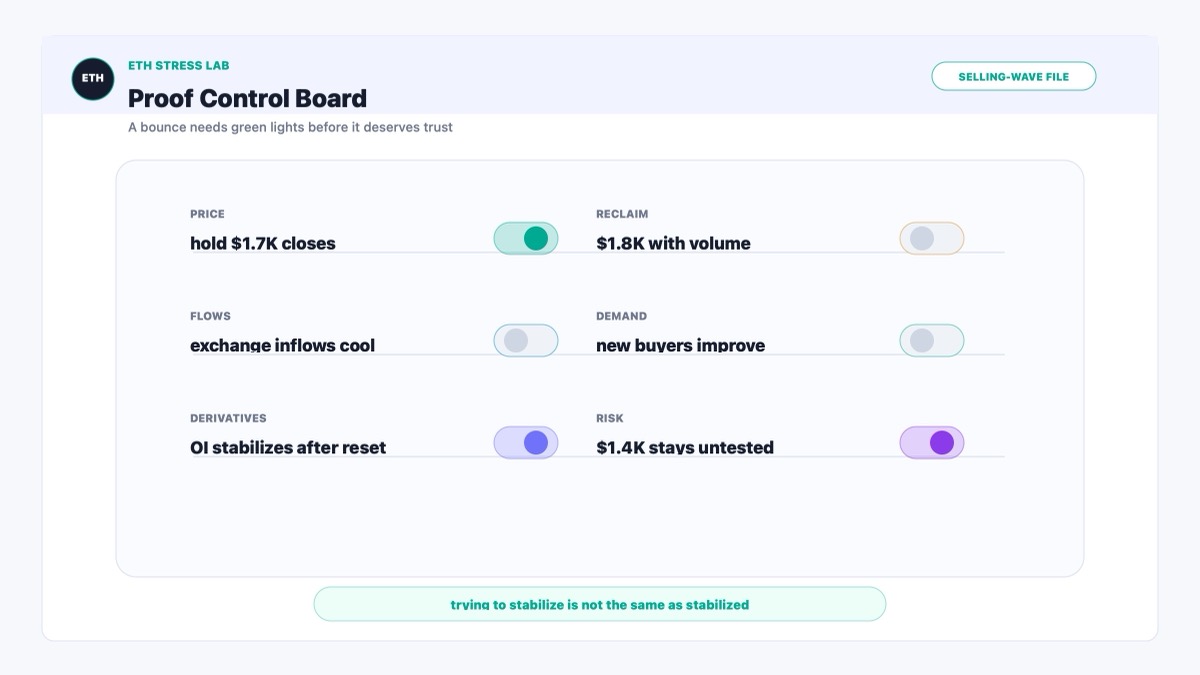
The lesson for today is not that ETH must repeat 2022. Markets are not photocopiers. The lesson is that bottoms need proof. Oversold readings and lower leverage can help, but they are not enough if exchange supply keeps rising and spot demand stays thin. For ETH, that proof would look like stabilization above $1.7K, a serious reclaim of $1.8K, and evidence that buyers are doing more than catching a falling chart because it finally looks cheap.
Ethereum Price Reaction and K-Line Analysis
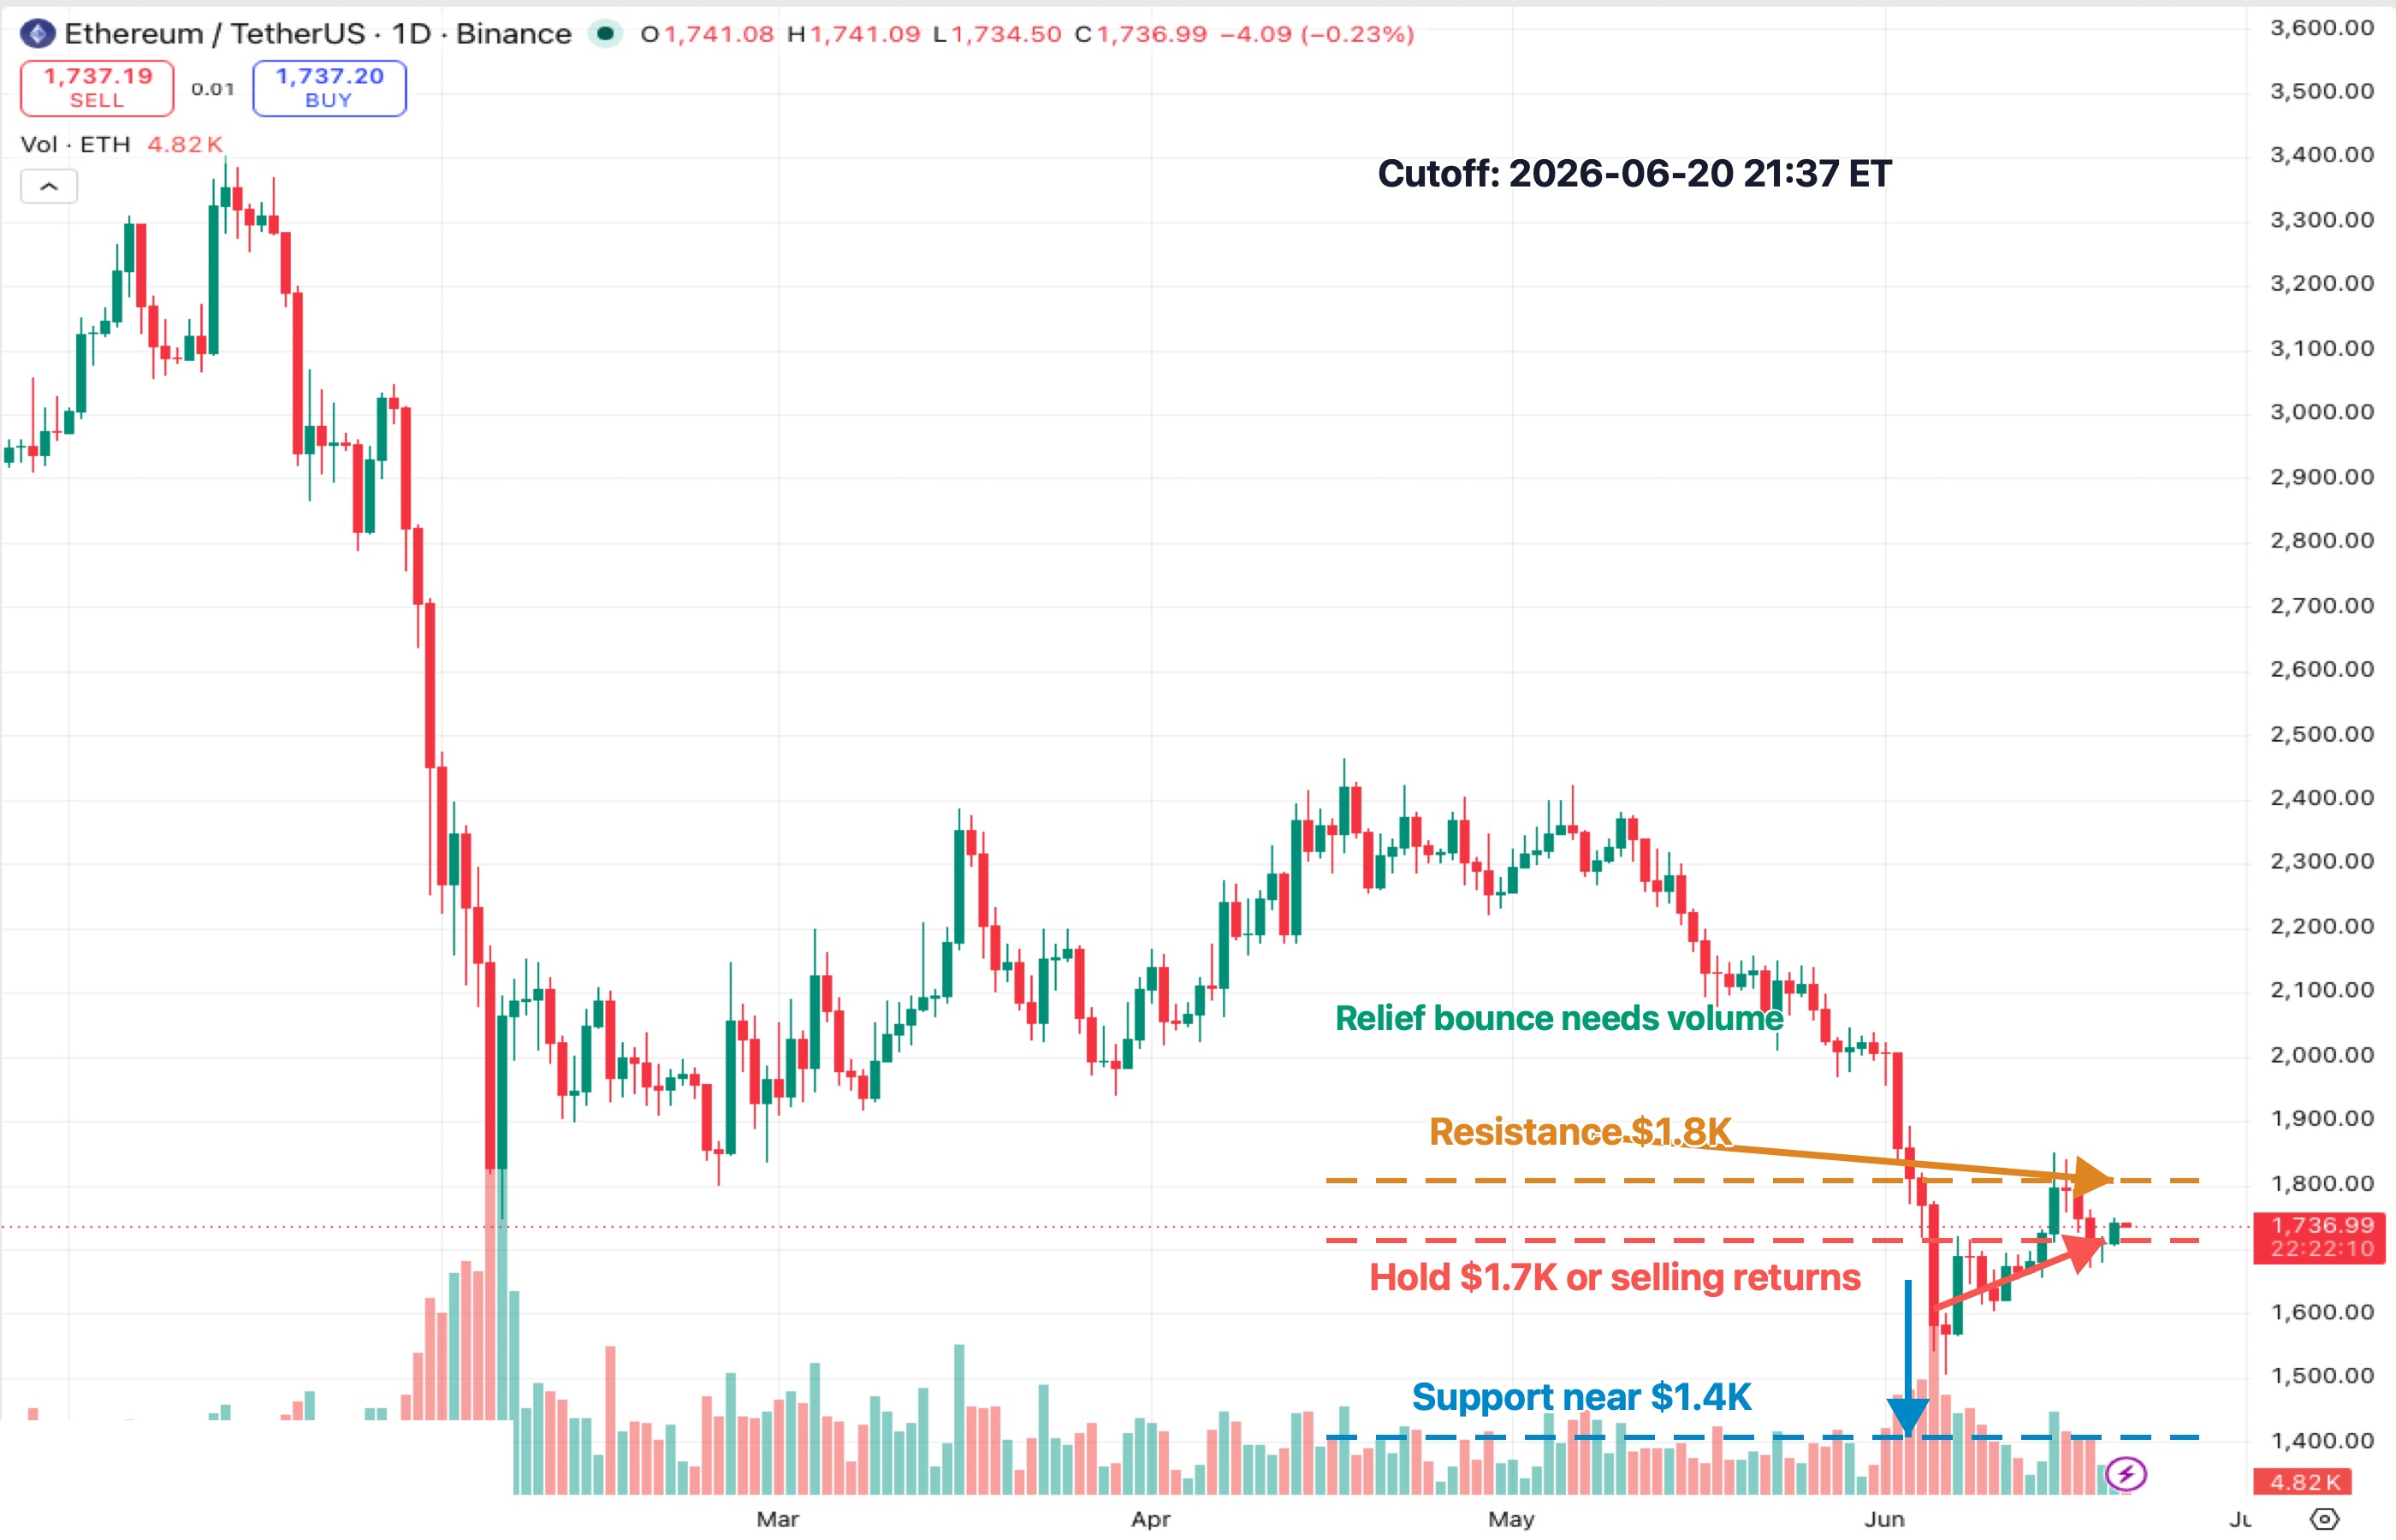
The ETHUSDT daily chart shows why analysts are focused on this zone. ETH has already suffered a deep decline from the spring range, then bounced from the early-June washout area near the $1.4K region. The bounce matters, but it has not yet repaired the structure.
The first problem is the $1.7K area. If ETH can hold above it, the market can argue that the recent bounce is becoming a base. If ETH loses it cleanly, the chart starts pointing back toward the lower part of the demand zone.
The second problem is $1.8K. That is where the relief bounce has to start looking less like a reflex and more like buyers actually mean it. A reclaim of $1.8K with stronger volume would weaken the immediate selling-wave argument.
The third problem is $1.4K. This is the support area that traders do not want to see tested too often. Support is a bit like a door in a bad action movie. The first hit is dramatic. The second hit is worrying. By the third hit, you start wondering whether the hinges have a future.
For now, the chart is not confirming disaster. It is also not confirming recovery. It is holding ETH in the awkward middle, where the next clean daily move matters more than the last emotional candle.
Key Levels to Watch
$1.8K resistance: ETH needs to reclaim this level to show that the rebound has real follow-through. Without that, upside attempts can keep looking like relief rallies.
$1.7K hold zone: This is the immediate line between stabilization and renewed downside pressure. Holding it keeps the short-term recovery alive.
$1.4K support and $1,384 liquidity: The April 2025 low near $1,384 is the nearest external liquidity target mentioned in the source report. A break below this area would make the selling-wave thesis much harder to dismiss.
$1,289-$1,071 deeper demand zone: This lower zone matters if ETH fails to defend the $1.4K area. It is not the base case yet, but it is the next structural map point.
Conditional Forecast
If ETH holds $1.7K and pushes back above $1.8K with stronger volume, the market can begin treating the recent drop as a leverage reset rather than the start of another sustained selloff. That would not instantly make ETH bullish, but it would reduce the urgency of the $1.4K downside target.
If ETH loses $1.7K and daily candles begin closing beneath it, the next logical test is the $1.4K area. In that scenario, the exchange inflow data becomes more important because the chart would be confirming that buyers are not absorbing supply fast enough.
If ETH breaks below $1,384, attention likely shifts to the wider $1,289-$1,071 demand zone. That would suggest the market is not merely digesting a selloff. It would suggest the selloff is still searching for a level where real spot demand appears.
If ETH/BTC continues trending lower while ETH/USD struggles, Bitcoin may keep absorbing the cleaner crypto risk bid. That would pressure altcoins broadly, because ETH often acts as the bridge between Bitcoin strength and wider altcoin confidence.
Investment Takeaway
The investment takeaway is not “ETH is doomed.” That is too tidy, and markets rarely reward tidy thinking for long.
The better takeaway is that ETH is in a proof zone. The asset has enough oversold evidence to justify watching for a bottom, but it also has enough weak-flow evidence to make premature confidence dangerous.
For traders, the $1.7K-$1.8K zone is the near-term decision area. For investors, the more important question is whether exchange inflows cool and demand begins to improve. A price bounce without better demand is just a bounce. A price bounce with improving demand is the beginning of an argument.
Until that argument gets stronger, ETH should be treated as a market trying to stabilize, not a market that has already stabilized.
Sources
- Cointelegraph: Ether analysts predict another selling wave as ETH struggles to overcome $1.7K
- CryptoQuant: A New Selling Wave May Be Approaching for Ethereum
- TradingView: BINANCE:ETHUSDT daily chart
|
DISCLAIMER:
1. All content on this website (including but not limited to articles, data, charts, and analyses) is for general informational purposes only and does not constitute any form of investment advice, trading recommendation, or financial guidance. 2. Cryptocurrencies and digital assets are subject to extreme price volatility and high investment risk; you may lose part or all of your principal. Past performance does not predict future results. 3. The information on this website is based on sources we believe to be reliable, but we do not guarantee its accuracy, completeness, or timeliness. Any investment decisions made based on this website’s information are at your own risk. 4. We strongly recommend that you conduct your own thorough research and consult an independent, licensed financial advisor before making any investment decisions. |
Recommended reading
Latest News