
Key Takeaways
- Ether's latest sell-off is not just a red candle. It is a stress test of leveraged longs, ETF demand and Ethereum's DeFi recovery story at the same time.
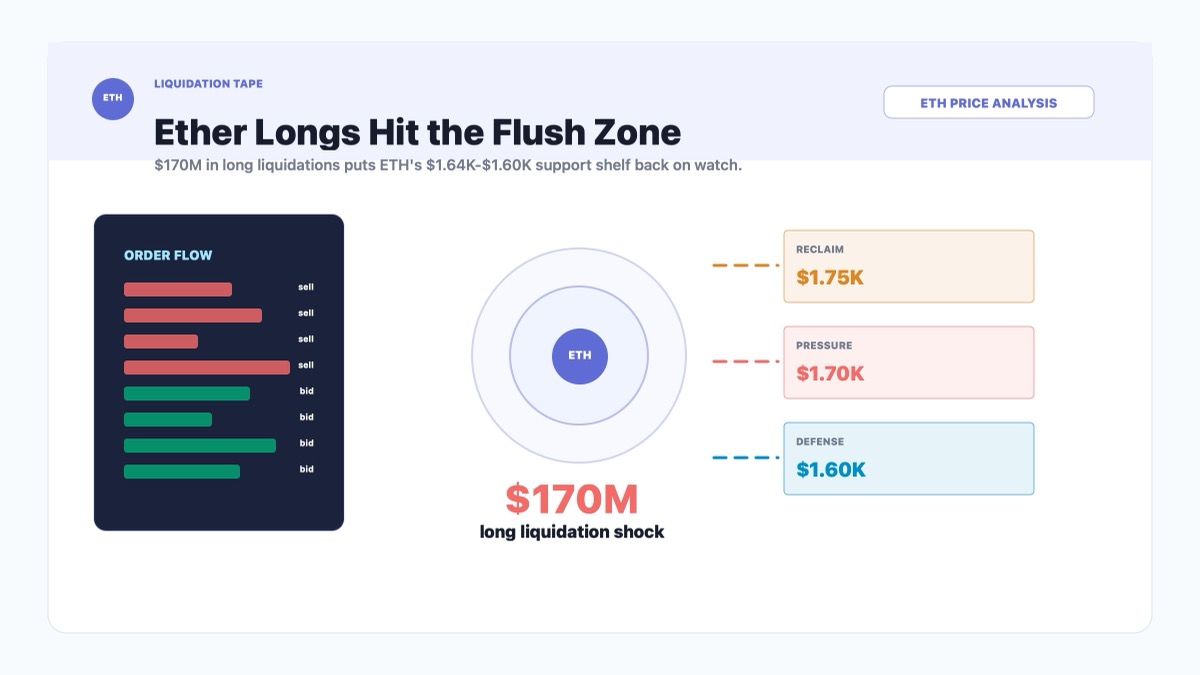
- Cointelegraph reports that ETH fell 5% on Tuesday, triggering about $170 million in liquidations of bullish leveraged positions.
- Negative ETH funding rates and six straight weeks of spot Ether ETF outflows show that bulls are no longer getting an easy vote from derivatives or institutional flows.
- The short-term chart now turns on whether ETH can reclaim the $1,700-$1,750 area or slips back toward $1,640 and $1,600 support.
What Happened
Ether had the kind of trading day that turns optimism into a meeting.
According to Cointelegraph, ETH price corrected by about 5% on Tuesday, erasing gains from the previous 12 days and triggering roughly $170 million in liquidations of bullish leveraged ETH positions. That means a lot of traders who were positioned for upside were not merely wrong; they were wrong with borrowed confidence. The market tends to be less forgiving about the second part.
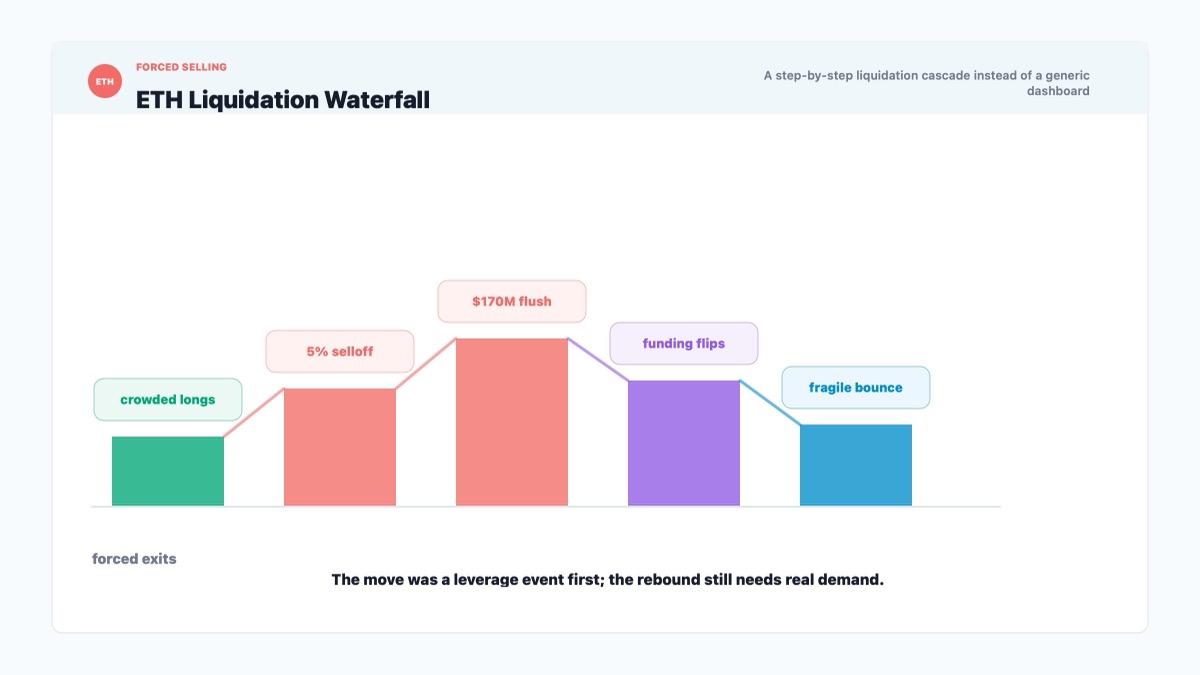
The article says the pressure came from several directions at once.
First, ETH perpetual futures funding briefly flipped into deeply negative territory, which means shorts were paying to keep bearish positions open. The current 3% annualized level still signals a lack of confidence from bulls.
Second, ETH has lagged the broader crypto market. Cointelegraph reports that Ether declined 20% over 30 days, compared with a 17% drop in total crypto market capitalization. That is not a catastrophic divergence, but it is enough to tell investors that ETH is not leading the rebound.
Third, the Ethereum ecosystem is dealing with weaker activity. The article says aggregate decentralized application total value locked fell 23% over three months as multiple projects shut down. Ethereum still has the largest DeFi footprint, with about $38 billion in DeFi TVL and a 53% market share, but leadership is less comforting when the whole category is shrinking.
There is also an institutional-flow problem. US-listed spot Ether ETFs have posted net outflows for six consecutive weeks, with about $910 million leaving since mid-May and total net assets falling to $9.4 billion, according to the article's SoSoValue-sourced data.
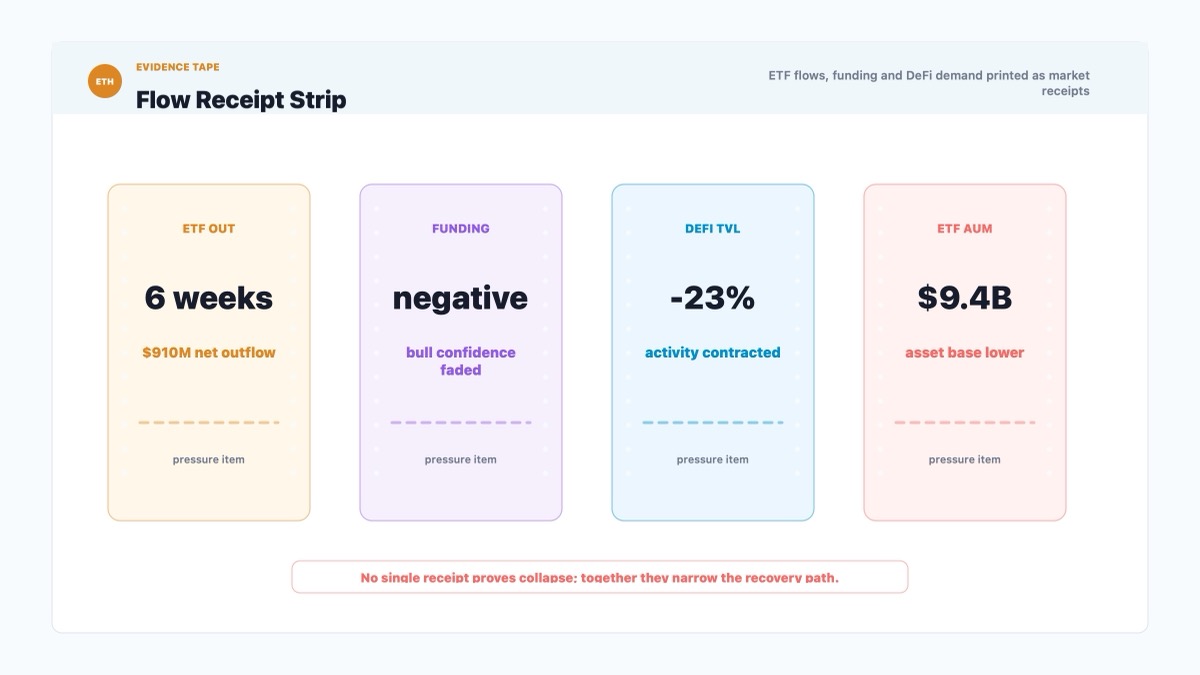
Then came the governance-adjacent headline: the Ethereum Foundation announced a restructuring tied to a 40% budget cut and let go of 20% of its workforce. Ethereum does not depend entirely on the Foundation, but markets do not always pause to read the org chart before selling.
Why This Matters for Bitcoin and Crypto Markets
This matters because ETH is both an asset and a weather system.
As an asset, ETH has its own problems: weaker ETF flows, lower staking yield than US money market yields, falling DeFi activity, and liquidation pressure after a crowded long trade. Those are ETH-specific concerns.
As a weather system, ETH tells the rest of crypto something about risk appetite outside Bitcoin. If Bitcoin is the market's reserve asset, Ether is often the market's working capital asset. It sits closer to DeFi, staking, layer-2 activity, DEX volume and application demand. When ETH weakens, it often means the market is becoming less willing to pay for crypto utility stories before the usage data improves.
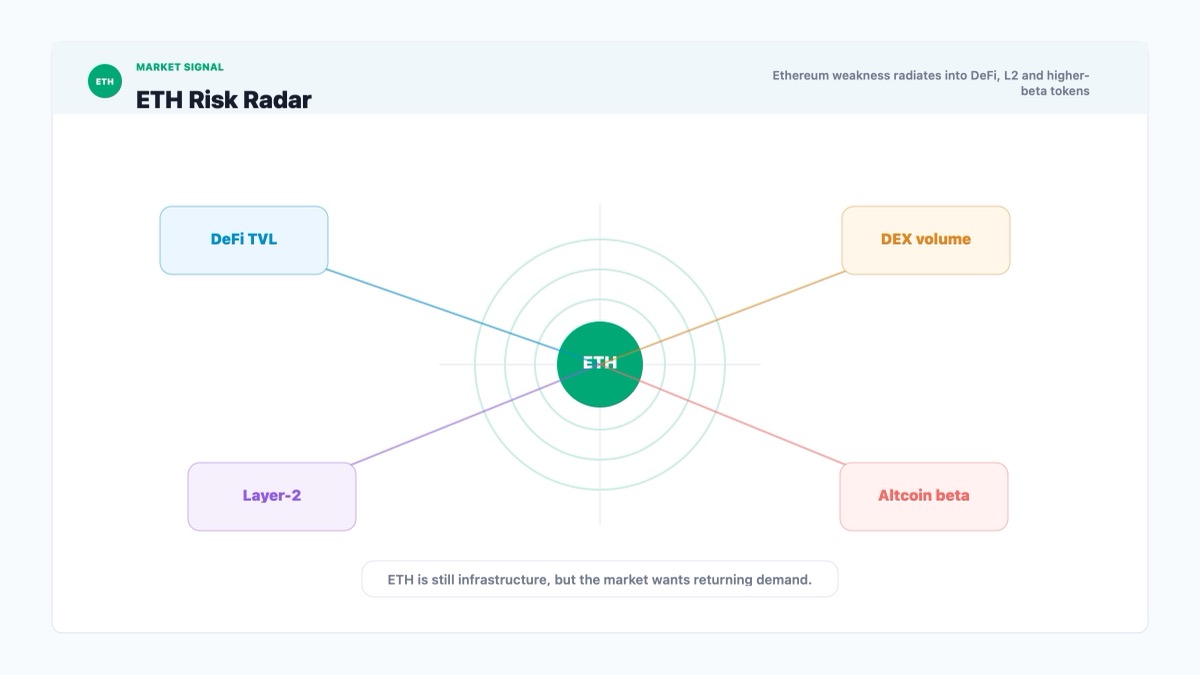
That is the deeper issue here. Ethereum still has dominant infrastructure. The article notes that Ethereum holds a 53% share of DeFi TVL and that its ecosystem, including layer-2 networks, accounts for 43% of decentralized exchange volumes. Those numbers say Ethereum remains the main venue for institutional-grade onchain activity.
But market prices do not reward "still dominant" forever if the demand curve is moving the wrong way.
If DApp activity is shrinking, ETF flows are negative, and leveraged longs are being liquidated, the market starts asking a meaner question: not "Is Ethereum important?" but "What is the next buyer paying for right now?"
For Bitcoin, the spillover is sentiment. BTC struggling near $62,000 already makes the broader market cautious. ETH liquidations add another layer because altcoin risk usually depends on ETH holding together. If ETH cannot stabilize, investors may cut risk across DeFi tokens, layer-2 assets and higher-beta altcoins even if Bitcoin itself avoids a deeper breakdown.
Historical Parallel
A useful historical comparison is the 2022 crypto deleveraging cycle, especially the period when ETH and the broader DeFi market were being repriced after the easy-money trade broke. The comparison is not perfect, and it should not be treated as a prediction machine. But it is useful because the mechanism rhymes.
In 2022, ETH was pressured by a mix of macro tightening, forced liquidations, shrinking risk appetite and declining confidence in crypto-native yield structures. The important point was not that every seller had the same reason. They did not. The important point was that different reasons led to the same action: reduce exposure, unwind leverage, and stop paying premium prices for future onchain demand.
The current setup has a smaller and more specific version of that same structure. ETH longs were liquidated. Funding turned negative. Spot Ether ETFs saw persistent outflows. DeFi TVL contracted. The Ethereum Foundation restructuring added an awkward headline at exactly the moment investors were already looking for reasons not to add risk.
The difference is scale. The 2022 episode became a systemic credit unwind involving failed lenders, broken balance sheets and broad crypto contagion. This article describes a market-confidence and positioning problem, not a confirmed solvency crisis. That distinction matters. A painful liquidation event can clean out excessive leverage without becoming a full cycle collapse.
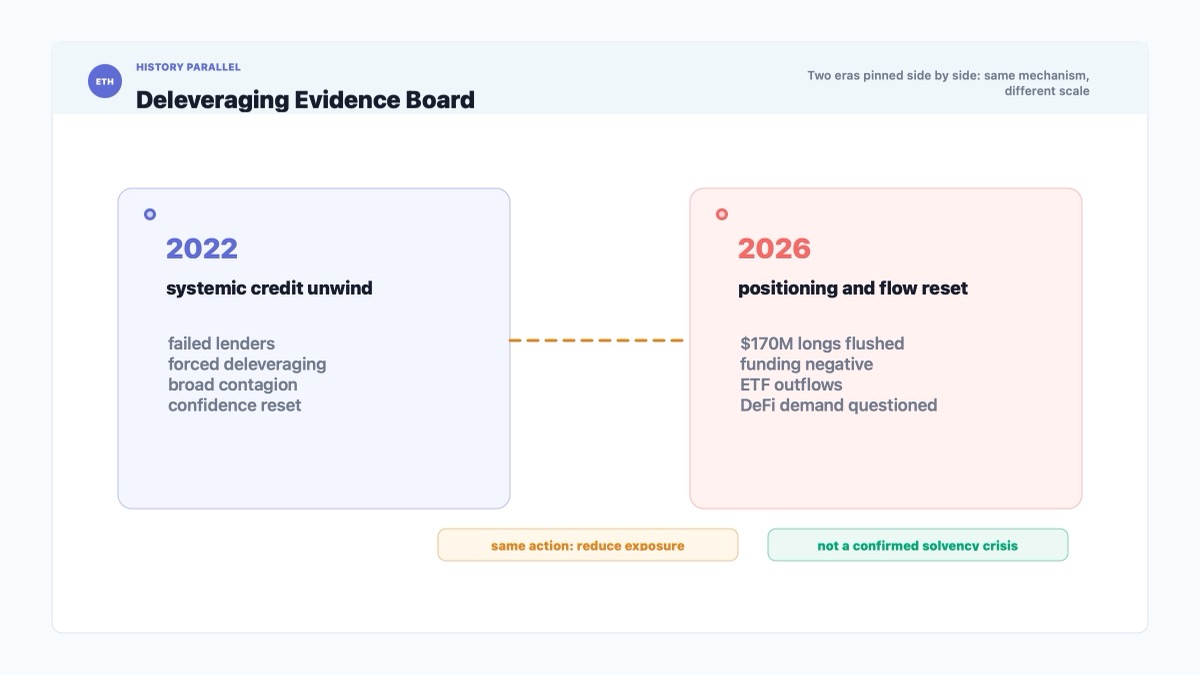
The lesson is that ETH support should be judged by absorption, not vibes. If price stabilizes while ETF outflows slow and funding normalizes, the market can argue that leverage was flushed out. If ETH keeps losing support while institutional flows stay negative, the chart begins to look less like a dip and more like a repricing of Ethereum's demand story.
Ethereum Price Reaction and K-Line Analysis
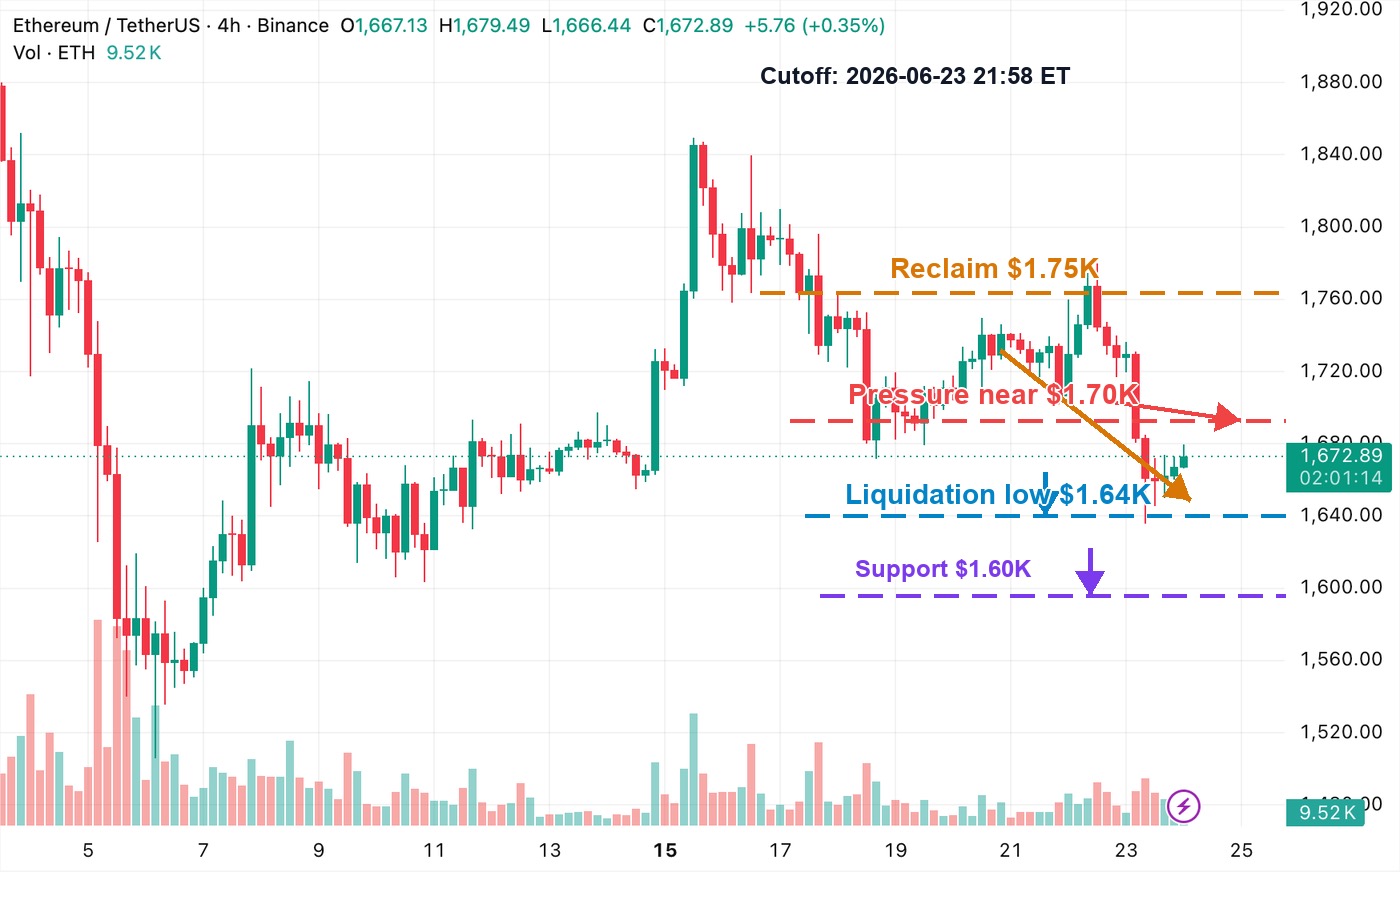
The 4-hour chart fits this news better than a long-term structure chart because the article is built around a fresh liquidation event and a short-term confidence break.
ETH's latest drop pushed price from the low-$1,700s toward the $1,640 area before a small rebound. That matters because the chart is no longer asking whether ETH can make a beautiful upside continuation. It is asking a less glamorous question: can buyers repair the damage quickly enough to stop sellers from pressing again?
The first pressure zone is around $1,700. ETH is currently near that area but has not cleanly reclaimed it with authority. A market can bounce after liquidations simply because forced sellers are gone for the moment. That is relief, not necessarily demand.
The more constructive reclaim zone is around $1,750. A move back above that level would suggest ETH is recovering the range that broke during the liquidation move. It would not erase the ETF outflow problem or the weaker DeFi backdrop, but it would tell traders that the liquidation flush did not permanently reset the short-term structure lower.
The downside levels are easier to see. The liquidation low near $1,640 is the immediate line. If ETH breaks that area again, the market will likely test whether $1,600 can act as the next support shelf.
Volume also matters here. The drop came with heavier selling activity, while the rebound has so far looked more controlled than explosive. That fits the article's broader message: there is still enough Ethereum ecosystem strength to avoid a simple doom story, but not enough current demand to make bulls comfortable.
Key Levels to Watch
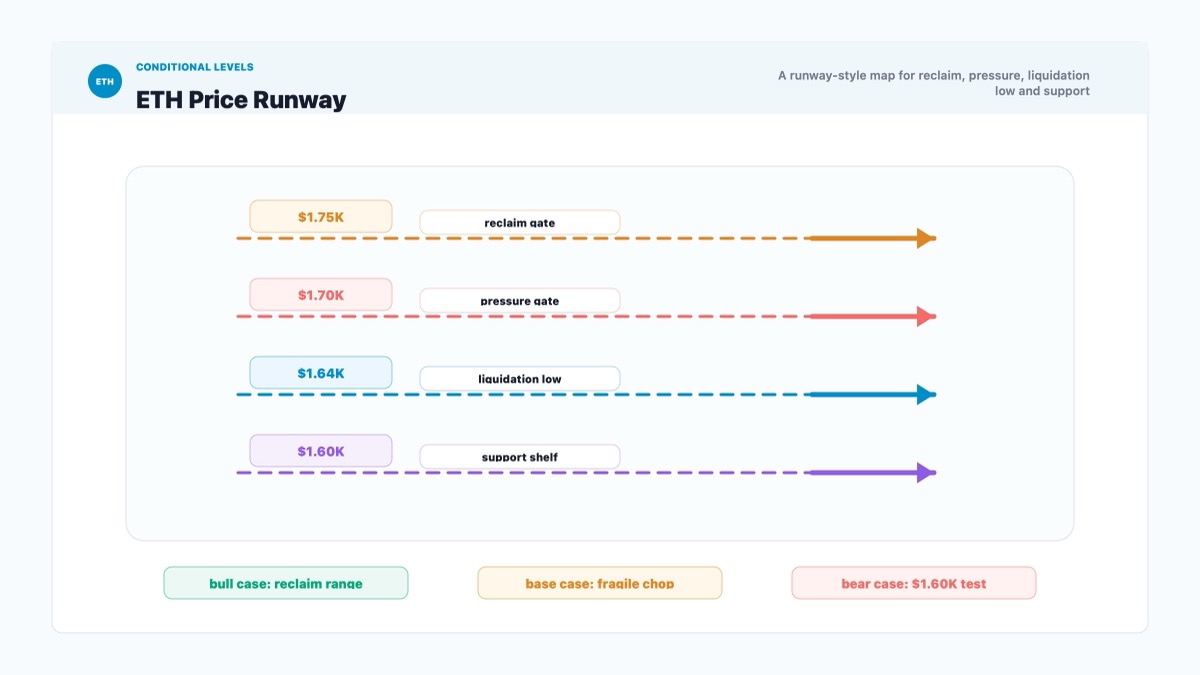
$1,750 reclaim level: ETH needs to recover this area to make the liquidation move look like a failed breakdown rather than a new lower range.
$1,700 pressure zone: This is the first psychological repair level. Staying below it keeps traders focused on weak funding and ETF outflows.
$1,640 liquidation low: This is the short-term support created by the liquidation flush. Losing it would show that sellers are not done testing downside.
$1,600 support: This is the next clean downside level if ETH cannot hold the liquidation low.
ETF flow trend: Not a chart level, but still a market level in practice. ETH needs ETF outflows to slow before institutional sentiment can look healthier.
Conditional Forecast
If ETH reclaims $1,700 and then pushes above $1,750 with stronger volume, the market may treat the $170 million liquidation event as a leverage reset. In that case, the bearish pressure is still real, but the immediate downside risk would look less urgent.
If ETH stays trapped between $1,640 and $1,700, the market remains fragile. That would suggest the liquidation flush removed some leverage but did not bring in enough fresh demand to repair confidence.
If ETH loses $1,640 and fails to recover quickly, the next downside test is likely around $1,600. A break there would make the ETF outflow and DeFi weakness narrative much harder for bulls to wave away.
The strongest bullish signal would be boring but important: funding normalizes, ETF outflows slow, ETH reclaims the broken range, and DeFi activity stops deteriorating. The strongest bearish signal would be the opposite: price loses $1,600 while the flow data keeps saying investors are still leaving.
Investment Takeaway
ETH is not doomed because one liquidation event hit the market. Liquidations happen. Leverage gets too confident, price moves against it, and the market sends everyone a bill.
The problem is that this liquidation event landed on top of several existing weaknesses: ETF outflows, weaker DApp activity, negative funding, lower relative yield and an Ethereum Foundation restructuring headline. None of those alone proves a collapse. Together, they make the recovery path narrower.
For investors, the practical view is conditional. Above $1,750, ETH starts repairing the short-term chart. Between $1,640 and $1,700, the market is still deciding whether the liquidation was a cleanup or the start of another leg lower. Below $1,600, the downside case becomes much cleaner.
Ethereum still owns the strongest DeFi footprint. But for now, the market is not paying for dominance by itself. It wants evidence that demand is returning. Until that shows up, ETH is less a victory lap and more a test.
Sources
- Cointelegraph: $170M Ether longs liquidated as crypto market tumbles: Is ETH doomed? (https://cointelegraph.com/markets/170m-ether-positions-liquidated-as-crypto-market-tumbles-is-eth-doomed)
- TradingView: BINANCE:ETHUSDT 4-hour chart (https://www.tradingview.com/chart/?symbol=BINANCE%3AETHUSDT&interval=240)
- Binance market data: ETHUSDT 4-hour klines (https://api.binance.com/api/v3/klines?symbol=ETHUSDT&interval=4h)
- DefiLlama data cited by Cointelegraph for Ethereum DeFi TVL and market share.
- SoSoValue data cited by Cointelegraph for US-listed spot Ether ETF weekly net flows.
- Laevitas data cited by Cointelegraph for ETH perpetual futures funding rates.
|
DISCLAIMER:
1. All content on this website (including but not limited to articles, data, charts, and analyses) is for general informational purposes only and does not constitute any form of investment advice, trading recommendation, or financial guidance. 2. Cryptocurrencies and digital assets are subject to extreme price volatility and high investment risk; you may lose part or all of your principal. Past performance does not predict future results. 3. The information on this website is based on sources we believe to be reliable, but we do not guarantee its accuracy, completeness, or timeliness. Any investment decisions made based on this website’s information are at your own risk. 4. We strongly recommend that you conduct your own thorough research and consult an independent, licensed financial advisor before making any investment decisions. |
Recommended reading

Latest News