Bitcoin Price Outlook: Gold Breaks 200-Day Average as BTC Bulls Watch Ratio
Key Takeaways
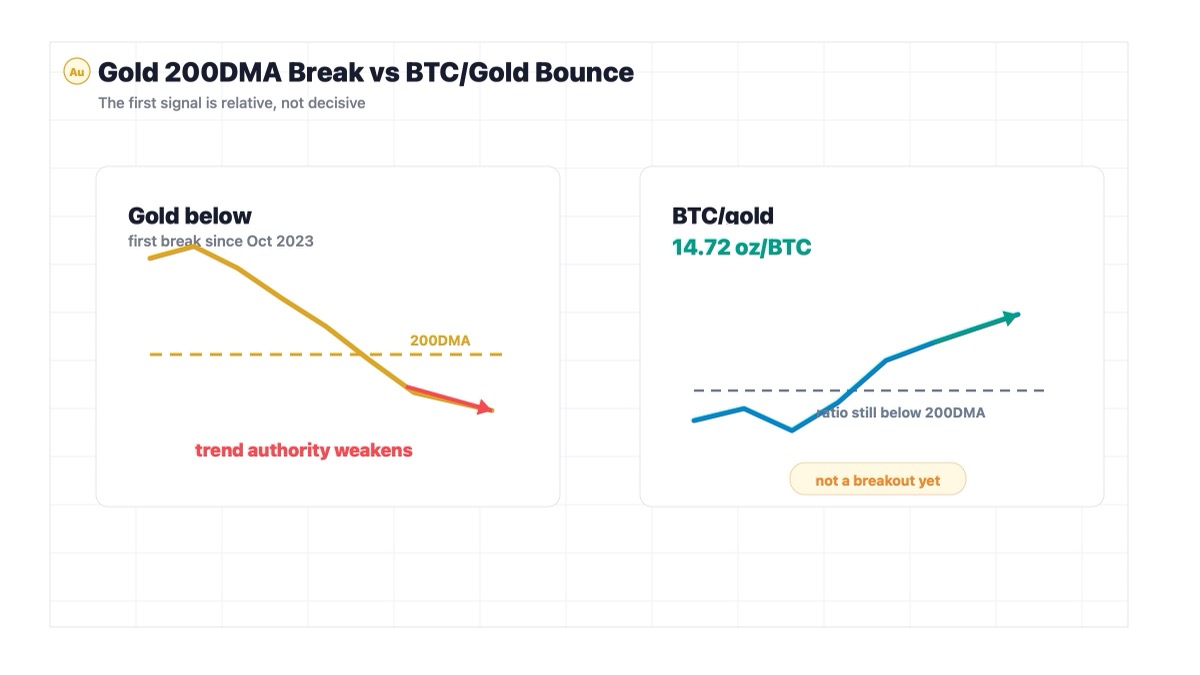
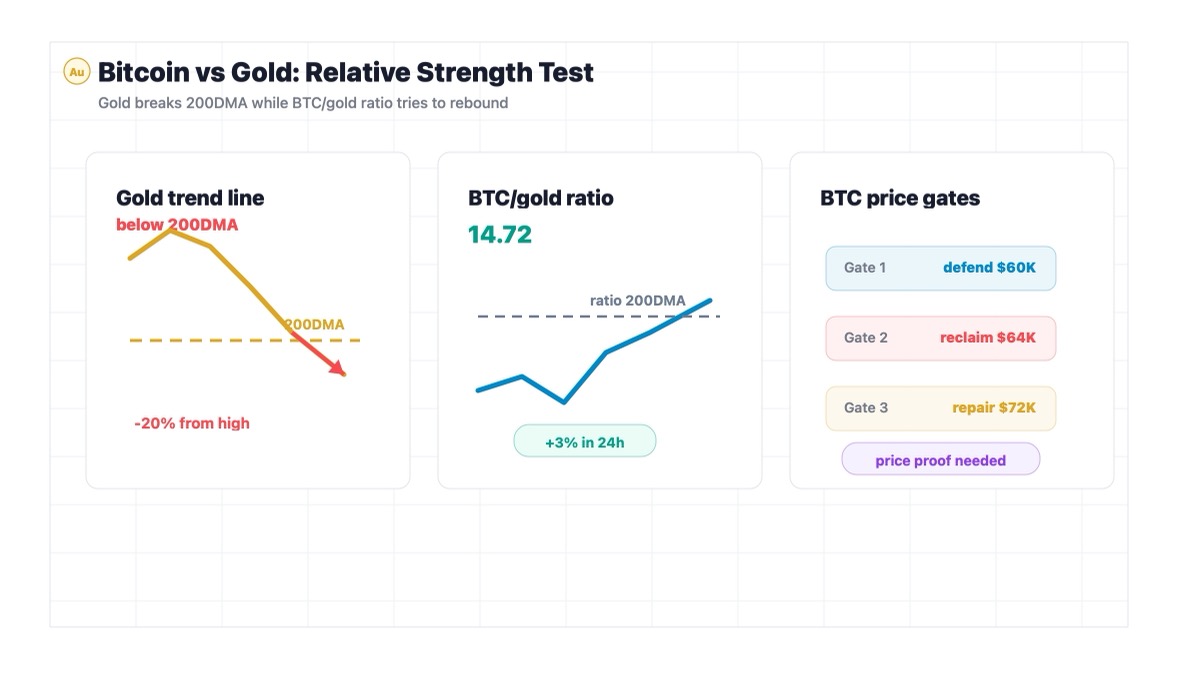
- Gold has fallen below its 200-day moving average for the first time since October 2023.
- The Bitcoin-to-gold ratio rose 3% over 24 hours to 14.72 ounces, giving BTC bulls a modest relative-strength signal.
- A stronger dollar and higher rate expectations still make the setup difficult for both gold and Bitcoin.
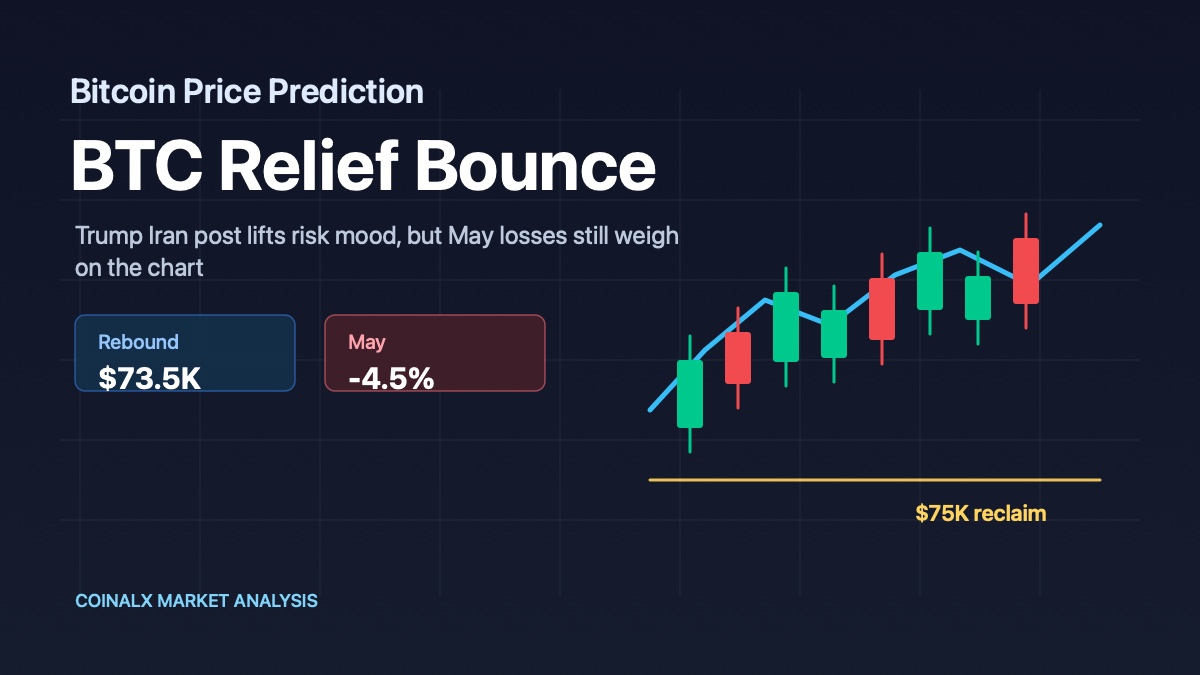
- BTC needs to reclaim $63K-$64K and defend $60K before the chart can treat this as more than a fragile rebound.
What Happened
Gold just did something that makes Bitcoin people sit up a little straighter.
The metal fell below its 200-day moving average, a long-term trend line that traders use as a rough border between "the uptrend is still fine" and "something has changed." It is not a magic line. Markets do not receive a formal letter from the 200DMA and politely obey it. But when an asset that has been treated as the cleanest debasement-trade winner slips under that line, the market usually pays attention.
According to the CoinDesk report, gold has now dropped more than 20% from its January record high near $5,600 per ounce and is trading below $4,300. That puts it in bear-market territory. The move matters because gold's previous rally was not random. It was built on a simple story: government debt is high, fiat money is losing credibility, and scarce stores of value should benefit.
Bitcoin lives in the neighborhood of that story.
That is why the Bitcoin-to-gold ratio matters here. The ratio measures how many ounces of gold one bitcoin can buy. It rose 3% over the past 24 hours to 14.72 ounces as BTC recovered toward $63,000. That is a small win for Bitcoin bulls, but not a victory parade. The same ratio is still roughly 70% below its December 2024 peak near 41 ounces, and it was rejected at its own 200-day moving average last month before Bitcoin fell below $60,000.
So the message is not "gold is weak, therefore Bitcoin wins."
The message is subtler: gold is losing some of its trend authority, while Bitcoin is trying to prove it can stop bleeding relative to gold. That is interesting. It is not yet conclusive.
Why This Matters for Bitcoin and Crypto Markets
The weird thing about Bitcoin and gold is that they are sometimes teammates and sometimes competitors.
When the market is worried about currency debasement, debt expansion and long-term purchasing power, both assets can benefit from the same instinct: get me out of paper promises and into something scarcer. In that world, gold and Bitcoin are two versions of the same psychological shelter, one ancient and one digital.
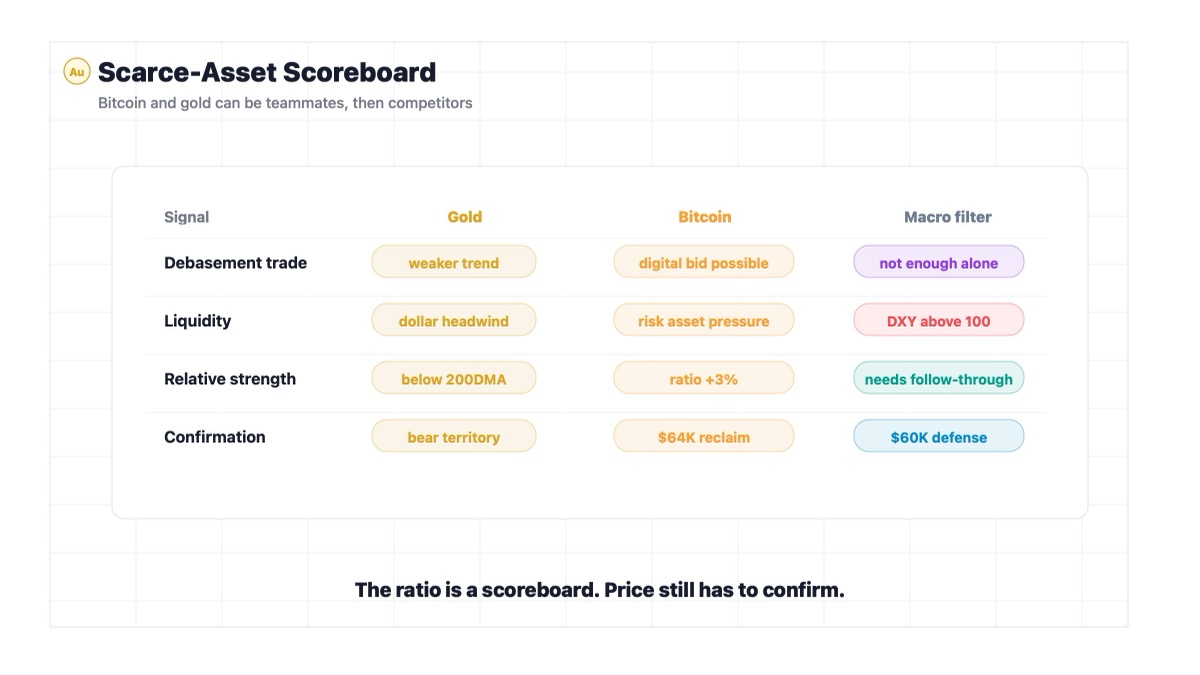
But when liquidity gets tight, they can start competing. Investors may not buy every scarce asset at once. They choose. They rebalance. They ask which store-of-value trade has cleaner momentum, better upside, or less immediate pain. That is where the Bitcoin-to-gold ratio becomes useful. It is not just a number. It is a scoreboard for which scarce-asset story is winning at the margin.
Right now, that scoreboard gives Bitcoin a tiny improvement, not a clean breakout.
Gold slipping below its 200DMA weakens one part of the old debasement trade. But the macro backdrop is not friendly enough to turn that into a simple BTC bull signal. The U.S. Dollar Index has moved back above 100, and a stronger dollar is usually a headwind for commodities and crypto because it tightens financial conditions. A stronger-than-expected U.S. jobs report also pushed markets to price in a higher chance of Federal Reserve tightening, with CME FedWatch cited in the report as assigning odds to a December 25 basis point hike.
That is the important tension. Bitcoin may be improving versus gold, but both are still trading inside a macro environment that does not love risk.
For BTC, the opportunity is relative strength. If Bitcoin can keep outperforming gold while gold's long-term trend weakens, the market may begin to test whether digital scarcity is regaining the better bid. The danger is that this becomes another false start, like last month's rejection at the ratio's 200DMA.
The ratio is whispering. Price still has to speak louder.
Historical Parallel: Gold's 2020 Peak and Bitcoin's Late-Cycle Catch-Up
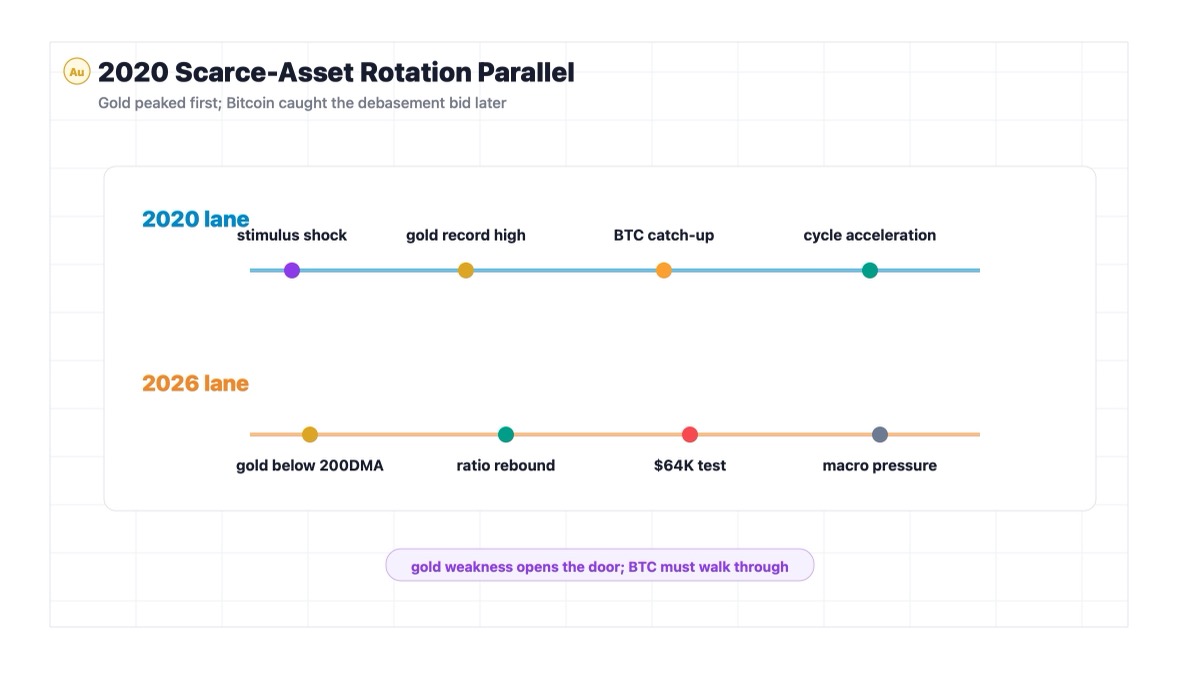
A useful parallel is the second half of 2020, when gold made a major high while Bitcoin was still in the early stages of what became a much larger move.
Gold surged into August 2020 as investors reacted to pandemic stimulus, falling real yields and fear that aggressive monetary policy would weaken fiat purchasing power. Spot gold traded above $2,000 per ounce and made what was then a record high. Bitcoin, meanwhile, was still far below its later cycle peak. It had recovered from the March 2020 crash, but the market had not yet fully decided that BTC would become the louder expression of the debasement trade.
Then the relative story shifted. Gold struggled after its August peak, while Bitcoin accelerated into late 2020 and early 2021. The important point is not that gold weakness automatically caused Bitcoin strength. That would be too neat, and markets dislike being that convenient. The better read is that capital began to separate the two scarce-asset stories. Gold had already priced a lot of the monetary-fear trade. Bitcoin still had room to absorb that narrative with more volatility and more upside.
The similarity to the current setup is the relative-strength question. Once again, gold's trend is weakening while Bitcoin bulls are watching whether BTC can improve against gold. The Bitcoin-to-gold ratio is the cleanest way to observe that fight.
The difference is the macro backdrop. In 2020, liquidity was expanding aggressively and real yields were deeply supportive of speculative assets. Today, the dollar is stronger, rate-hike expectations have reappeared, and Bitcoin is trying to recover after a break below $60,000. That makes the current signal much more fragile.
The lesson is simple: gold weakness can open a door for Bitcoin, but BTC still has to walk through it. Relative strength only matters if price confirms it.
Bitcoin Price Reaction and K-Line Analysis
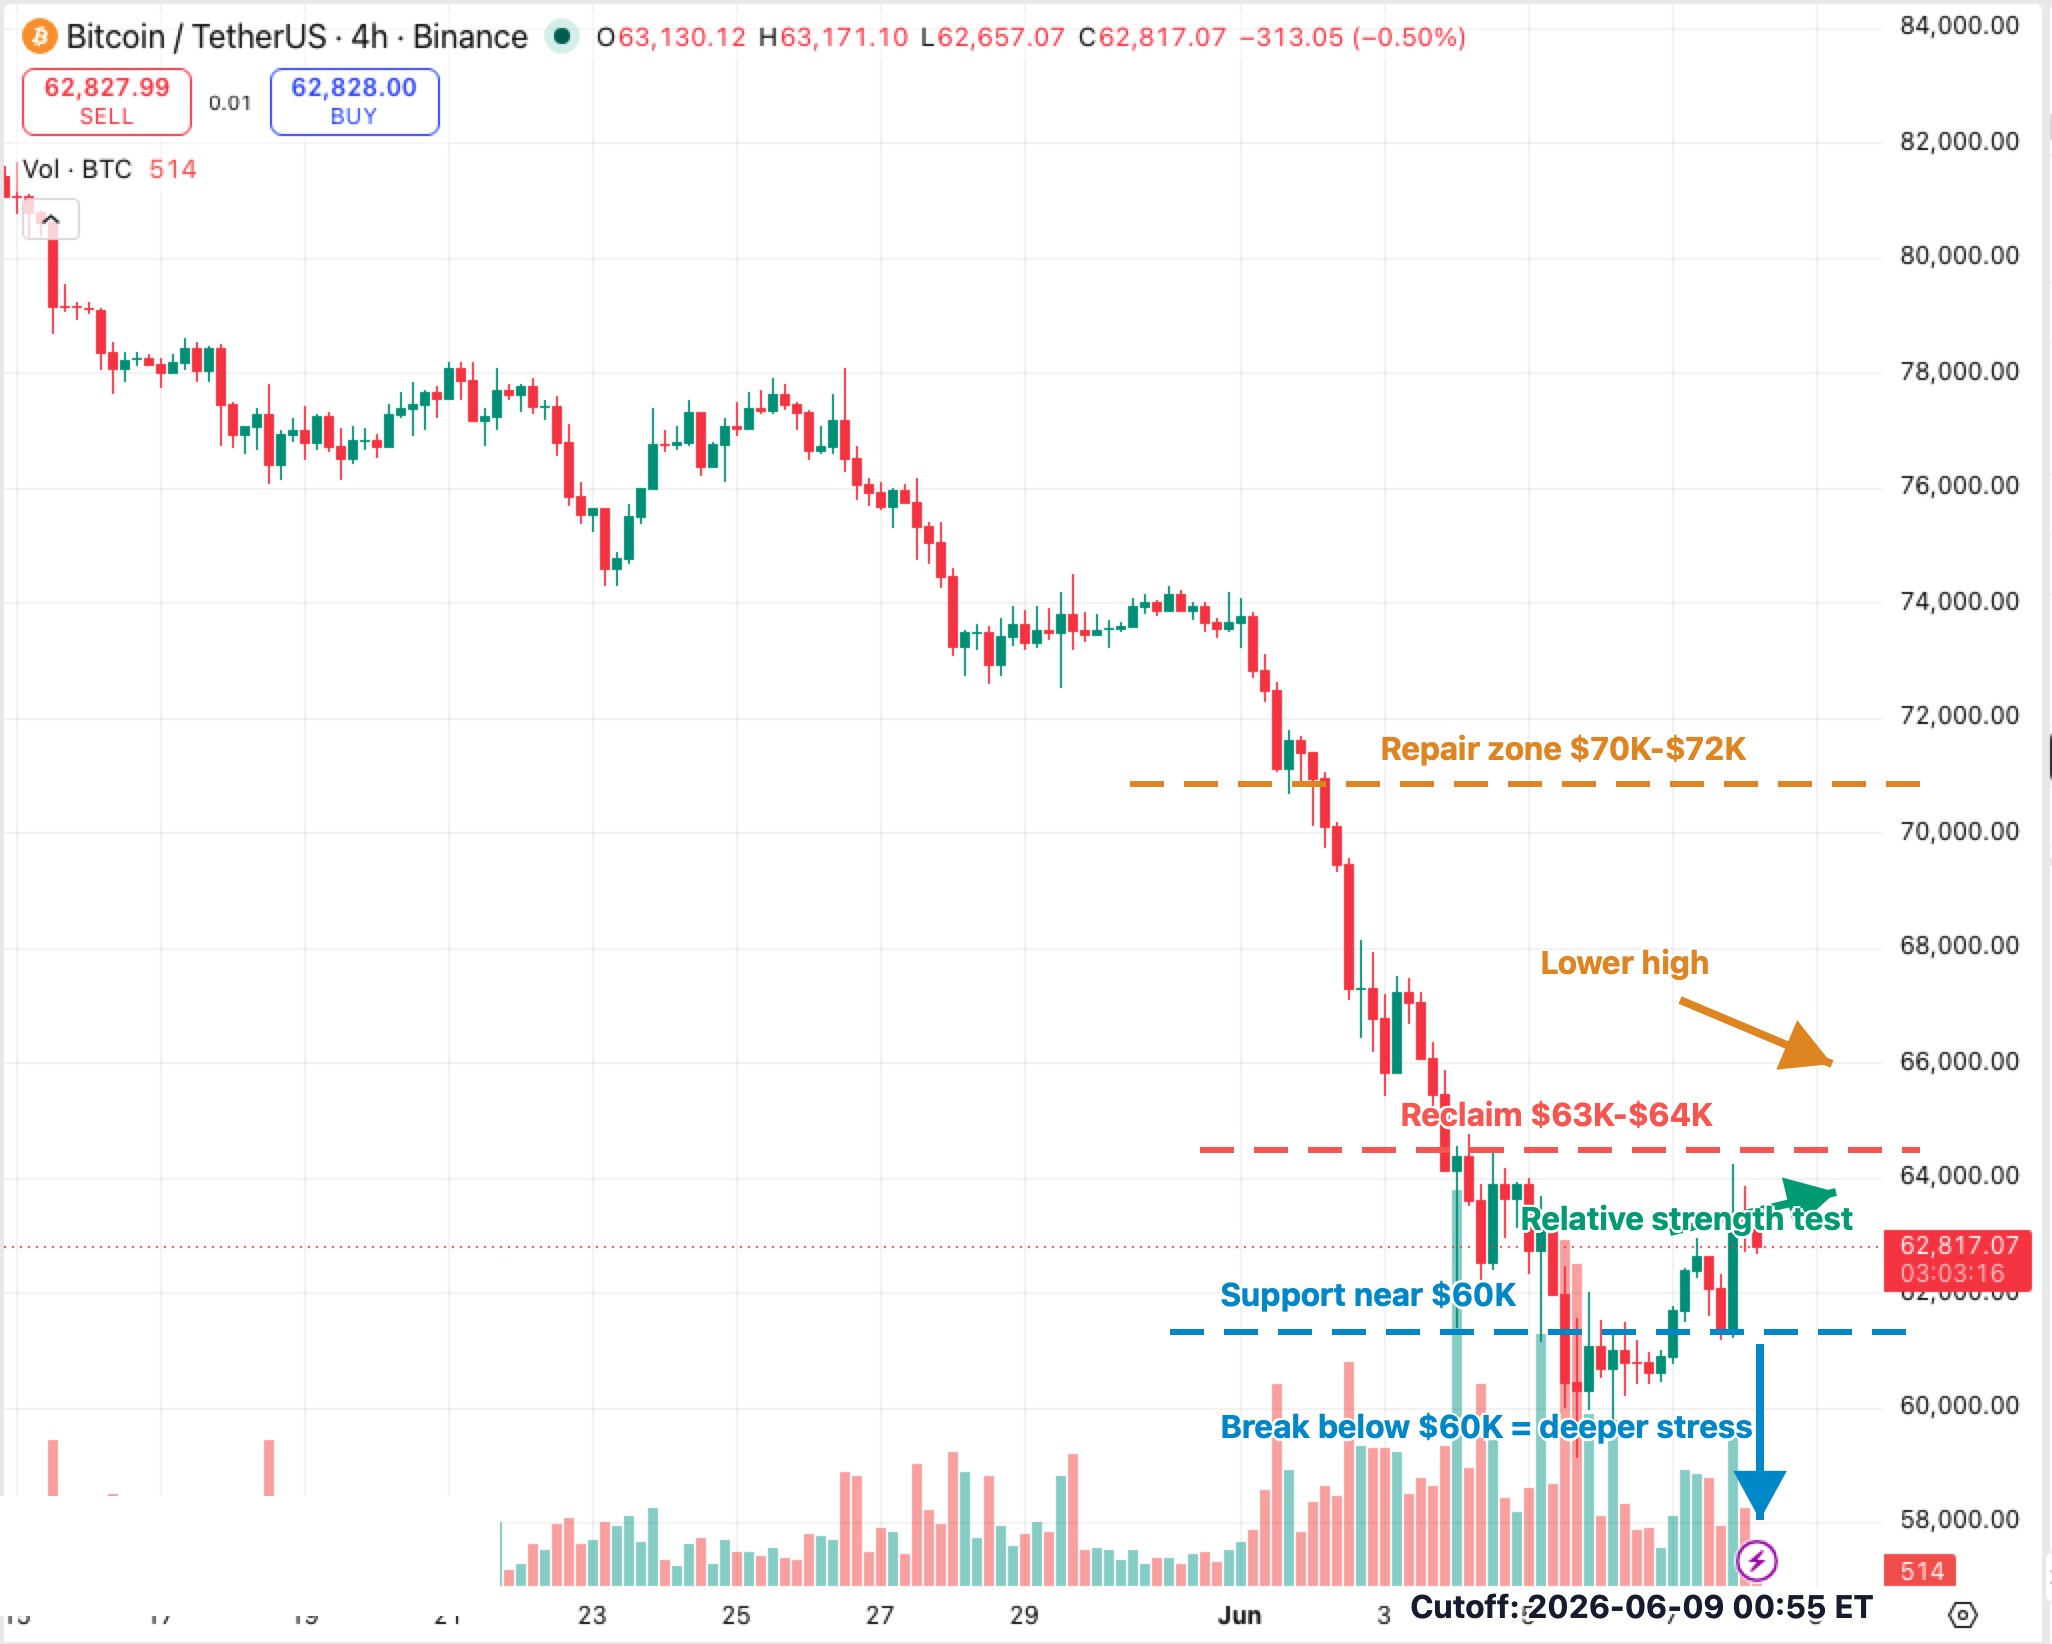
The BTCUSDT 4H chart is trying to repair itself, but it has not earned the right to sound relaxed.
The first thing to notice is the rebound from the $60K area. That level has become the near-term line where buyers have shown up. The bounce from there matters because it lines up with the improvement in the Bitcoin-to-gold ratio. In plain English: while gold is losing its long-term trend line, BTC is at least trying to stop underperforming.
But the chart is still below the first serious repair zone.
The $63K-$64K area is the immediate test. A push through that band would make the rebound look less like a reflex and more like the beginning of structure repair. If BTC keeps failing below that zone, the market will probably treat the move as a weak bounce from oversold conditions.
Above that, $70K-$72K is the larger repair zone. That is where Bitcoin would begin to look like it has recovered from the recent breakdown rather than merely survived it.
The downside is straightforward. If BTC loses $60K again, the relative-strength argument weakens quickly. Gold's breakdown may still matter, but Bitcoin would be telling us that macro pressure is stronger than cross-asset rotation.
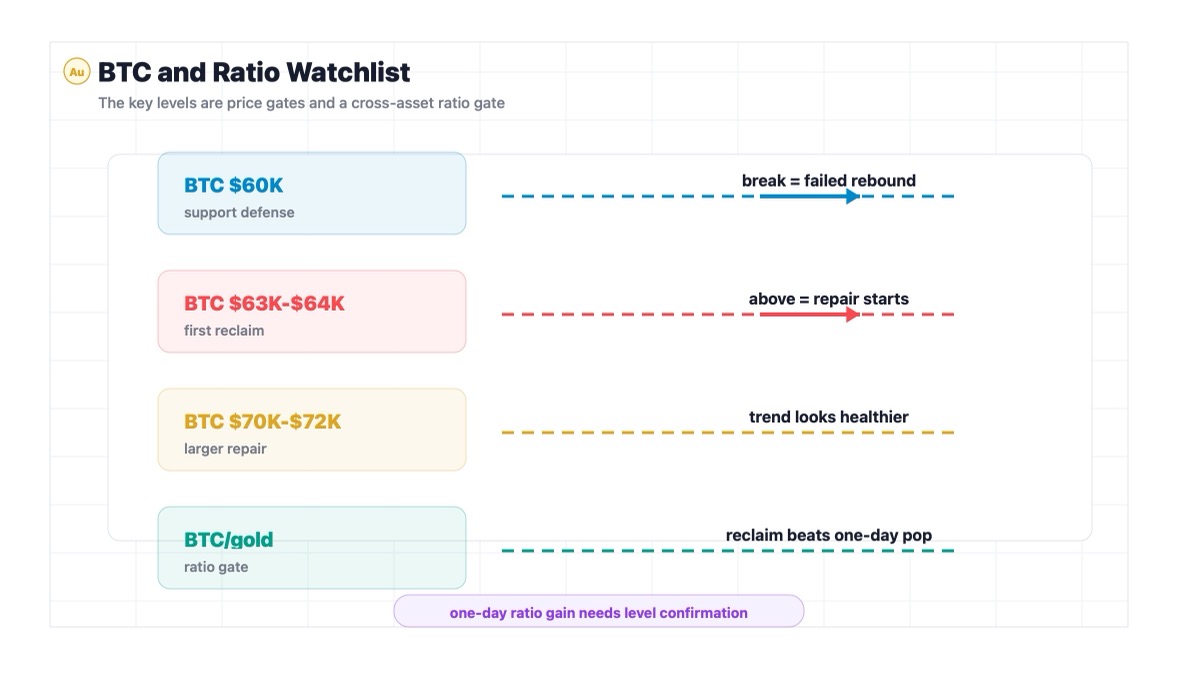
Key Levels to Watch
The first level is $63K-$64K. This is the short-term reclaim zone and the place where BTC has to prove demand is real.
The second level is $60K. If this breaks again, the recent rebound becomes a failed support defense.
The third level is $70K-$72K. This is the broader repair zone where the chart can begin to look healthier.
The ratio level to watch is the Bitcoin-to-gold ratio near its 200DMA. Last month's rejection there came before BTC fell below $60K, so a future reclaim would be more meaningful than a one-day improvement.
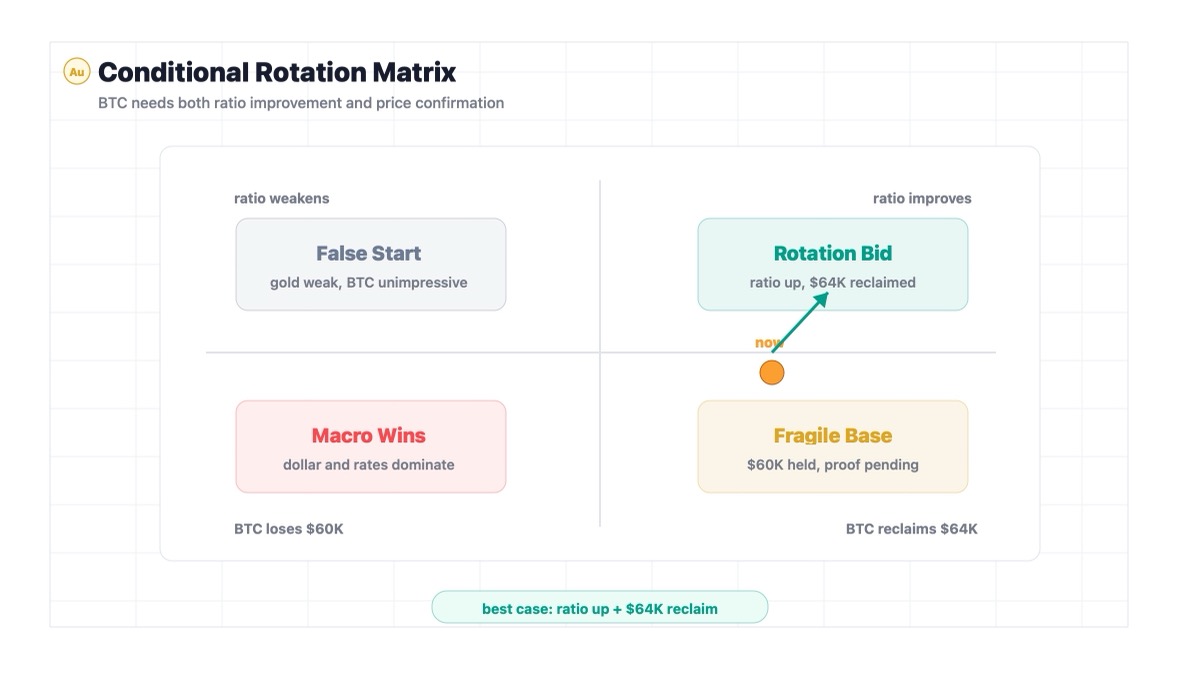
Conditional Forecast
If BTC reclaims $63K-$64K while the Bitcoin-to-gold ratio keeps rising, the market can start treating gold's weakness as a real cross-asset rotation signal. In that scenario, BTC could grind toward $70K-$72K as traders test whether digital scarcity is regaining momentum over traditional safe-haven demand.
If BTC stalls under $64K, the signal stays small. Gold can be weak and Bitcoin can still be unimpressive. That is the annoying but important part. Relative strength is useful only when it turns into actual price strength.
If BTC loses $60K again, the bullish interpretation breaks down. The market would likely conclude that stronger dollar pressure and renewed rate-hike expectations are still more important than gold's technical weakness.
The best-case version is not complicated: gold remains below its 200DMA, BTC holds $60K, the BTC/gold ratio improves, and Bitcoin reclaims $64K. The bearish version is just as clean: the dollar stays firm, rate expectations harden, and BTC fails its support defense.
Investment Takeaway
Gold's break below the 200-day moving average gives Bitcoin bulls something they have not had much of lately: a relative argument.
But it is not enough by itself.
The market is not saying Bitcoin has won the scarce-asset contest. It is saying gold has stumbled, and Bitcoin has a chance to make that stumble matter. That chance lives at $63K-$64K first, then $70K-$72K later. Until those levels are reclaimed, this is a glimmer, not a signal flare.
For investors, the practical posture is conditional patience. Watch whether BTC can defend $60K and keep improving versus gold. If it can, the gold breakdown becomes part of a constructive rotation story. If it cannot, the whole thing becomes another clever narrative that price refused to confirm.
Sources
- CoinDesk: Gold slips below 200-day moving average offering glimmer of hope for bitcoin bulls
- TradingView: BTCUSDT chart
- CME FedWatch: Target Rate Probabilities
- World Gold Council: Gold price data
- CoinMarketCap: Bitcoin historical data
|
DISCLAIMER:
1. All content on this website (including but not limited to articles, data, charts, and analyses) is for general informational purposes only and does not constitute any form of investment advice, trading recommendation, or financial guidance. 2. Cryptocurrencies and digital assets are subject to extreme price volatility and high investment risk; you may lose part or all of your principal. Past performance does not predict future results. 3. The information on this website is based on sources we believe to be reliable, but we do not guarantee its accuracy, completeness, or timeliness. Any investment decisions made based on this website’s information are at your own risk. 4. We strongly recommend that you conduct your own thorough research and consult an independent, licensed financial advisor before making any investment decisions. |
Recommended reading
Latest News