Why Bitcoin Is Falling: NYDIG Says AI, IPOs, Quantum and Strategy Fears Hit BTC
Key Takeaways
- NYDIG argues Bitcoin's decline is not driven by one clean villain, but by several pressures arriving at once.
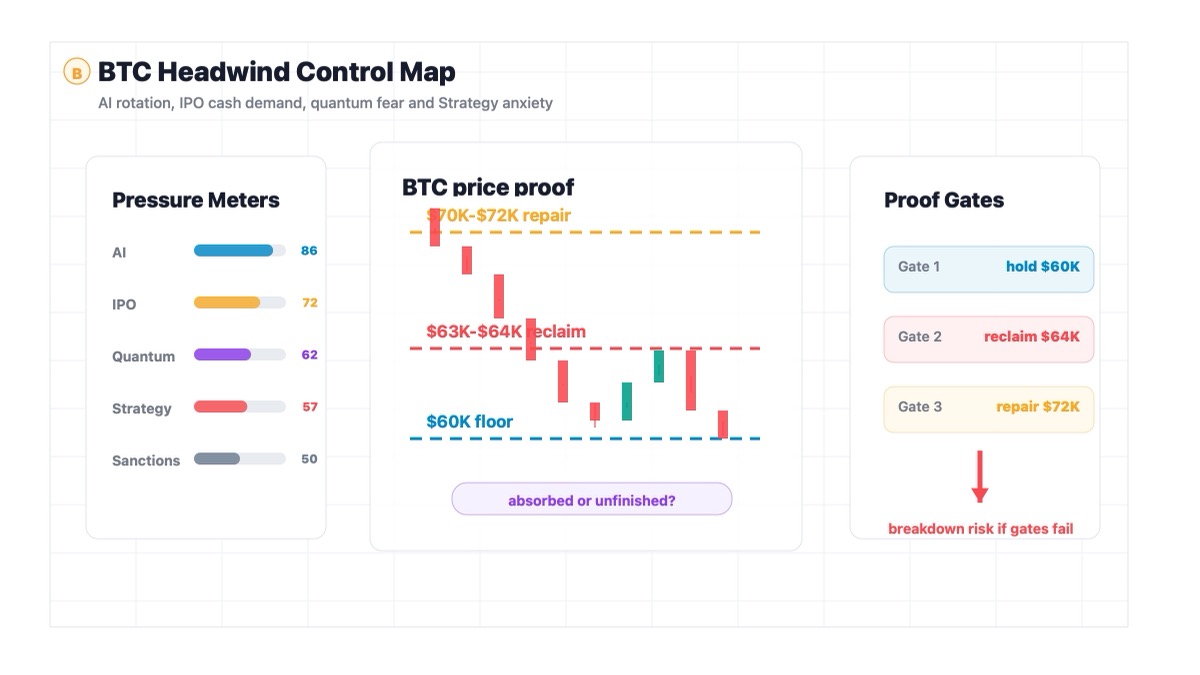
- AI stocks, future mega tech IPOs, quantum-security fears and Strategy sale anxiety are all competing with the BTC bull case.
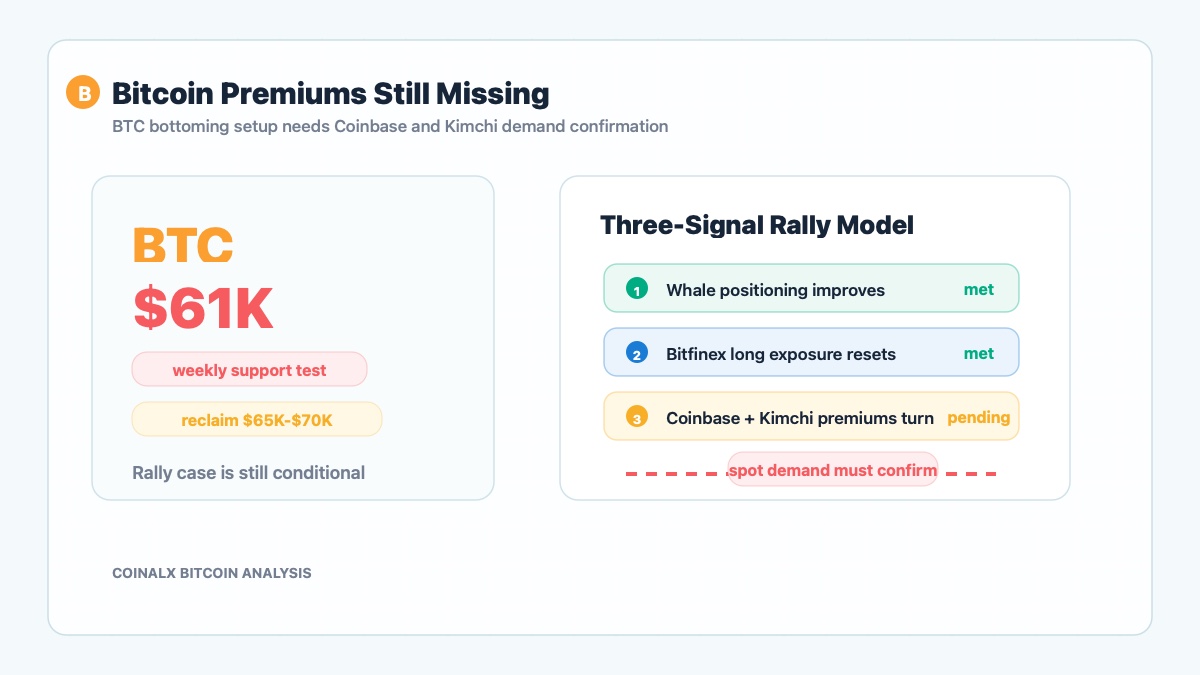
- Onchain signals look closer to a bottom zone, but the price drawdown remains milder than older Bitcoin bear markets.
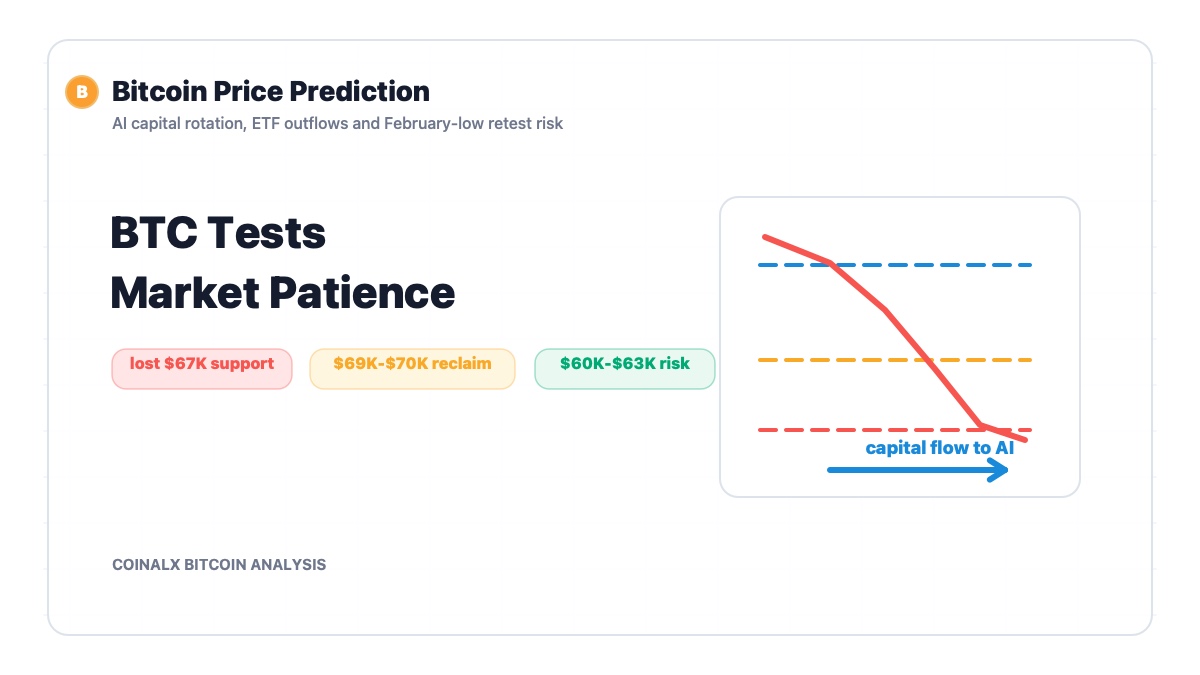
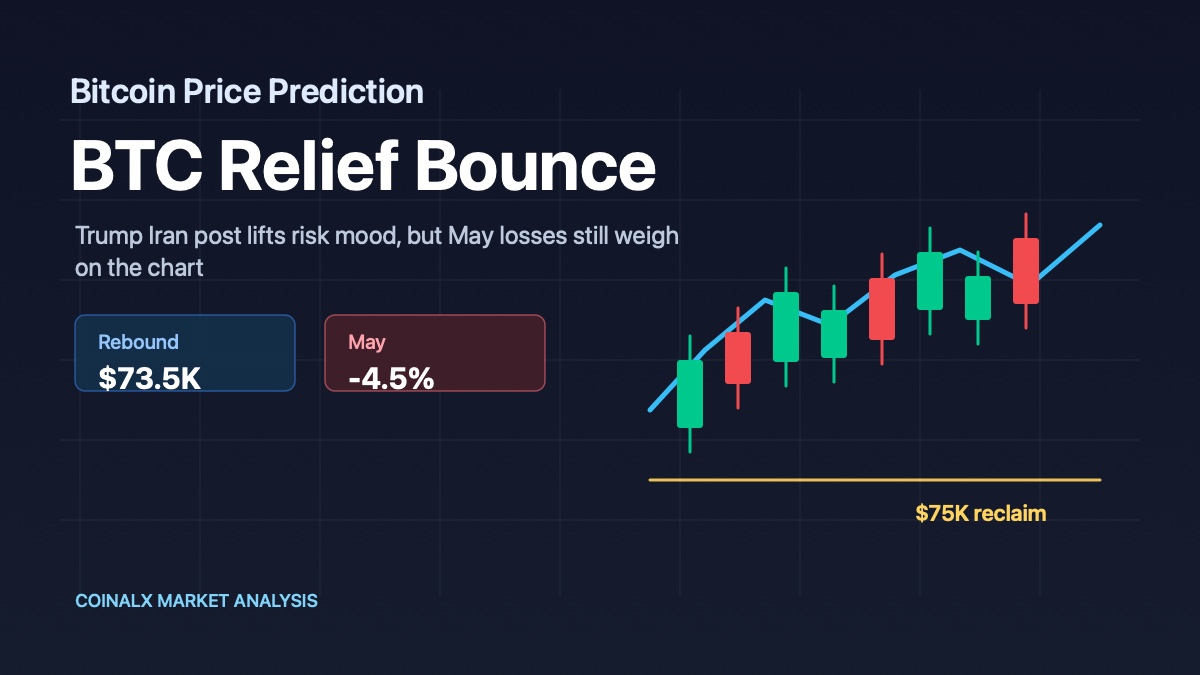
- BTC needs to reclaim $63K-$64K first; losing $60K again would make the reset look less finished.
What Happened
Bitcoin has been doing the kind of thing that makes investors search the room for a single guilty object.
Was it AI? Was it Strategy? Was it quantum computing? Was it sanctions? Was it just a normal Bitcoin tantrum wearing a more expensive suit?
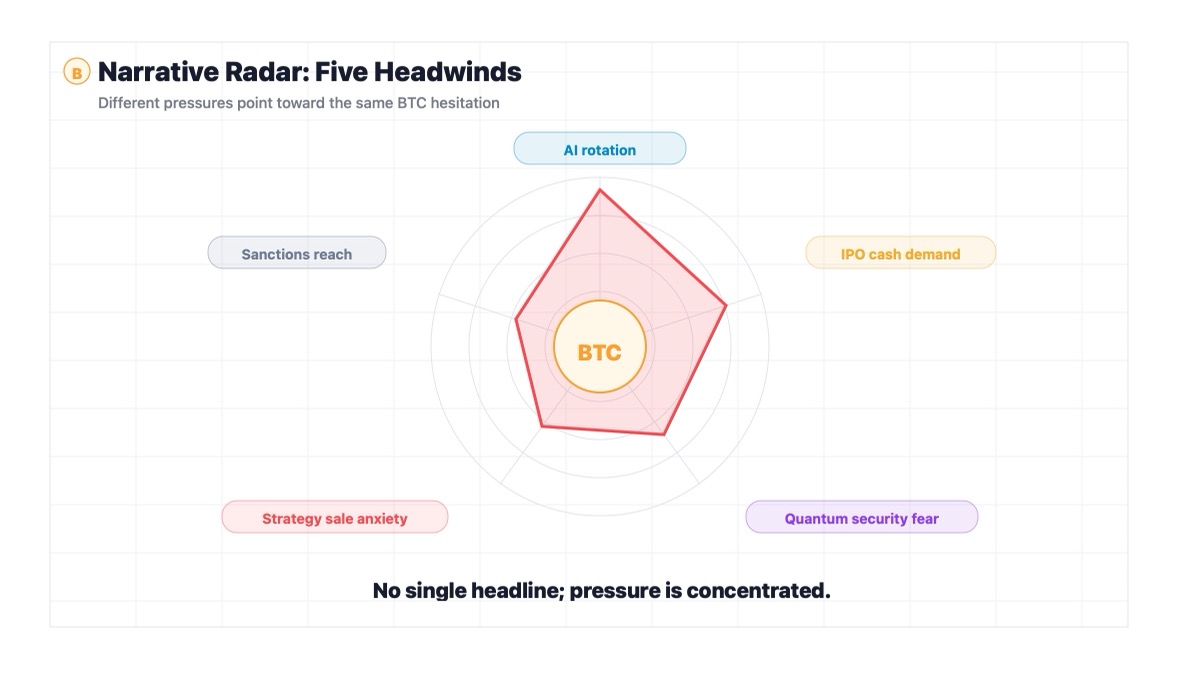
NYDIG's Greg Cipolaro offered a less satisfying but probably more useful answer: there may not be one culprit. Bitcoin's weakness, in his view, is better understood as a stack of overlapping headwinds. None of them, alone, looks large enough to explain the whole move. Together, they create the kind of market where buyers hesitate, sellers get louder, and every bounce has to prove itself twice.
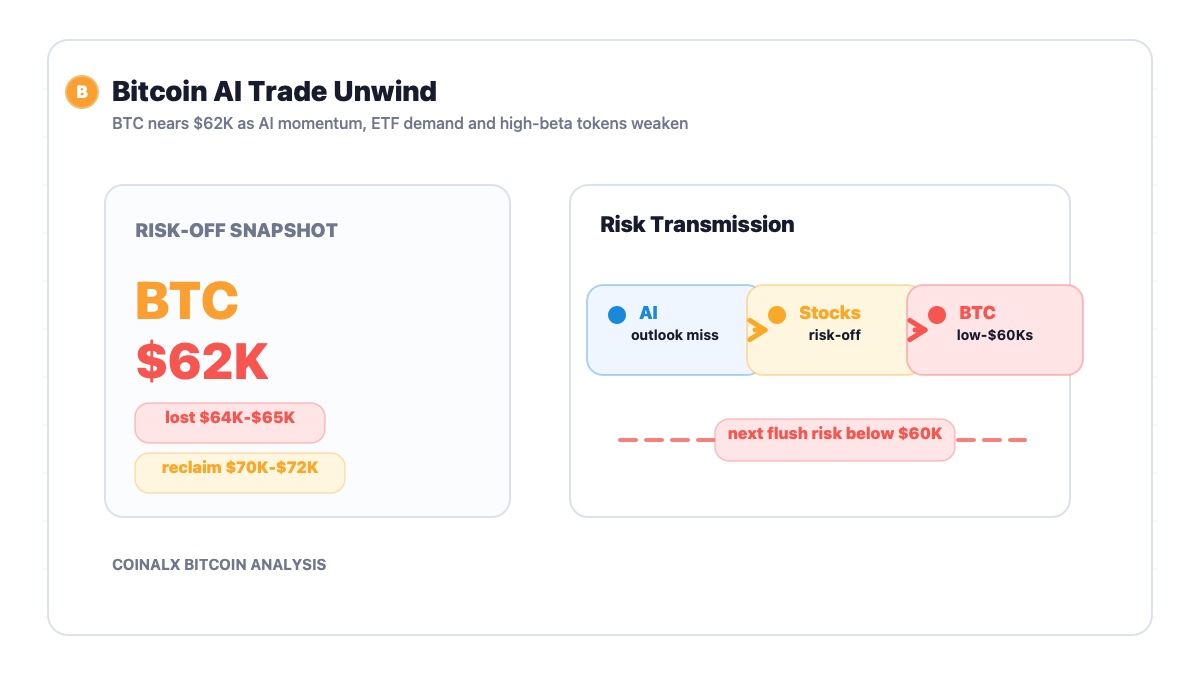
The first pressure is capital rotation. AI has become the market's dominant growth story, and that matters because crypto and AI often fish from the same pond: investors looking for emerging-technology exposure, asymmetric upside and a reason to believe the future is arriving ahead of schedule. When AI stocks keep winning, some marginal capital that might have gone into Bitcoin simply walks across the street.
The second pressure is the expected return of large tech IPOs. If companies such as SpaceX, OpenAI and Anthropic eventually come public, institutions may need to raise cash before new allocations. That does not mean they dump Bitcoin because they suddenly dislike it. It means portfolios have plumbing, and plumbing sometimes cares less about ideology than available cash.
Then come the crypto-native worries. U.S. officials reportedly seized roughly $1 billion in Iranian-linked crypto assets, raising uncomfortable questions about censorship resistance, sanctions exposure and state reach. Quantum-computing fears also returned after research suggested the resources needed to attack widely used cryptographic systems may be falling faster than previously assumed.
And then there is Strategy.
The company sold only 32 BTC, worth about $2.5 million at the time, which is tiny in supply terms. But it was not tiny psychologically. Strategy has spent years occupying a very specific role in the Bitcoin story: relentless buyer, not potential seller. Even a small sale asks the market to imagine a different version of that story.
That is the problem. Bitcoin is not just trading against one headline. It is trading against a bundle of doubts.
Why This Matters for Bitcoin and Crypto Markets
Markets are usually easier to read when the stress has a name.
An exchange fails. A regulator sues. Inflation prints hot. A whale sells. The chart falls, everyone points at the thing, and the explanation is crude but usable.
This setup is messier. The pressure on BTC is not one dramatic explosion. It is a slow compression from several directions: AI is competing for capital, IPO expectations may pull liquidity toward private-growth exits, security narratives are being questioned, and Bitcoin's most famous corporate accumulator has introduced a tiny but symbolically loud sell signal.
That kind of pressure can be more dangerous than a single shock because it does not give the market a clean event to price and move past. If the problem is one bad headline, the recovery path is simple: wait for the headline to fade. If the problem is a crowding-out of the Bitcoin narrative, BTC has to rebuild confidence across several fronts at once.
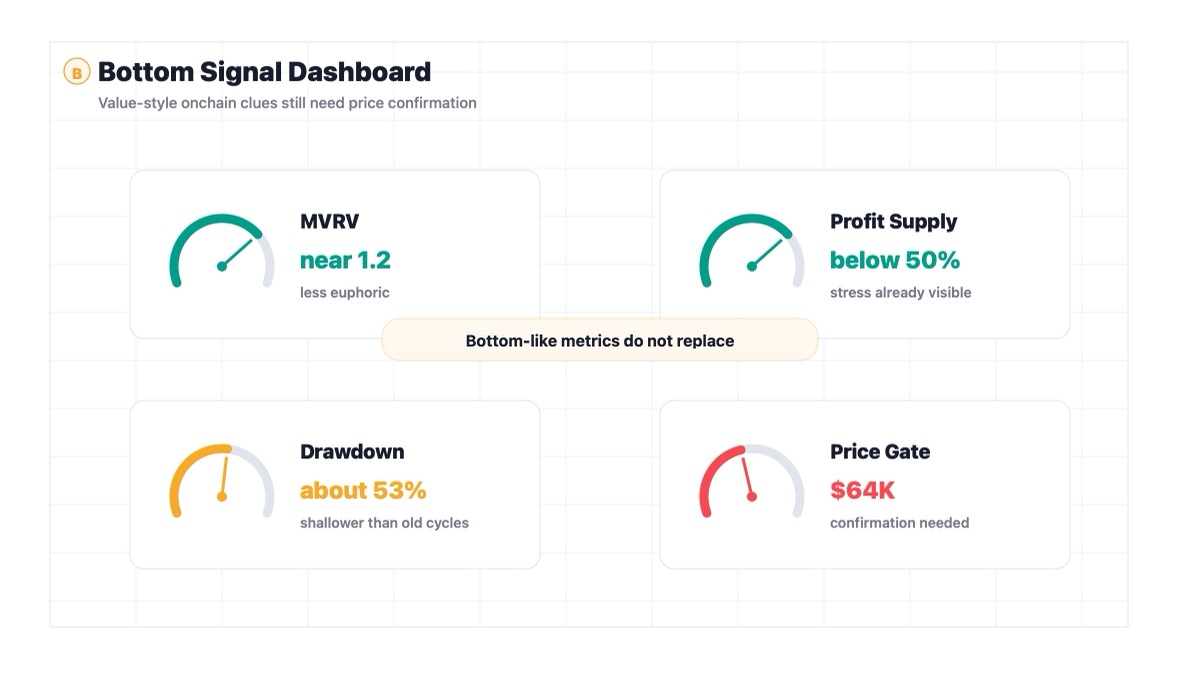
The onchain picture complicates the story. NYDIG notes that Bitcoin's MVRV ratio has fallen toward 1.2, while the percentage of supply held in profit has dropped below 50%. Historically, those are not euphoric conditions. They are closer to the part of the cycle where forced optimism has been scraped off the market.
But there is a catch, and it is a big one.
The reported drawdown from Bitcoin's October peak near $126,000 is roughly 53%. That is painful, but not the full 75%-90% reset seen in some older cycles. So the market is stuck with two competing interpretations. Either institutional adoption has changed Bitcoin's cycle shape, making bear markets shallower. Or the reset is not done yet, and the bottom-like onchain signals are arriving before the final capitulation.
This is why the next few BTC candles matter. The chart is not just a chart right now. It is a lie detector for the idea that the market has already absorbed the whole pressure stack.
Historical Parallel: The 2022 Growth-Tech Liquidity Reset
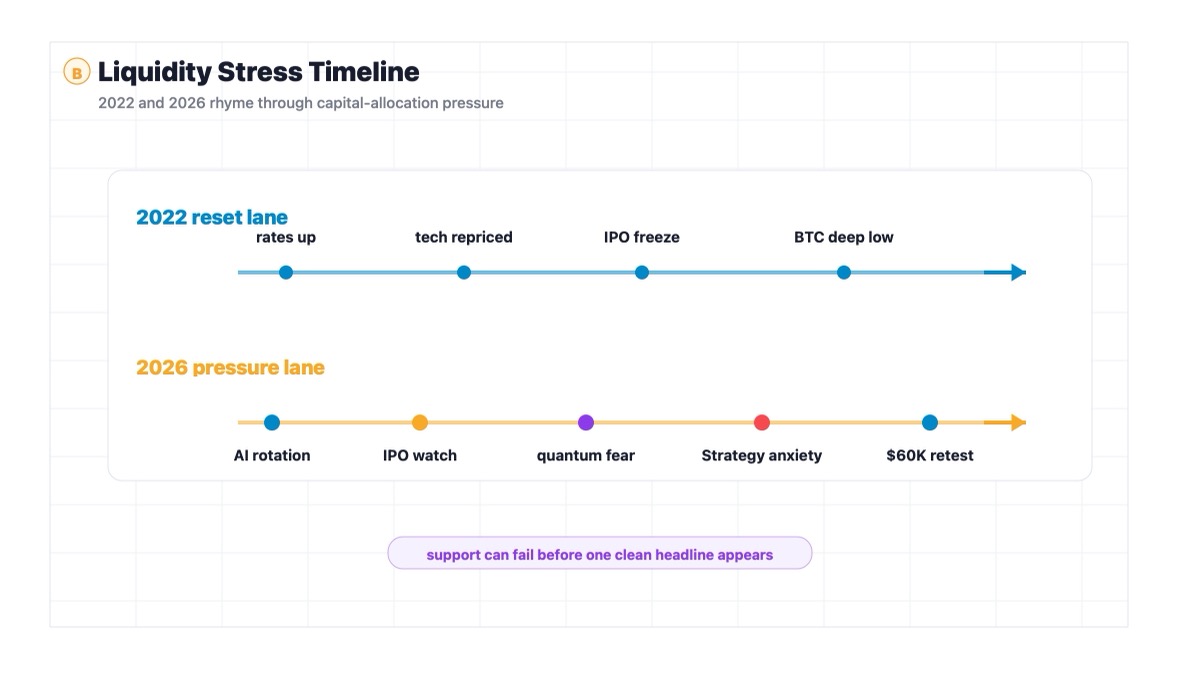
A useful parallel is the 2022 risk-asset reset, when Bitcoin stopped behaving like a clean inflation hedge and started trading much more like a high-beta growth asset under tightening financial conditions.
What happened then was not one neat Bitcoin-specific event at the start. Inflation was high, the Federal Reserve began raising rates, tech valuations compressed, and the IPO market froze. Reuters reported that U.S. tech IPO activity was heading for one of its worst years since the global financial crisis, while NYSE leadership later said broader IPO proceeds had fallen more than 90% in 2022. In the same broad period, Bitcoin moved from its late-2021 peak near $69,000 into a deep 2022 drawdown, eventually reaching the mid-$15,000 area after crypto-native failures made the macro stress worse.
The similarity is the capital-allocation problem. In both cases, Bitcoin was not falling only because someone found a flaw in the network. It was falling because investors were repricing the opportunity set around it. In 2022, cash suddenly had yield, tech multiples were being punished, and IPO liquidity disappeared. In the current setup, AI is pulling attention and money, future mega IPOs may require cash, and Bitcoin has to compete for risk capital at the same time its own narratives are being questioned.
The difference is just as important. In 2022, the Fed tightening cycle and crypto credit blowups became systemic. The current story is more fragmented: AI rotation here, Strategy psychology there, quantum anxiety in the background, sanctions risk on the side. It is less like one giant wave and more like several smaller waves hitting the same boat.
The lesson for current BTC is uncomfortable but useful: narrative damage does not need one catastrophic trigger. If enough marginal buyers pause at the same time, support can fail before the market ever gets a clean headline to blame.
Bitcoin Price Reaction and K-Line Analysis
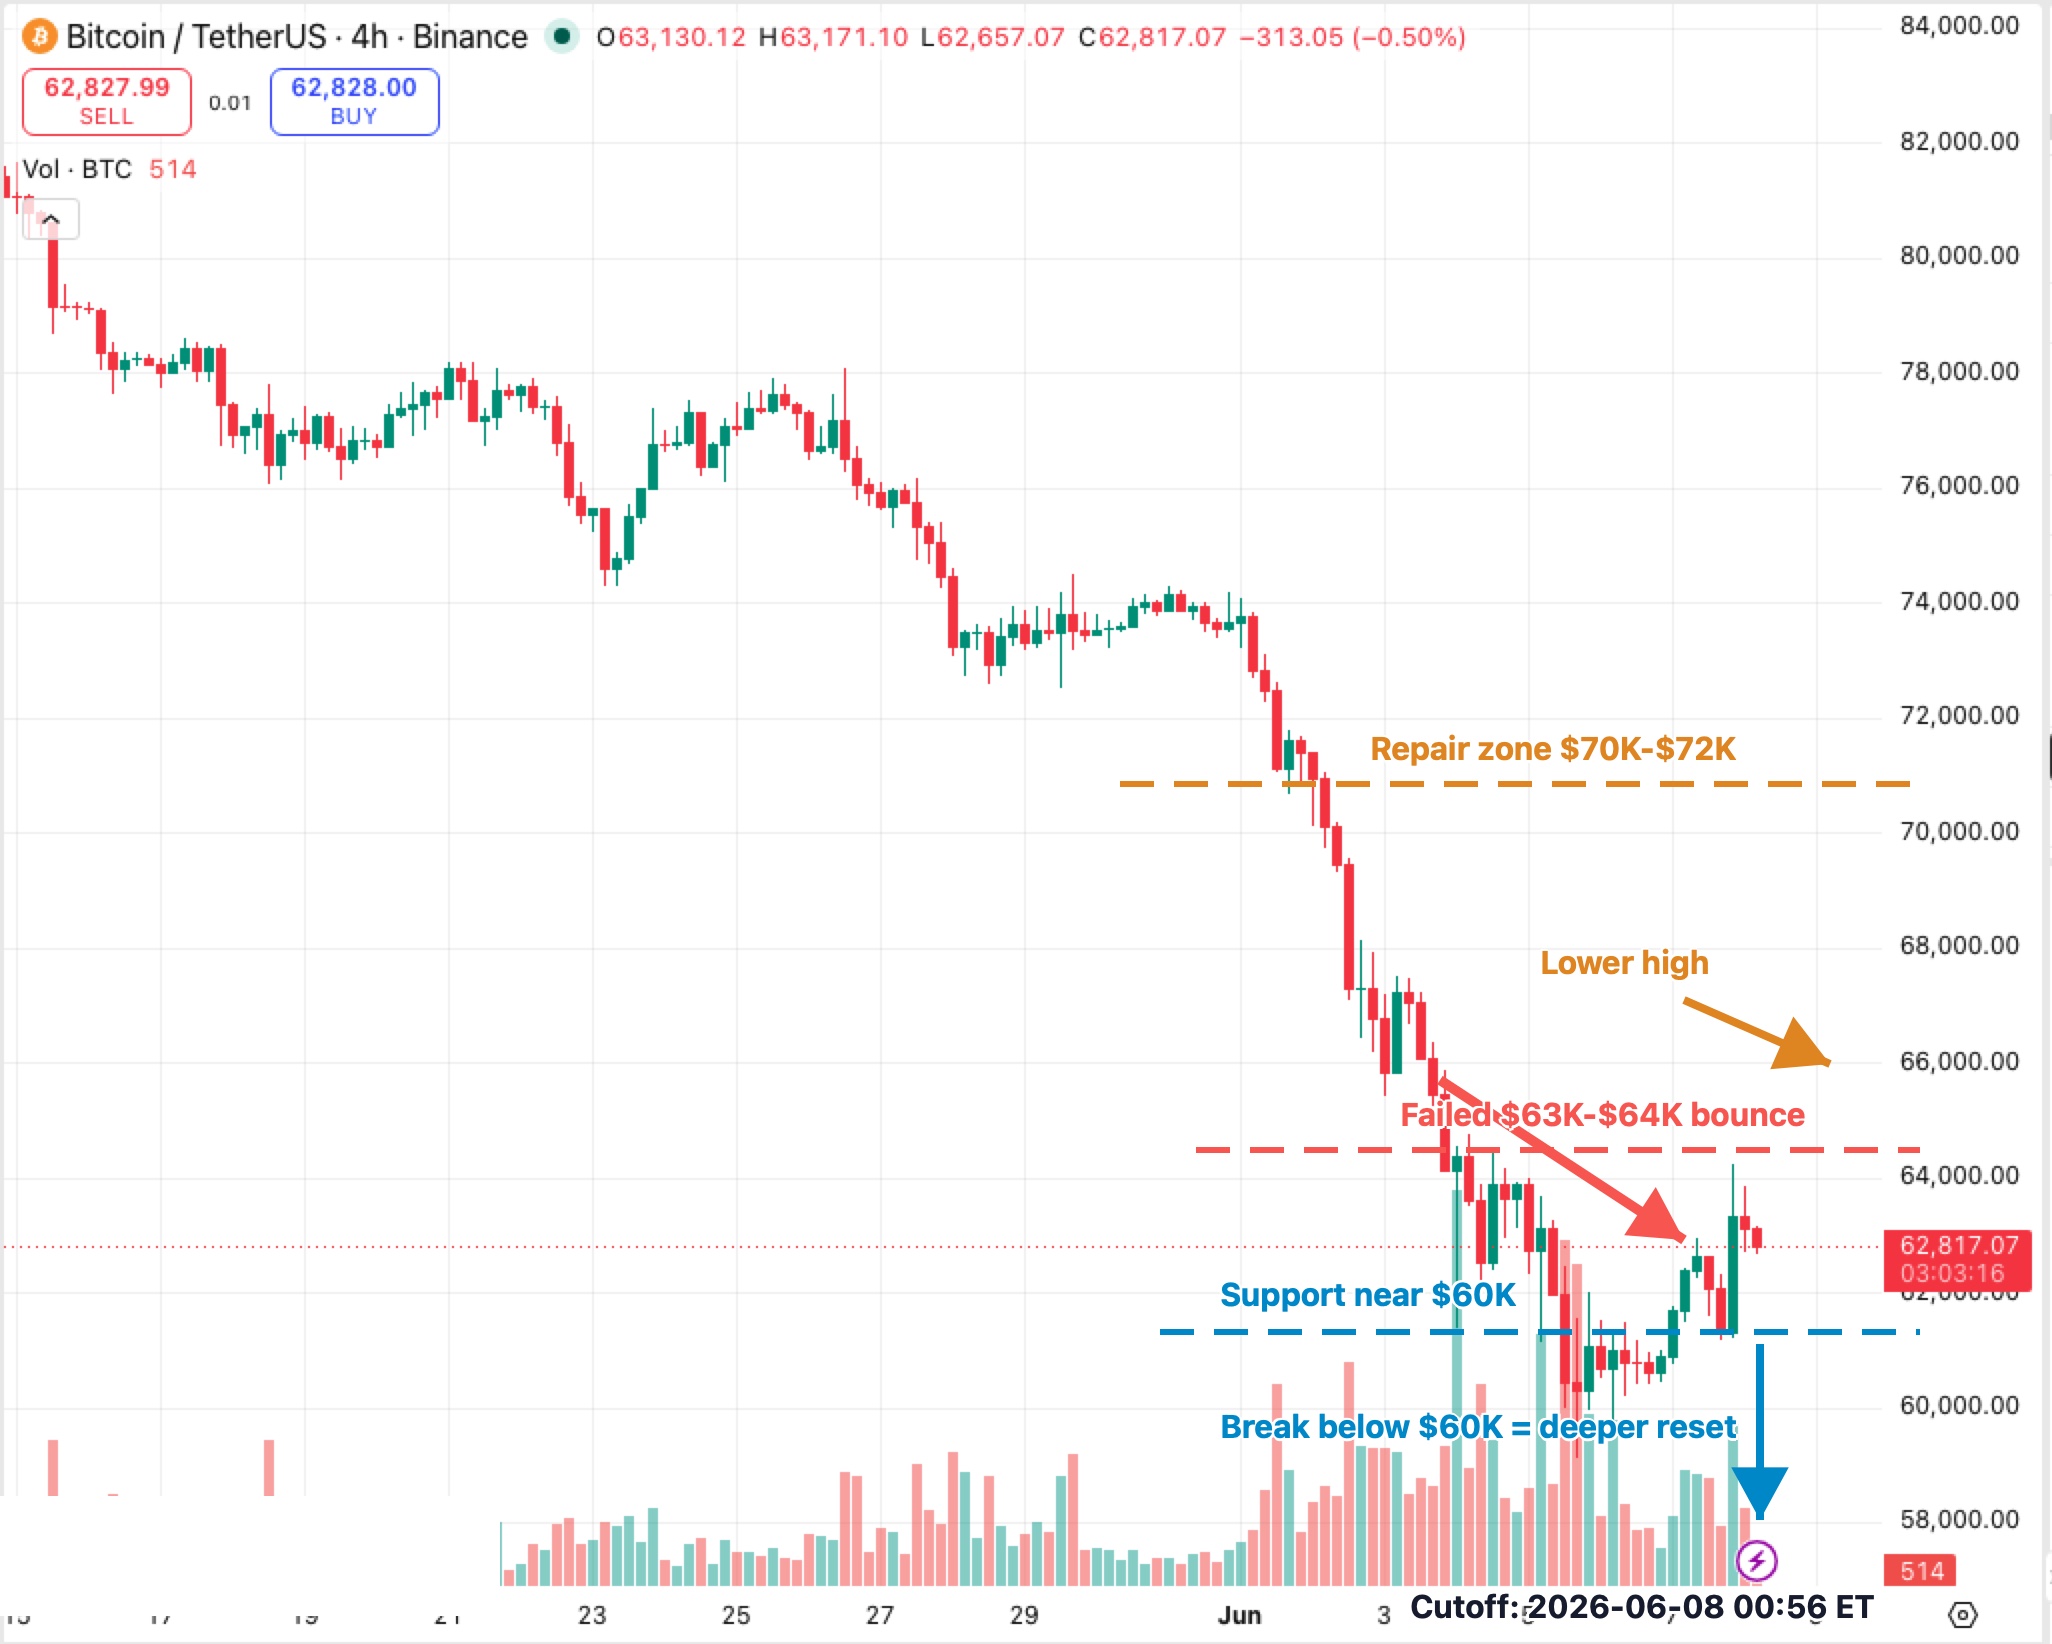
The BTCUSDT 4H chart is still defensive.
The first thing to notice is that the drop was not a gentle drift. Bitcoin moved down in a stair-step structure, lost higher levels quickly, and then tried to stabilize around the low-$60K area. That matters because sharp liquidation-style moves often produce violent rebounds, but violent rebounds are not the same thing as repaired structure.
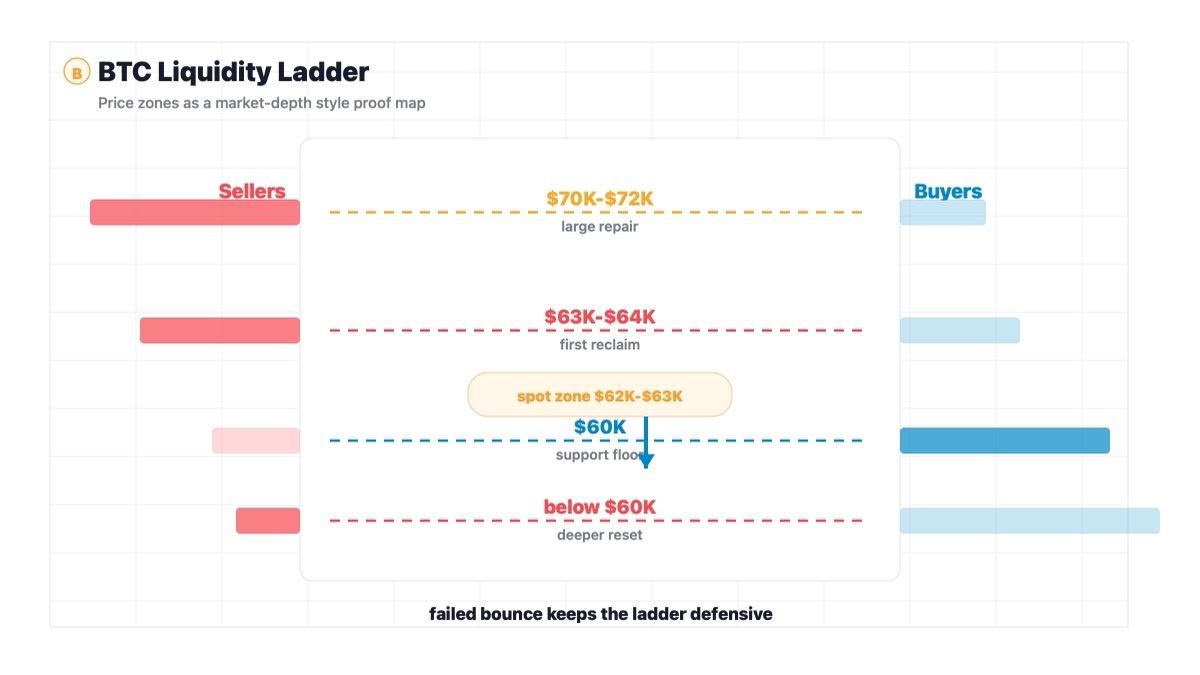
Right now, the bounce from below $60K has pushed BTC back toward the $62K-$63K region, but the chart has not yet reclaimed the failed $63K-$64K band with authority. That band is the first repair zone. If buyers cannot hold above it, the rebound looks more like short covering than fresh accumulation.
Above that, the larger repair zone sits around $70K-$72K. Until BTC can work back toward that area, the broader structure still looks like a market trying to recover after losing its prior trend, not a market already back in control.
The $60K area remains the obvious line underneath. It is not magic. It is simply the level where the market recently found enough demand to stop the slide. If that level breaks again, the market will probably stop asking whether the bottom is near and start asking how deep the reset needs to go before real buyers return.
Key Levels to Watch
The first level is $63K-$64K. This is where BTC needs to prove the bounce is more than a reaction.
The second level is $60K. A clean break below it would turn the recent rebound into a failed support test.
The third level is $70K-$72K. This is not the first target for traders chasing a bounce. It is the area where the chart would begin to look less damaged.
The wider downside zone sits below $60K. If BTC loses that floor while the AI and IPO capital-rotation story remains strong, the market may begin pricing a deeper cycle reset rather than a local correction.
Conditional Forecast
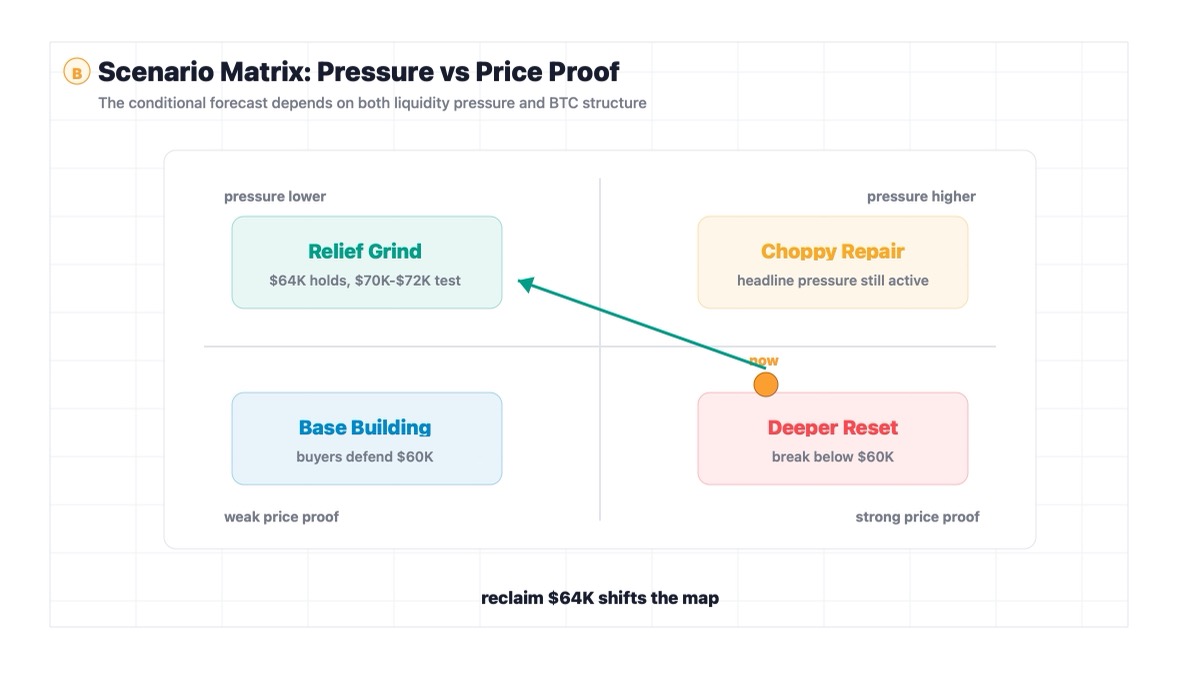
If Bitcoin reclaims $63K-$64K and holds that zone on repeated 4H closes, the market can start treating the sub-$60K move as a capitulation-style flush. In that case, the next realistic objective is not instant euphoria. It is a grind back toward $70K-$72K, where sellers are likely to test whether buyers have real conviction.
If BTC fails at $63K-$64K and rolls back toward $60K, the setup becomes much more fragile. That would suggest the bounce was mostly mechanical: shorts covered, late sellers got punished, but new demand did not take control.
If $60K breaks again, the onchain-bottom argument gets harder to use as a near-term trading shield. It may still be true that Bitcoin is closer to value than euphoria, but price would be saying that value buyers are not yet strong enough to absorb the pressure stack.
The cleanest bullish version is simple: AI momentum cools, ETF or institutional demand improves, Strategy fears fade, and BTC reclaims $64K. The bearish version is also simple: AI keeps absorbing risk capital, IPO expectations pull liquidity away, and Bitcoin loses $60K before the market gets comfortable again.
Investment Takeaway
This is not a market where the smartest question is, "Which single headline caused the fall?"
The better question is, "How many reasons do marginal buyers currently have to wait?"
Right now, they have several. That does not mean Bitcoin is broken. It means the burden of proof has shifted back to price. Onchain metrics can suggest exhaustion. Institutional adoption can make the cycle shallower. Strategy's small BTC sale can be mostly symbolic. All of that can be true.
But the chart still has to reclaim lost ground.
For investors, the practical read is patience. BTC above $63K-$64K begins to repair the short-term structure. BTC above $70K-$72K starts to repair the larger one. BTC below $60K says the market is not done testing how much conviction is real and how much was just easy bull-market storytelling.
Sources
- CoinDesk: Bitcoin's slide has no single cause. AI, tech IPOs, quantum, Strategy sale all play a role, NYDIG says
- TradingView: BTCUSDT chart
- Reuters via Investing.com: Tech IPO market faces worst year since global financial crisis
- Reuters via Investing.com: NYSE president says IPO proceeds fall over 90% due to uncertainty
- CoinMarketCap Academy: Bitcoin in 2022: A Year to Forget
|
DISCLAIMER:
1. All content on this website (including but not limited to articles, data, charts, and analyses) is for general informational purposes only and does not constitute any form of investment advice, trading recommendation, or financial guidance. 2. Cryptocurrencies and digital assets are subject to extreme price volatility and high investment risk; you may lose part or all of your principal. Past performance does not predict future results. 3. The information on this website is based on sources we believe to be reliable, but we do not guarantee its accuracy, completeness, or timeliness. Any investment decisions made based on this website’s information are at your own risk. 4. We strongly recommend that you conduct your own thorough research and consult an independent, licensed financial advisor before making any investment decisions. |
Recommended reading
Latest News