Ethereum Breaks Key Support: Next Stop $2,255 or $2,120?
2026-04-24 12:21:57
Ethereum is sliding again. It has broken below the ascending trendline at $2,340 and is now struggling around $2,285. On the surface, this looks like a technical pullback, but the real concern is that it could be the start of a deeper decline.
## Technicals Flashing Red
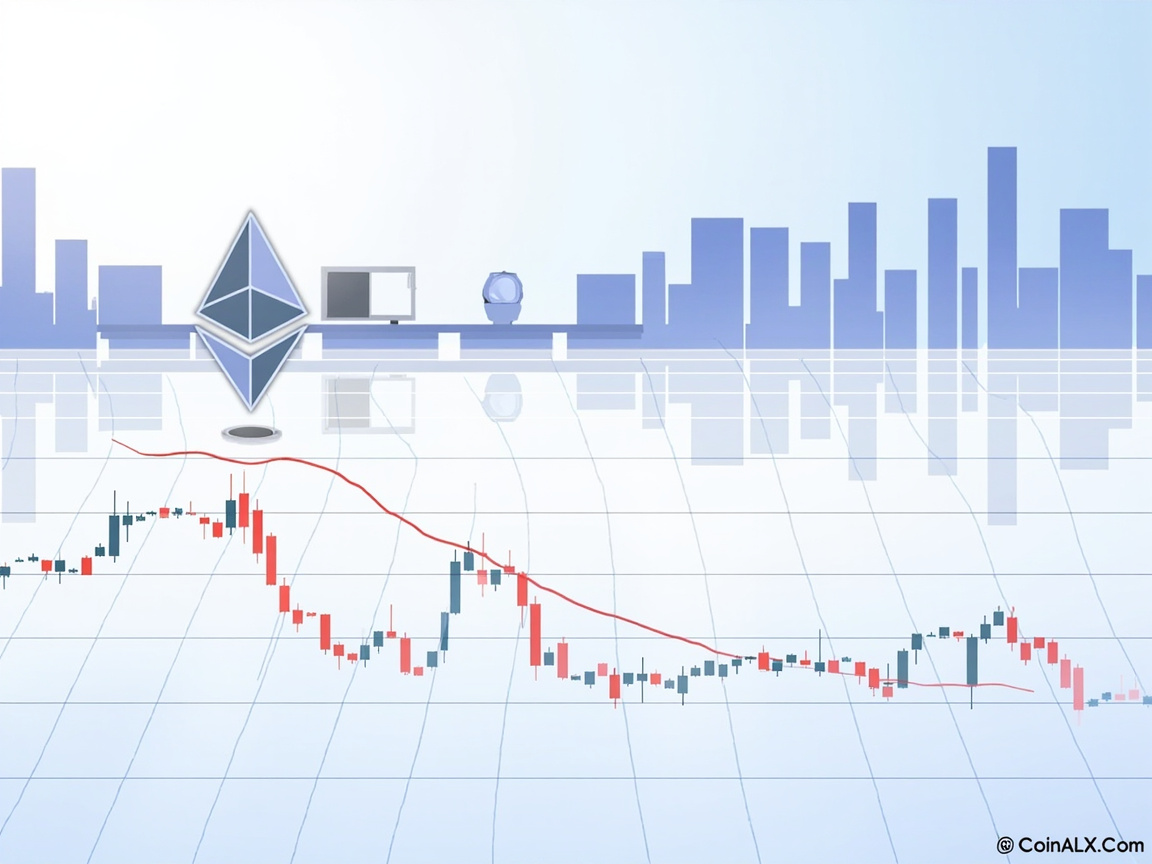
On the hourly chart, ETH dropped from a high of $2,425, breaking below $2,365 and $2,350, and even losing the 100-hour moving average. The MACD is accelerating lower in bearish territory, and the RSI has slipped below 50—classic signs of a broken rally.
More critically, the $2,340 trendline has been breached. This line had supported prices for weeks and now turns into resistance. In technical analysis, when support becomes resistance, it often signals a trend reversal.
## Two Key Levels to Watch
In the near term, $2,285 is the last line of defense. If bulls can hold here, a bounce toward $2,355 or even $2,385 is possible. But don't get too hopeful—volume suggests the bounce is weak.
If $2,285 fails, the next support is $2,255. Below that, $2,200 and $2,150 come into play. The most bearish scenario is a drop to $2,120, which would mark the lowest level this year.
On the upside, $2,385 is the first hurdle, followed by $2,425. Only a reclaim of $2,425 would signal that bulls are back. Until then, every rally is a chance to sell.
## Why This Time Is Different
Ethereum's decline isn't happening in isolation. Bitcoin is also correcting, and overall market sentiment is bearish. But ETH's problems run deeper: its narrative is eroding. Layer-2 solutions are siphoning users, rival chains like Solana are eating market share, and the ETF hype has faded.
Simply put, Ethereum lacks a fresh catalyst. With weak narratives and deteriorating technicals, capital flows to more certain bets.
## What Should Investors Do?
For short-term traders: Don't rush to buy the dip. Wait for a confirmed hold above $2,385 before entering, or you risk catching a falling knife.
For long-term holders: Now is not the time to add. Consider scaling in near $2,120, but be prepared for further downside.
The safest move is to stay on the sidelines. Wait for a clear signal—either a breakout above $2,425 on strong volume or a low-volume consolidation. Until then, cash is king.
Remember: In a downtrend, don't try to catch every falling knife. Wait until it hits the ground.
DISCLAIMER:
1. All content on this website (including but not limited to articles, data, charts, and analyses) is for general informational purposes only and does not constitute any form of investment advice, trading recommendation, or financial guidance.
2. Cryptocurrencies and digital assets are subject to extreme price volatility and high investment risk; you may lose part or all of your principal. Past performance does not predict future results.
3. The information on this website is based on sources we believe to be reliable, but we do not guarantee its accuracy, completeness, or timeliness. Any investment decisions made based on this website’s information are at your own risk.
4. We strongly recommend that you conduct your own thorough research and consult an independent, licensed financial advisor before making any investment decisions.