Bitcoin's 17 Defense Lines: Where Does the Bull Market Actually Break?
2026-04-21 01:14:20
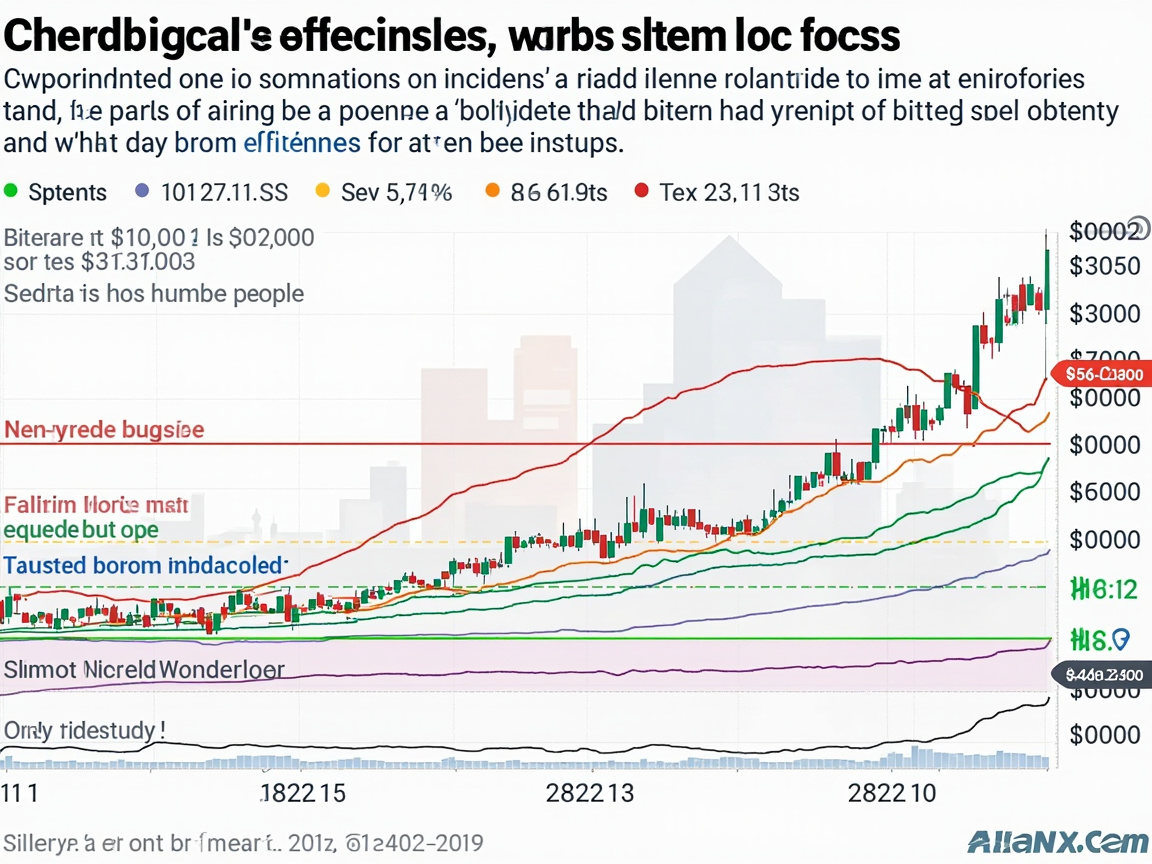
Crypto analyst Swarmik recently dropped a chart on X outlining 17 Bitcoin support levels from $70,000 down to below $30,000. On the surface, it's another technical analysis list predicting where dips might bounce. But the real story isn't the lines—it's what they imply about how fragile Bitcoin's current bull market structure really is.
### The First Line: $70K Isn't a Ceiling, It's a Psychological Gate
Swarmik labels $70,931 as the "breakout barrier." That's telling—it's below the all-time high but close enough to matter. The message is clear: Bitcoin is still playing in a high-range consolidation, and $70K isn't the top but a potential launchpad for the next leg up.
But is the market buying it?
Over the past month, Bitcoin has churned between $60K and $70K, with each rally attempt lacking volume. Swarmik marks $68,931 as the "imbalance zone"—a spot where price stalls and both bulls and bears wait for the other to flinch. If $68,931 fails, $70K becomes a short-term top, not a springboard.
### The Middle Ten: Each Layer Tests Market Conviction
From $66,638 down to $53,739, Swarmik plots ten support levels tagged with terms like "reversal line," "psychological level," and "Fibonacci level."
Technical traders love these labels, but what should regular investors watch?
**Volume.**
These levels matter because they're where significant trading historically occurred—not because lines were drawn. $66,638 was the March pullback low; $64,491 was February's pre-breakout consolidation; $62,345 aligns with the 0.618 Fibonacci retracement.
The problem? If Bitcoin slices through these levels, each breach triggers stop-losses. By the time it hits $55,905—labeled the "fair value gap"—market sentiment could already be cracking.
### The Final Six: Breach Here and the Bull Structure Hangs by a Thread
Below $51,612, Swarmik's terms grow darker: "demand zone," "supply zone," "liquidity pool."
The most ominous are $43,026 ("death zone") and $38,733 ("last support fortress"). The analyst states that falling through $38,733 toward $34,732 means Bitcoin is "completely done."
Harsh, but not wrong.
$38,733 is where Bitcoin consolidated before breaking $40K last December. Losing that level would signal a full reversal of the uptrend that started at $25K. That's not just a technical breakdown—it's a collapse in market confidence, likely triggering institutional exits, retail panic, and a narrative shift.
### So What Should Investors Watch?
Don't memorize 17 numbers. The chart's real value is defining three key battlegrounds:
**1. $70K–$65K: The Bull Market's Pride Line**
Hold here, and high-range consolidation continues. Lose it, and a mid-term correction begins.
**2. $60K–$50K: The Bull Market's Cost Zone**
This is where many institutions built positions. They'll hold until they can't—then they'll sell.
**3. Below $40K: The Bull Market's Survival Line**
A drop here means structural damage—ignore support levels and reassess everything.
**Right now, focus on volume.** If Bitcoin hits a support level and volume spikes then contracts quickly, buyers are stepping in. If it drips lower on low volume, that's real danger.
Also, watch Ethereum. Swarmik tags $60,198 as the "Ethereum breakout zone" for a reason—their correlation is tightening, and one won't crash alone.
### One Final Reality Check
Technical analysis shows possibilities, not certainties. These 17 defense lines don't predict where Bitcoin will fall—they warn that this bull run isn't as sturdy as it seems.
The real risk isn't a pullback; it's a pullback that never recovers.
Let's hope we never see that $34,732 "completely done" level.
DISCLAIMER:
1. All content on this website (including but not limited to articles, data, charts, and analyses) is for general informational purposes only and does not constitute any form of investment advice, trading recommendation, or financial guidance.
2. Cryptocurrencies and digital assets are subject to extreme price volatility and high investment risk; you may lose part or all of your principal. Past performance does not predict future results.
3. The information on this website is based on sources we believe to be reliable, but we do not guarantee its accuracy, completeness, or timeliness. Any investment decisions made based on this website’s information are at your own risk.
4. We strongly recommend that you conduct your own thorough research and consult an independent, licensed financial advisor before making any investment decisions.