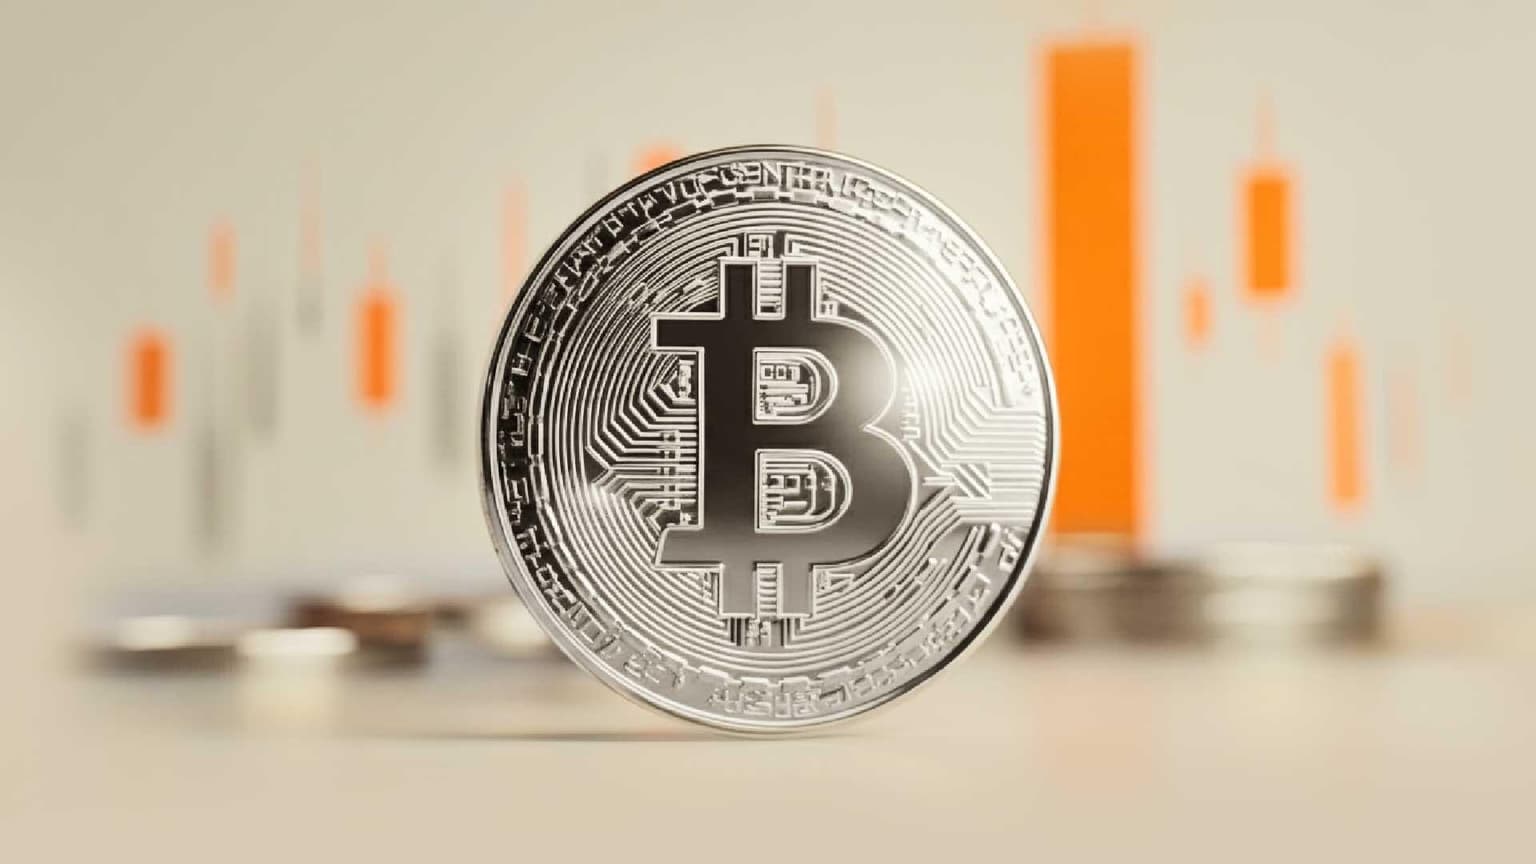
Bitcoin's Rally Was Driven by a Few Trading Windows
2026-05-12 09:41:32
## Liquidity Moved in Windows, Not in a Straight Line

On May 6, 2026, [CoinDesk](https://www.coindesk.com/markets/2026/05/06/bitcoin-s-price-rally-has-a-hidden-rhythm-here-are-the-hours-and-days-driving-gains) cited Velo data showing Bitcoin's roughly 31% rebound from below $63,000 on Feb. 6 to above $80,000 did not build evenly through the day. That matters because the rally's main question is not just how far price moved, but which sessions kept absorbing flow when momentum mattered.
## APAC and U.S. Hours Carried the Bulk of the Move
Velo split the day into three eight-hour blocks: APAC from 00:00 to 08:00 UTC, Europe from 08:00 to 16:00 UTC, and the U.S. from 16:00 to 00:00 UTC. Across the three-month sample, APAC contributed about 13%, U.S. hours about 11.5%, and Europe about 6.5%.
That gap says more than the raw returns do. It shows the advance was not a broad, evenly shared grind higher. Price discovery was concentrated in two windows, while Europe lagged. When the same markets keep doing the heavy lifting, the move can look strong on the chart but still be structurally narrow underneath.
### Why that concentration matters
A narrow leadership pattern usually changes the quality of follow-through. If a rally is repeatedly carried by a small set of time windows, pullbacks can deepen faster once those windows weaken. The practical reading is simple: breadth matters even in a liquid market, because concentrated participation leaves the trend more exposed to rotation.
## April Marked the Leadership Shift
The more interesting change came in early April. During most of February and March, U.S. session returns were flat to negative, while APAC did most of the repair work. In April, U.S. hours turned clearly positive.
That transition is the real structural signal in the sample. It suggests the market did not just bounce once and keep rising; it changed who was willing, or able, to support price during the follow-through phase. When leadership rotates, volatility usually changes with it. Same headline price, different internal quality.
## Midnight UTC and Monday Are Signals of Rhythm, Not Guarantees
On the hourly view, 00:00 to 01:00 UTC was the strongest single hour at roughly 0.10% average return. 15:00 UTC ranked second, while 06:00 UTC was the weakest. By weekday, Monday averaged about +1.5%, Wednesday about +0.65%, Friday about +0.3%, and Thursday about -0.55%. Weekdays averaged roughly +0.4%, while weekends were around -0.25%.
These patterns are useful, but only as a filter. They do not tell us where price must go next. They do tell us where liquidity has recently been easiest to find, which is different. A statistic like Monday strength is only meaningful if the same window also keeps showing depth, not just a one-off burst.
## What This Sample Can and Cannot Prove
This kind of session study is valuable because it turns a vague rally narrative into a testable framework. Instead of asking whether Bitcoin is strong, the better question is whether the same sessions keep producing the best returns, whether the lead rotates again, and whether that rotation shows up in breadth, not just in spot price.
It also has a clear limit. The sample is descriptive, not predictive. It does not establish a trade rule, and it does not override macro conditions, risk sentiment, or crypto-specific flows. It simply gives readers a cleaner way to track whether the move is becoming broader or remaining session-dependent.
---
Author: [Alex Chen](https://x.com/AlexC0in) | Alex has followed blockchain technology since 2021, focusing on DeFi and on-chain data analysis
Source: [coindesk.com](https://www.coindesk.com/markets/2026/05/06/bitcoin-s-price-rally-has-a-hidden-rhythm-here-are-the-hours-and-days-driving-gains)
DISCLAIMER:
1. All content on this website (including but not limited to articles, data, charts, and analyses) is for general informational purposes only and does not constitute any form of investment advice, trading recommendation, or financial guidance.
2. Cryptocurrencies and digital assets are subject to extreme price volatility and high investment risk; you may lose part or all of your principal. Past performance does not predict future results.
3. The information on this website is based on sources we believe to be reliable, but we do not guarantee its accuracy, completeness, or timeliness. Any investment decisions made based on this website’s information are at your own risk.
4. We strongly recommend that you conduct your own thorough research and consult an independent, licensed financial advisor before making any investment decisions.